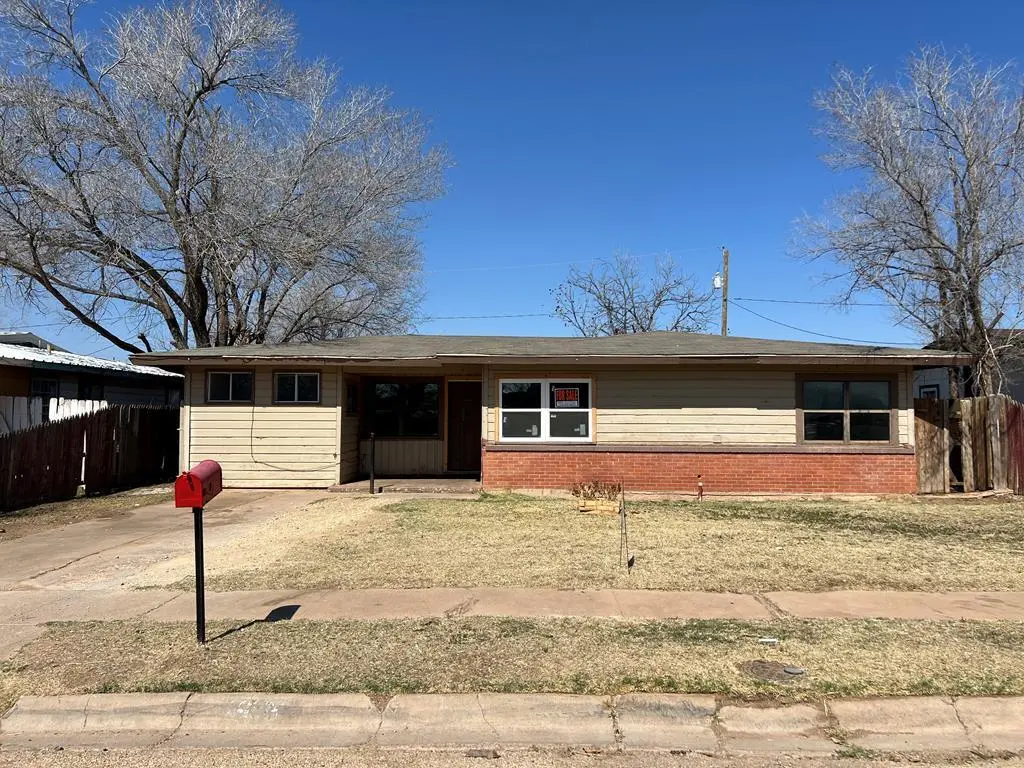
409 20th St · Snyder, TX
Flood risk 1/10 · Minimal
- FEMA flood zone
- X
- Chance of flooding over 30 yrs
- 0.0%
- Est. flood insurance / yr
- $507 – $1,088
Fire risk 8/10 · Major
- Est. fire insurance / yr
- $1,222 – $2,270
Heat risk 6/10 · Moderate
- Hot days now (above 103°F)
- 7 days/yr
- Hot days in 30 yrs
- 21 days/yr
Wind risk 3/10 · Minor
- Chance of severe wind over 30 yrs
- 4.0%
Air-quality risk 1/10 · Minimal
- Unhealthy air days now
- 0 days/yr
- Unhealthy air days in 30 yrs
- 0 days/yr
Risk factors via First Street. Map © Google.
Why this score? — see what drove the B- grade
The composite is a weighted blend of 9 inputs, each scored 0–100. Each bar is that input's sub-score; the figure is the points it added to the 100-point composite (weight × sub-score).
- Cash flow +30.0/30.0
- 1% rule +10.0/10.0
- DSCR +10.0/10.0
- ARV discount +7.5/15.0
- Livability +3.1/5.0
- Schools +2.8/10.0
- Rent growth +2.5/5.0
- Condition / age +2.5/5.0
- Appreciation +0.0/10.0
$49,900
🖨 Deal sheet 📄 Offer letter ✓ Due diligence
Listing remarks MLS
OK WHAT CAN I SAY ABOUT THIS FABULOUS HOT DEAL FOR THE BEST FLIPPER IN TEXAS! THE OWNER WILL FINANCE WITH $5000DOWN, $498MONTHLY, 10%INT. THIS IS YOUR NEXT FIX AND FLIP
Key facts
- 7,405 sq ft lot
- Parking
- Built 1954
Neighborhood map
What this means for you Summary
Snapshot
- This is a 3-bed/1.0-bath single-family listed at $50k.
Deal economics
- At list price, monthly cash flow is $612 ($7k/yr) — positive.
- The deal already cash-flows at list — no discount required.
- Meets the 1% rule at list price ($1k rent vs $50k).
- Recommended offer: $49k (1.5% below list) — sets the bar for market timing.
Location & tenants
- Location reads 61/100 on livability (#1,008 in TX) — a middle-class / working-renter tenant base. Strengths: cost of living A+, housing A+; Watch: health & safety C-, employment D+, schools F.
- Snyder ISD (town): math 33% / reading 31% proficiency, ranked #577 of 826 in TX (top 70%) — families likely to look elsewhere, expect single-tenant / working-renter base with shorter leases.
- Market conditions: 107 active listings in the ZIP; 3 comparable units currently listed for rent nearby; rentals lingering (median 44d on market — plan ~5-8 weeks vacancy on turnover, expect pricing pressure); 100% of comp listings sitting > 30 days — soft ceiling on asking rent; 32 units permitted in Scurry County in 2024 (0 in 5+ unit buildings).
Forward outlook
- Local home prices are declining (-3.0%/yr); year-one equity from $345 of loan paydown is wiped out by about $1k of value loss. Plan a longer hold.
- Scurry County population projected at +22% by 2050 — long-run rental-demand tailwind backs the buy-and-hold thesis.
- At projected returns (-3.0% appreciation + 3.0% rent growth), your $14k cash investment doubles in ~3 years — after that, you're playing with house money.
Negotiation context
- It's been on market 15 days — a 2% lower offer ($49k) is reasonable based on typical stale-listing flexibility.
- 2 sale attempts with the ask held roughly flat each time — persistent listings suggest the price (not the market) is what's stuck; bring a comps-based counter.
Risks & watch-outs
- Watch-outs: built in 1954 — expect roof / HVAC / electrical / plumbing capex.
- Climate carrying-cost: severe wildfire risk; extreme-heat days projected 7→21/yr by 2055 (HVAC capex compounding) — expect insurance premiums to compound above CPI over the hold.
Questions for the listing agent
- Built in 1954 — when were the roof, HVAC, electrical panel, plumbing, and water heater last replaced?
- Is there a deadline driving the sale (1031 exchange, divorce, estate, relocation)? That informs how much negotiation room exists.
- Schools are F-rated, which usually means shorter tenancies and higher turnover. Who's the typical renter profile here, and what's been the actual vacancy rate?
- Crime grade is F in this area — have there been break-ins, vandalism, or insurance claims at this property in the last 3 years? What carrier currently insures it and at what premium?
- What's the average days-on-market for RENTAL listings here right now (not sales)? A rising rental-DOM trend means longer vacancies and softer asking-rent achievability than the comps imply.
- What's the recent tenant-quality profile in this submarket — average credit score on applications, eviction rate, late-payment / NSF rate, and stable-employment percentage? A property-management company in the area should have these aggregated.
- How much new for-sale + rental construction is in the pipeline within 1–3 miles? Heavy new supply typically softens prices + rents 12–24 months out; constrained supply supports both.
Investment metrics
- 1% rule
- 2.52% ✓
- Cap rate
- 21.01%
- Cash-on-cash
- 52.56%
- DSCR
- 3.34
- GRM
- 3.3
CMA / ARV
- ARV (median comp)
- $29,504
- List price
- $49,900
- Delta
- 69.13%
- Verdict
- OVERPRICED
- Comps
- 1 within 2.0 mi
Projected returns pro-forma
-3.0% appreciation · 3.0% rent growth · sell at horizon
- IRR
- 50.6%
- Equity multiple
- 3.21×
- Total profit
- $30,930
- Equity at exit
- $7,440
- IRR
- 56.0%
- Equity multiple
- 6.53×
- Total profit
- $77,290
- Equity at exit
- $4,314
Cash invested: $13,972 (down + closing). Projections, not guarantees.
Landlord ↔ Tenant lean methodology
- Overall (STATE)
- 87 Strongly Landlord-Friendly
- State Texas
- 87 Strongly Landlord-Friendly · R+5
- County
- — inherits STATE
- City
- — inherits STATE
ZIP-level market 79549
- Active inventory
- 107
- Price-to-rent
- 3.3×
Monthly cashflow live
- Estimated rent
- $1,259 medium interval (Pro) →
- Mortgage (P&I)
- −$262
- Tax from tax record
- −$100 /mo · $1,198/yr
- Insurance
- −$21
- HOA
- −$0
- Vacancy / Maint / Mgmt
- −$264
- Net cashflow
- $612
Break-even live
UW: 25.0% down · 7.5% · 30yr · 1.5% tax · 5.0% vac · 8.0% maint · 8.0% mgmt
Financing live
Cash to close
- Down payment
- $12,475
- Closing costs
- $1,497
- Reserves months
- —
- Total cash needed
- —
Loan-product check · same deal, 3 products live
Conventional
25% down · 7.5% · 30yr
- Down + closing
- —
- Monthly P&I
- —
- Monthly cashflow
- —
- DSCR
- —
- Eligible?
- —
Personal DTI + credit; lowest rate.
DSCR
20% down · 8.5% · 30yr
- Down + closing
- —
- Monthly P&I
- —
- Monthly cashflow
- —
- DSCR
- —
- Eligible?
- —
No personal income docs; deal must DSCR.
Hard money
10% down · 12.0% · 12mo
- Down + closing
- —
- Monthly P&I
- —
- Monthly cashflow
- —
- DSCR
- —
- Eligible?
- —
Short-term bridge; refi at stabilization.
Rent comps 3 comps
| Address | Beds | Baths | Sqft | Rent | $/sqft | DOM | Units | Dist |
|---|---|---|---|---|---|---|---|---|
| 2807 Avenue E Snyder, TX | 2.0 | 2.0 | 1420 | $1,300 | $0.92 | 44d | 1 | 0.58mi |
| 307 34th St Snyder, TX | 3.0 | 1.0 | 1108 | $1,200 | $1.08 | 43d | 1 | 0.95mi |
| 1021 37th St Snyder, TX | 3.0 | 2.0 | 1300 | $1,248 | $0.96 | 43d | 1 | 1.19mi |
Listing history 11 events
-
2026-05-02status Pending 168-char remark
Show marketing remark (168 chars)
OK WHAT CAN I SAY ABOUT THIS FABULOUS HOT DEAL FOR THE BEST FLIPPER IN TEXAS! THE OWNER WILL FINANCE WITH $5000DOWN, $498MONTHLY, 10%INT. THIS IS YOUR NEXT FIX AND FLIP
-
2026-04-28status Active 168-char remark
Show marketing remark (168 chars)
OK WHAT CAN I SAY ABOUT THIS FABULOUS HOT DEAL FOR THE BEST FLIPPER IN TEXAS! THE OWNER WILL FINANCE WITH $5000DOWN, $498MONTHLY, 10%INT. THIS IS YOUR NEXT FIX AND FLIP
-
2026-04-26status Pending 168-char remark
Show marketing remark (168 chars)
OK WHAT CAN I SAY ABOUT THIS FABULOUS HOT DEAL FOR THE BEST FLIPPER IN TEXAS! THE OWNER WILL FINANCE WITH $5000DOWN, $498MONTHLY, 10%INT. THIS IS YOUR NEXT FIX AND FLIP
-
2026-04-15$49,900 Active 168-char remark
Show marketing remark (168 chars)
OK WHAT CAN I SAY ABOUT THIS FABULOUS HOT DEAL FOR THE BEST FLIPPER IN TEXAS! THE OWNER WILL FINANCE WITH $5000DOWN, $498MONTHLY, 10%INT. THIS IS YOUR NEXT FIX AND FLIP
-
2025-12-11soldstatus
-
2025-12-11soldstatus
-
2022-06-03soldstatus
-
2022-02-25soldstatus
-
2019-05-15soldstatus
-
2019-03-25soldstatus
-
2017-11-27soldstatus
ⓘ Source: listings_history table (triggers on properties + properties_extension) + one-shot
backfill from property_details.listing_events for pre-trigger history.
Tax reassessment forecast TX · Resets to sale price
- Current annual tax
- $1,198 · $100/mo
- Projected year-2 tax
- $1,198 · $100/mo
- Expected delta
- $0/yr ($0/mo · 0.0%)
ⓘ Screening estimate from a state-policy table — verify with the county assessor before closing.
Climate risk First Street
- Flood 1/10 Low FEMA zone X · 0% chance over 30 yrs
- Wildfire 8/10 Severe
- Heat 6/10 Major 7 d/yr ≥103°F today · 21 d/yr by 30 yrs out
- Wind 3/10 Moderate 4% chance of damaging wind over 30 yrs
- Air quality 1/10 Low 0 unhealthy d/yr today · 0 by 30 yrs out
Nearby sold comps map
Loading sold comps map…
Walkable amenities ~0.75 mi
Loading nearby amenities…
Taxation est. · year 1
- Rental income
- $15,102
- − Mortgage interest
- −$2,795
- − Property taxes
- −$1,198
- − Insurance
- −$250
- − Repairs & maintenance
- −$1,208
- − Management
- −$1,208
- − Depreciation
- −$1,452
- Taxable income
- $6,992
- Est. tax owed @ 24.0%
- −$1,678
- After-tax cash flow
- $5,665/yr
For passive investors: Depreciation is non-cash, so a rental often shows a tax loss while cash-flowing — sheltering income. Rental losses are passive: they offset passive income freely, and up to $25,000/yr can offset ordinary (W-2) income if you actively participate and your MAGI is under $100k (phasing out to $0 by $150k); unused losses carry forward. On sale, claimed depreciation is recaptured at up to 25%, and gains may owe capital-gains tax (a 1031 exchange can defer both). Figures are a year-1 estimate at your 24.0% rate — not tax advice; consult a CPA.
Schools (NCES district)
- District
- Snyder ISD
- NCES district ID
- 4840650
- Math proficiency
- 33% ▼ -4.00%
- Reading proficiency
- 31% ▼ -1.00%
- Median HH income
- $48,075
- Composite
- 27.69/100
- National rank
- #6912
- State rank
- #577 of 826 in TX
Livability — Snyder
- Score
- 61/100
- State rank
- #1008
- US rank
- #17920
Category grades
Schools grade is shown separately in the Schools card above.
Census & demographics
- Census place
- Snyder, TX
- Population (ZIP)
- 15,505
Population outlook (Scurry County) Hauer SSP2
- Today (2025)
- 18,819 people
- By 2030
- 19,548 · +3.9%
- By 2040
- 21,178 · +12.5%
- By 2050
- 22,980 · +22.1%
- By 2075
- 27,055 · +43.8%
- By 2100
- 28,065 · +49.1%
Race, ethnicity, and origin ACS 2023
- Neighborhood character
- Diverse neighborhood (Simpson 0.58)
- Race & ethnicity
- White 48% Hispanic / Latino 44% Two or more races 14% Black 3% Native American 1%
- Hispanic origin (detail)
- Mexican 40%
- Common ancestry
- Slovak 1% Italian 1%
- Foreign-born
- 5% · Canada
- Languages at home
- 75% English-only · Spanish 25%
Political lean MEDSL · Scurry
- 2024 margin
- Solid R (+73.6) · D 12.8% · R 86.5%
- 2008→2024 swing
- -13.9pp toward R · 2008: -59.7pp · 2024: -73.6pp
- All cycles
- 2024: R+73.6 2020: R+71.0 2016: R+69.8 2012: R+65.4 2008: R+59.7
Not yet ingested
- Civics
- —
Market trends
- HPI YoY
- ▼ -96.76%
- Current HPI
- 137.2297
- Rent YoY
- —
- Metro
- —
- State GDP YoY
- ▲ 3.95%
- F500 in state
- 110
Industry mix (Fortune 500 HQ in TX)
| Industry | F500 HQs | Revenue |
|---|---|---|
| Energy | 16 | $1,198B |
|
||
| Technology | 5 | $198B |
|
||
| Engineering / Construction | 4 | $72B |
|
||
| Energy Services | 3 | $60B |
|
||
| Utilities | 3 | $41B |
|
||
| Healthcare | 2 | $330B |
|
||
Price history
11 events — show timeline
- 2026-05-02 Pending — PBBOR
- 2026-04-28 Relisted — PBBOR
- 2026-04-26 Pending — PBBOR
- 2026-04-15 Listed $49,900 PBBOR
- 2025-12-11 Sold (Public Records) — Public Records
- 2025-12-11 Sold (Public Records) — Public Records
- 2022-06-03 Sold (Public Records) — Public Records
- 2022-02-25 Sold (Public Records) — Public Records
- 2019-05-15 Sold (Public Records) — Public Records
- 2019-03-25 Sold (Public Records) — Public Records
- 2017-11-27 Sold (Public Records) — Public Records
Property tax history
+1.8%/yrLatest (2025): $1,198 · +27.2% YoY. Source: county tax records.
Cash-flow waterfall
monthlySold comps — $/sqft
last 12 mo · ≤1 miLoading sold comps…