880 E F St #8 · Oakdale, CA
Flood risk 1/10 · Minimal
- FEMA flood zone
- X (unshaded)
- Chance of flooding over 30 yrs
- 0.0%
- Est. flood insurance / yr
- $507 – $1,088
Fire risk 7/10 · Major
- Est. fire insurance / yr
- $659 – $1,223
Heat risk 7/10 · Major
- Hot days now (above 102°F)
- 7 days/yr
- Hot days in 30 yrs
- 15 days/yr
Wind risk 1/10 · Minimal
- Chance of severe wind over 30 yrs
- —
Air-quality risk 10/10 · Severe
- Unhealthy air days now
- 34 days/yr
- Unhealthy air days in 30 yrs
- 38 days/yr
Risk factors via First Street. Map © Google.
Why this score? — see what drove the B+ grade
The composite is a weighted blend of 9 inputs, each scored 0–100. Each bar is that input's sub-score; the figure is the points it added to the 100-point composite (weight × sub-score).
- Cash flow +30.0/30.0
- ARV discount +12.8/15.0
- 1% rule +10.0/10.0
- DSCR +10.0/10.0
- Condition / age +4.0/5.0
- Schools +3.2/10.0
- Livability +3.2/5.0
- Rent growth +2.5/5.0
- Appreciation +0.0/10.0
$69,950
🖨 Deal sheet 📄 Offer letter ✓ Due diligence
Listing remarks
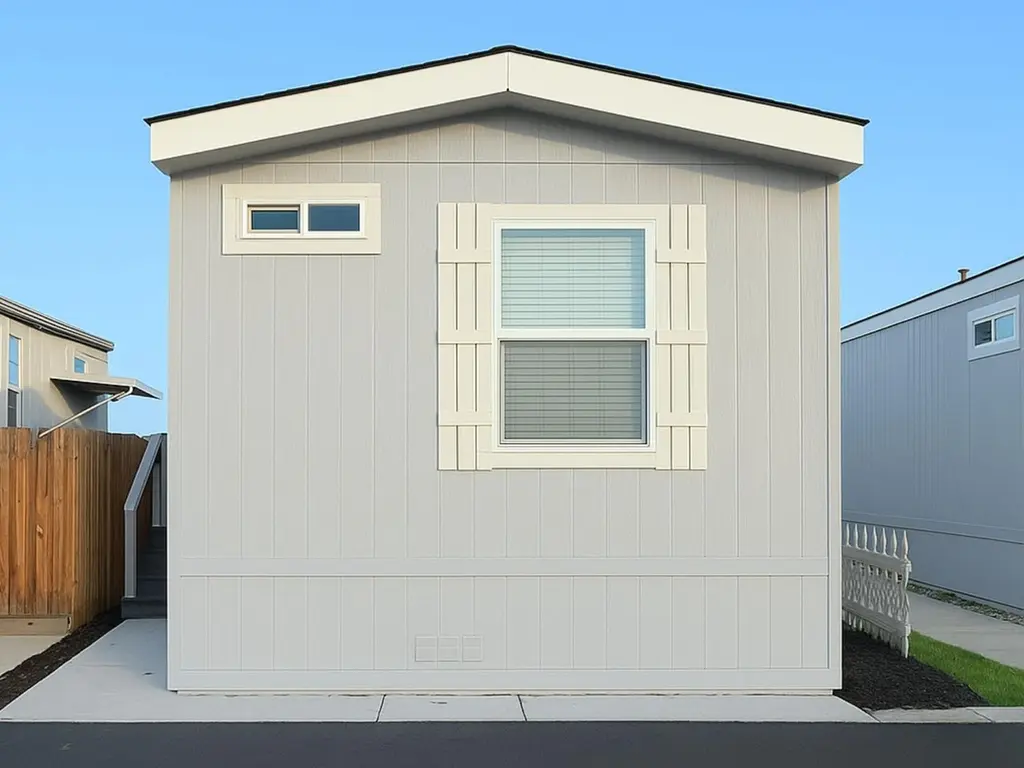
Brand new 2026 Champion home in Haven Inn MHC, Oakdale! This stylish 2-bedroom, 1-bathroom home offers a bright open-concept kitchen and living room combo, featuring stone countertops and modern finishes throughout. Enjoy affordable space rent of only $745 per month. Located in Oakdale the Cowboy Capital of the Worldyou'll appreciate being just minutes from shopping, restaurants, and daily conveniences. A fantastic opportunity to own a brand-new home in a welcoming community.
Key facts
- Stone countertops
- Open-concept kitchen
- Modern finishes
Tags
Neighborhood map
What this means for you Summary
Snapshot
- This is a 2-bed/1.0-bath manufactured listed at $70k. Condition is rated good.
Deal economics
- At list price, monthly cash flow is $638 ($8k/yr) — positive.
- The deal already cash-flows at list — no discount required.
- Meets the 1% rule at list price ($1k rent vs $70k).
- Recommended offer: $62k (12.0% below list) — sets the bar for market timing.
- Cap rate 17.2% vs local median 2.7% in Oakdale — top-decile yield for the area; either an underpriced asset or a hidden risk that comps aren't pricing in. Stress-test before assuming the spread holds.
Location & tenants
- Location reads 64/100 on livability (#412 in CA) — a middle-class / working-renter tenant base. Strengths: housing A+, health & safety B; Watch: commute F, cost of living F.
- Oakdale Joint Unified (suburban): math 27% / reading 45% proficiency, ranked #256 of 517 in CA (top 50%) — families likely to look elsewhere, expect single-tenant / working-renter base with shorter leases.
- Market conditions: 199 active listings in the ZIP; 3 comparable units currently listed for rent nearby; rentals lingering (median 44d on market — plan ~5-8 weeks vacancy on turnover, expect pricing pressure); 67% of comp listings sitting > 30 days — soft ceiling on asking rent; solid renter incomes; 923 units permitted in Stanislaus County in 2024 (63 in 5+ unit buildings).
Forward outlook
- Local home prices are declining (-3.0%/yr); year-one equity from $484 of loan paydown is wiped out by about $2k of value loss. Plan a longer hold.
- Stanislaus County population projected at +14% by 2050 — modest demand growth; plan on rents tracking national, not racing it.
- At projected returns (-3.0% appreciation + 3.0% rent growth), your $20k cash investment doubles in ~4 years — after that, you're playing with house money.
Negotiation context
- It's been on market 196 days — a 12% lower offer ($62k) is reasonable based on typical stale-listing flexibility.
Risks & watch-outs
- Climate carrying-cost: major wildfire risk; extreme-heat days projected 7→15/yr by 2055 (HVAC capex compounding) — expect insurance premiums to compound above CPI over the hold.
Questions for the listing agent
- It's been on market 196 days. Have you received any prior offers? Is the seller open to a 12% concession, seller financing, or rate buy-down credit?
- Why hasn't it sold? Are there any deal-killer items the seller is aware of (foundation, flood, title, zoning, code violations)?
- Is there a deadline driving the sale (1031 exchange, divorce, estate, relocation)? That informs how much negotiation room exists.
- What's the average days-on-market for RENTAL listings here right now (not sales)? A rising rental-DOM trend means longer vacancies and softer asking-rent achievability than the comps imply.
- What's the recent tenant-quality profile in this submarket — average credit score on applications, eviction rate, late-payment / NSF rate, and stable-employment percentage? A property-management company in the area should have these aggregated.
- How much new for-sale + rental construction is in the pipeline within 1–3 miles? Heavy new supply typically softens prices + rents 12–24 months out; constrained supply supports both.
Investment metrics
- 1% rule
- 2.03% ✓
- Cap rate
- 17.23%
- Cash-on-cash
- 39.06%
- DSCR
- 2.74
- GRM
- 4.1
CMA / ARV
- ARV (median comp)
- $79,346
- List price
- $69,950
- Delta
- -11.84%
- Verdict
- UNDERPRICED
- Comps
- 2 within 1.0 mi
Show comp detail 2 sales within ~0.75 mi
| Address | Dist | Beds/Ba | Sqft | Sold | Price | $/sf | Match |
|---|---|---|---|---|---|---|---|
| 927 E F St #4 | 0.13mi | 2/1.0 | 533 (+2%) | 2mo | $74,950 | $141 | 88 |
| 880 E F St #6 | 0.00mi | 2/1.0 | 540 (+4%) | 23mo | $75,950 | $141 | 75 |
Match score weights: distance 35% · size 25% · config 20% · recency 20%. Top-matched comps best support the ARV.
Projected returns pro-forma
-3.0% appreciation · 3.0% rent growth · sell at horizon
- IRR
- 35.3%
- Equity multiple
- 2.50×
- Total profit
- $29,290
- Equity at exit
- $10,430
- IRR
- 42.1%
- Equity multiple
- 4.98×
- Total profit
- $77,876
- Equity at exit
- $6,048
Cash invested: $19,586 (down + closing). Projections, not guarantees.
Landlord ↔ Tenant lean methodology
- Overall (STATE)
- 18 Strongly Tenant-Friendly
- State California
- 18 Strongly Tenant-Friendly · D+13
- County
- — inherits STATE
- City
- — inherits STATE
ZIP-level market 95361
- Active inventory
- 199
- Price-to-rent
- 4.1×
Monthly cashflow live
- Estimated rent
- $1,419 medium interval (Pro) →
- Mortgage (P&I)
- −$367
- Tax est. 1.5%
- −$87 /mo · $1,049/yr
- Insurance
- −$29
- HOA
- −$0
- Vacancy / Maint / Mgmt
- −$298
- Net cashflow
- $638
Break-even live
UW: 25.0% down · 7.5% · 30yr · 1.5% tax · 5.0% vac · 8.0% maint · 8.0% mgmt
Financing live
Cash to close
- Down payment
- $17,488
- Closing costs
- $2,098
- Reserves months
- —
- Total cash needed
- —
Loan-product check · same deal, 3 products live
Conventional
25% down · 7.5% · 30yr
- Down + closing
- —
- Monthly P&I
- —
- Monthly cashflow
- —
- DSCR
- —
- Eligible?
- —
Personal DTI + credit; lowest rate.
DSCR
20% down · 8.5% · 30yr
- Down + closing
- —
- Monthly P&I
- —
- Monthly cashflow
- —
- DSCR
- —
- Eligible?
- —
No personal income docs; deal must DSCR.
Hard money
10% down · 12.0% · 12mo
- Down + closing
- —
- Monthly P&I
- —
- Monthly cashflow
- —
- DSCR
- —
- Eligible?
- —
Short-term bridge; refi at stabilization.
Rent comps 3 comps
| Address | Beds | Baths | Sqft | Rent | $/sqft | DOM | Units | Dist |
|---|---|---|---|---|---|---|---|---|
| 325 W H St Oakdale, CA | 2.0 | 1.0 | 700 | $1,475 | $2.11 | 43d | 1 | 0.66mi |
| 250 S Wood Ave Unit 9 Oakdale, CA | 1.0 | 1.0 | 564 | $950 | $1.68 | 43d | 1 | 1.15mi |
| 250 S Wood Ave Unit 32 Oakdale, CA | 1.0 | 1.0 | 564 | $950 | $1.68 | 13d | 1 | 1.16mi |
Listing history 16 events
-
2026-06-18days on market $69,950 Active 196 DOM
-
2026-06-17days on market $69,950 Active 195 DOM
-
2026-06-16days on market $69,950 Active 194 DOM
-
2026-06-15days on market $69,950 Active 193 DOM
-
2026-06-14days on market $69,950 Active 191 DOM
-
2026-06-13days on market $69,950 Active 190 DOM
-
2026-06-10days on market $69,950 Active 188 DOM
-
2026-06-09days on market $69,950 Active 187 DOM
-
2026-06-08days on market $69,950 Active 186 DOM
-
2026-06-07days on market $69,950 Active 185 DOM
-
2026-06-05days on market $69,950 Active 182 DOM
-
2026-06-03days on market $69,950 Active 181 DOM
-
2026-06-02days on market $69,950 Active 180 DOM
-
2026-06-01days on market $69,950 Active 179 DOM
-
2026-05-31days on market $69,950 Active 178 DOM
-
2026-05-30days on market $69,950 Active 177 DOM
ⓘ Source: listings_history table (triggers on properties + properties_extension) + one-shot
backfill from property_details.listing_events for pre-trigger history.
Climate risk First Street
- Flood 1/10 Low FEMA zone X (unshaded) · 0% chance over 30 yrs
- Wildfire 7/10 Severe
- Heat 7/10 Severe 7 d/yr ≥102°F today · 15 d/yr by 30 yrs out
- Wind 1/10 Low
- Air quality 10/10 Extreme 34 unhealthy d/yr today · 38 by 30 yrs out
Nearby sold comps map
Loading sold comps map…
Walkable amenities ~0.75 mi
Loading nearby amenities…
Taxation est. · year 1
- Rental income
- $17,027
- − Mortgage interest
- −$3,918
- − Property taxes
- −$1,049
- − Insurance
- −$350
- − Repairs & maintenance
- −$1,362
- − Management
- −$1,362
- − Depreciation
- −$2,035
- Taxable income
- $6,950
- Est. tax owed @ 24.0%
- −$1,668
- After-tax cash flow
- $5,982/yr
For passive investors: Depreciation is non-cash, so a rental often shows a tax loss while cash-flowing — sheltering income. Rental losses are passive: they offset passive income freely, and up to $25,000/yr can offset ordinary (W-2) income if you actively participate and your MAGI is under $100k (phasing out to $0 by $150k); unused losses carry forward. On sale, claimed depreciation is recaptured at up to 25%, and gains may owe capital-gains tax (a 1031 exchange can defer both). Figures are a year-1 estimate at your 24.0% rate — not tax advice; consult a CPA.
Condition & rehab AI · 12 photos
This brand-new 2026 Champion home in Haven Inn MHC, Oakdale, is move-in ready with modern finishes and a bright open-concept layout. It offers a great opportunity to own a brand-new home in a welcoming community.
Value-add opportunities
- Both Landscaping — Enhances curb appeal and adds value
- Both Painting — Fresh paint can make a home more appealing
- Both Landscaping — Enhances curb appeal and adds value
Renovation cost estimate screening
Value-add ROI direction
- Both Landscaping — Enhances curb appeal and adds value ↑
- Both Painting — Fresh paint can make a home more appealing ↑
- Both Landscaping — Enhances curb appeal and adds value ↑
ⓘ Cost ranges are severity-bucket heuristics (US national rule-of-thumb). Get contractor quotes + a written scope before underwriting a rehab budget.
Schools (NCES district)
- District
- Oakdale Joint Unified
- NCES district ID
- 0600062
- Math proficiency
- 27% ▼ -13.00%
- Reading proficiency
- 45% ▼ -7.00%
- Median HH income
- $60,377
- Composite
- 32.1/100
- National rank
- #5805
- State rank
- #256 of 517 in CA
Livability — Oakdale
- Score
- 64/100
- State rank
- #412
- US rank
- #14042
Category grades
Schools grade is shown separately in the Schools card above.
Census & demographics
- Census place
- Oakdale, CA
- County
- Stanislaus County · 445,786 people
- City population
- 34,810
- Metro
- Modesto, CA
- Population (ZIP)
- 34,810
- Household income
- $92,963
- Rent vs Own
- Severe rent burden
- 1276.0
Population outlook (Stanislaus County) Hauer SSP2
- Today (2025)
- 579,493 people
- By 2030
- 598,000 · +3.2%
- By 2040
- 630,930 · +8.9%
- By 2050
- 658,300 · +13.6%
- By 2075
- 712,363 · +22.9%
- By 2100
- 719,805 · +24.2%
Race, ethnicity, and origin ACS 2023
- Neighborhood character
- Majority White (61%)
- Race & ethnicity
- White 61% Hispanic / Latino 30% Two or more races 18% Asian 2%
- Hispanic origin (detail)
- Mexican 25%
- Common ancestry
- Russian 5% Italian 4% Iranian 2%
- Foreign-born
- 11% · Canada, China
- Languages at home
- 80% English-only · Spanish 18% German/W. Germanic 1% Other Indo-European 1%
Political lean MEDSL · Stanislaus
- 2024 margin
- R (+11.0) · D 43.2% · R 54.2% · Other 2.6%
- 2008→2024 swing
- -12.7pp toward R · 2008: 1.7pp · 2024: -11.0pp
- All cycles
- 2024: R+11.0 2020: D+0.8 2016: D+0.6 2012: D+0.7 2008: D+1.7
Not yet ingested
- Civics
- —
Market trends
- HPI YoY
- ▼ -507.52%
- Current HPI
- 283.0924
- Rent YoY
- —
- Metro
- Modesto, CA
- State GDP YoY
- ▲ 3.21%
- F500 in state
- 116
Industry mix (Fortune 500 HQ in CA)
| Industry | F500 HQs | Revenue |
|---|---|---|
| Technology | 27 | $1,492B |
|
||
| Financial Services | 3 | $174B |
|
||
| Retail | 3 | $44B |
|
||
| Insurance | 3 | $26B |
|
||
| Media / Entertainment | 2 | $115B |
|
||
| Pharmaceuticals / Biotech | 2 | $62B |
|
||
Cash-flow waterfall
monthlySold comps — $/sqft
last 12 mo · ≤1 miLoading sold comps…