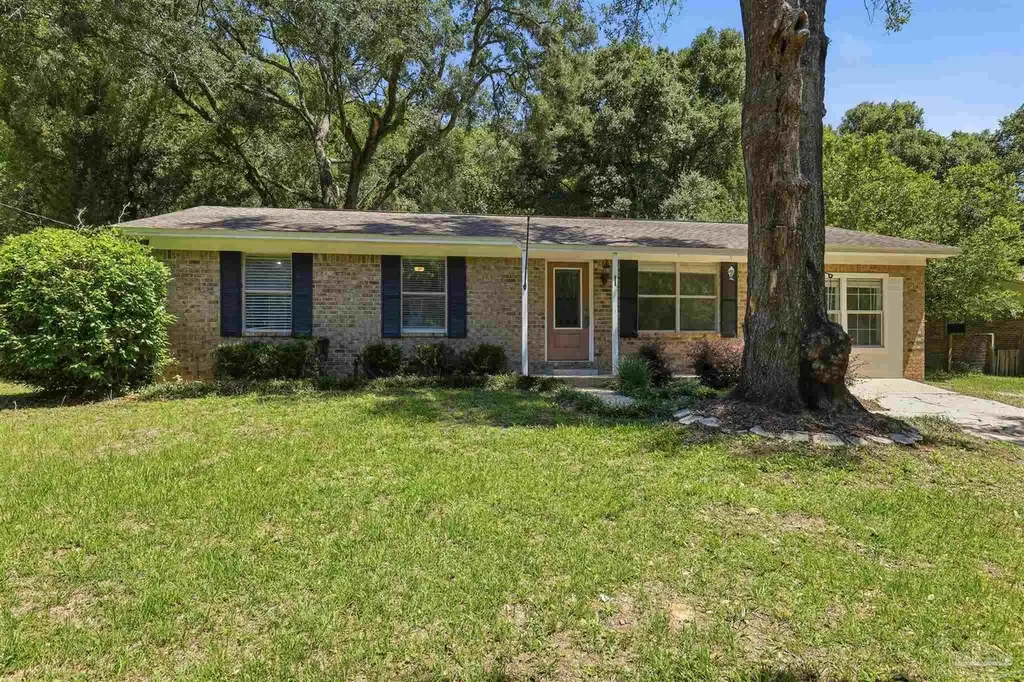
6630 Helms Rd · Bellview, FL
Flood risk 1/10 · Minimal
- FEMA flood zone
- X (unshaded)
- Chance of flooding over 30 yrs
- 0.0%
- Est. flood insurance / yr
- $507 – $1,088
Fire risk 3/10 · Minor
- Est. fire insurance / yr
- $947 – $1,759
Heat risk 10/10 · Severe
- Hot days now (above 105°F)
- 6 days/yr
- Hot days in 30 yrs
- 19 days/yr
Wind risk 9/10 · Severe
- Chance of severe wind over 30 yrs
- 99.0%
Air-quality risk 1/10 · Minimal
- Unhealthy air days now
- 0 days/yr
- Unhealthy air days in 30 yrs
- 0 days/yr
Risk factors via First Street. Map © Google.
Why this score? — see what drove the C grade
The composite is a weighted blend of 9 inputs, each scored 0–100. Each bar is that input's sub-score; the figure is the points it added to the 100-point composite (weight × sub-score).
- Cash flow +20.1/30.0
- ARV discount +15.0/15.0
- DSCR +6.4/10.0
- 1% rule +4.4/10.0
- Rent growth +3.6/5.0
- Schools +3.6/10.0
- Livability +3.4/5.0
- Condition / age +2.5/5.0
- Appreciation +0.0/10.0
$230,000
🖨 Deal sheet (PDF) 📄 Offer letter ✓ Due diligence
Listing remarks MLS
You don't wait to wait on this one! This home is a three bedroom, two bathroom with over 1300 square feet! Just minutes away from Navy Federal and Beulah Elementary! Located in the Beulah community it has quick access to I-10 and convenient to all of Pensacola. The location is peaceful with woods both in front of and behind the home. This home features a new roof installed in 2018, engineered wood floors, and a updates throughout. The kitchen has been updated to feature stainless steel appliances, tile flooring, tiler backsplash, wainscoting, and a breakfast nook. All ceilings fans have been replaced. The AC/heater has also been replaced. Out back you'll notice great back porch for entertaining, a spacious fenced yard, and plenty of storage with a workshop and shed excellent for parking a vehicle or boat.. The home's color palette make it a perfect move-in ready home for you!
Key facts
- Ranch style home
- Storage shed
- Fenced in back yard
Tags
Property features AI
Finance
- Other: Located on a county-maintained road
- Financial info: Not specified
- HOA & community: No homeowners association
Exterior
- Parking: Driveway with open parking
- Security: Not specified
- Utilities: Public water; Septic tank sewer; Circuit breaker electrical service; Copper wiring
- Home design: Resale property; Single-family (not attached); One story; Homestead exempt
- Construction: Brick construction; Slab foundation; Built as a one-level home
- Exterior features: Shingle roof; Central access lot
Interior
- Kitchen: Electric water heater
- Bedrooms: Master bedroom on first floor (approx. 10.3' x 10.9'); Second bedroom on first floor (approx. 11.5' x 9'); Third bedroom on first floor (approx. 9.7' x 10.9')
- Flooring: Brick flooring
- Bathrooms: Two full bathrooms
- Heating & cooling: Central heating; Central air conditioning
- Interior features: Bonus room
- Laundry & utility: Not specified
Neighborhood map
What this means for you Summary
Snapshot
- This is a 3-bed/2.0-bath single-family listed at $230k.
Deal economics
- At list price, monthly cash flow is $287 ($3k/yr) — positive.
- The deal already cash-flows at list — no discount required.
- To meet the 1% rule (rent ≥ 1% of price), the offer needs to be $215k (6.5% below list).
- Recommended offer: $215k (6.5% below list) — sets the bar for 1% rule.
- Cap rate 7.8% vs local median 5.2% in Bellview — top-decile yield for the area; either an underpriced asset or a hidden risk that comps aren't pricing in. Stress-test before assuming the spread holds.
Location & tenants
- Location reads 67/100 on livability (#561 in FL) — a middle-class / working-renter tenant base. Strengths: cost of living A+, housing A+; Watch: schools D+, amenities F, commute F.
- Escambia (suburban): math 40% / reading 45% proficiency, ranked #56 of 73 in FL (top 77%) — families likely to look elsewhere, expect single-tenant / working-renter base with shorter leases.
- Market conditions: Rents rising fast (+4.4%/yr); 417 active listings in the ZIP; 6 comparable units currently listed for rent nearby; rentals at typical pace (median 24d on market — plan ~3-4 weeks tenant-placement turnaround); solid renter incomes; 1,479 units permitted in Escambia County in 2024 (0 in 5+ unit buildings).
- This rent runs 34% of the median local income ($75k/yr) — at the standard rent-burdened threshold; future hikes will face affordability resistance.
Forward outlook
- Local home prices are declining (-3.0%/yr); year-one equity from $2k of loan paydown is wiped out by about $7k of value loss. Plan a longer hold.
- Escambia County population projected at +13% by 2050 — modest demand growth; plan on rents tracking national, not racing it.
Negotiation context
- It's been on market 50 days — a 3% lower offer ($223k) is reasonable based on typical stale-listing flexibility.
- 5 sale attempts since 24y ago with the ask held roughly flat each time — persistent listings suggest the price (not the market) is what's stuck; bring a comps-based counter.
- Current owner paid $175k; 31% above their basis — modest negotiation headroom, anchor on the comps not their cost.
Risks & watch-outs
- Climate carrying-cost: severe wind risk, 99% chance of damaging wind over 30y; extreme-heat days projected 6→19/yr by 2055 (HVAC capex compounding) — expect insurance premiums to compound above CPI over the hold.
Questions for the listing agent
- It's been on market 50 days. Have you received any prior offers? Is the seller open to a 6% concession, seller financing, or rate buy-down credit?
- Is there a deadline driving the sale (1031 exchange, divorce, estate, relocation)? That informs how much negotiation room exists.
- Schools are D-rated, which usually means shorter tenancies and higher turnover. Who's the typical renter profile here, and what's been the actual vacancy rate?
- What's the average days-on-market for RENTAL listings here right now (not sales)? A rising rental-DOM trend means longer vacancies and softer asking-rent achievability than the comps imply.
- What's the recent tenant-quality profile in this submarket — average credit score on applications, eviction rate, late-payment / NSF rate, and stable-employment percentage? A property-management company in the area should have these aggregated.
- How much new for-sale + rental construction is in the pipeline within 1–3 miles? Heavy new supply typically softens prices + rents 12–24 months out; constrained supply supports both.
Investment metrics
- 1% rule
- 0.94% ✗
- Cap rate
- 7.79%
- Cash-on-cash
- 5.34%
- DSCR
- 1.24
- GRM
- 8.9
CMA / ARV
- ARV (median comp)
- $295,782
- List price
- $230,000
- Delta
- -22.24%
- Verdict
- UNDERPRICED
- Comps
- 20 within 1.0 mi
Show comp detail 12 sales within ~0.75 mi
| Address | Dist | Beds/Ba | Sqft | Sold | Price | $/sf | Match |
|---|---|---|---|---|---|---|---|
| 7320 Single Trce | 0.52mi | 3/2.0 | 1,384 (+2%) | 8mo | $253,000 | $183 | 65 |
| 6494 Paso Fino Dr | 0.43mi | 3/2.0 | 1,474 (+9%) | 4mo | $267,500 | $181 | 62 |
| 6068 Secretariat Way | 0.71mi | 3/2.0 | 1,272 (-6%) | 5mo | $255,000 | $200 | 53 |
| 5912 Percheron Dr Lot 5E | 0.51mi | 3/2.0 | 1,474 (+9%) | 14mo | $279,990 | $190 | 50 |
| 5913 Percheron Dr Lot 11D | 0.51mi | 3/2.0 | 1,474 (+9%) | 16mo | $280,990 | $191 | 48 |
| 6105 Secretariat Way | 0.65mi | 4/2.0 (+1) | 1,433 (+6%) | 8mo | $277,500 | $194 | 48 |
| 5925 Percheron Dr Lot 8D | 0.53mi | 3/2.0 | 1,474 (+9%) | 17mo | $280,990 | $191 | 46 |
| 6730 Paso Fino Dr Lot 10F | 0.48mi | 3/2.0 | 1,474 (+9%) | 20mo | $269,990 | $183 | 46 |
| 6708 Paso Fino Dr Lot 16F | 0.52mi | 3/2.0 | 1,474 (+9%) | 18mo | $279,490 | $190 | 46 |
| 6773 Paso Fino Dr Lot 23D | 0.50mi | 3/2.0 | 1,474 (+9%) | 20mo | $272,990 | $185 | 45 |
| 6072 Secretariat Way | 0.71mi | 4/2.0 (+1) | 1,433 (+6%) | 13mo | $295,000 | $206 | 41 |
| 5753 Blackhorse Cir | 0.58mi | 3/2.0 | 1,541 (+14%) | 19mo | $297,000 | $193 | 34 |
Match score weights: distance 35% · size 25% · config 20% · recency 20%. Top-matched comps best support the ARV.
Projected returns pro-forma
-3.0% appreciation · 4.42% rent growth · sell at horizon
- IRR
- -6.6%
- Equity multiple
- 0.75×
- Total profit
- $-15,965
- Equity at exit
- $34,294
- IRR
- 4.5%
- Equity multiple
- 1.35×
- Total profit
- $22,472
- Equity at exit
- $19,886
Cash invested: $64,400 (down + closing). Projections, not guarantees.
Landlord ↔ Tenant lean methodology
- Overall (STATE)
- 87 Strongly Landlord-Friendly
- State Florida
- 87 Strongly Landlord-Friendly · R+3
- County
- — inherits STATE
- City
- — inherits STATE
ZIP-level market 32526
- Home prices YoY
- -28.3%
- Rents YoY
- 4.4%
- Active inventory
- 417
- Price-to-rent
- 8.9×
Monthly cashflow live
- Estimated rent
- $2,151 high interval (Pro) →
- Mortgage (P&I)
- −$1,206
- Tax from tax record
- −$110 /mo · $1,325/yr
- Insurance
- −$96
- HOA
- −$0
- Vacancy / Maint / Mgmt
- −$452
- Net cashflow
- $287
Break-even live
Sensitivity live
| Price | -10% $417 | -5% $352 | +0% $287 | +5% $222 | +10% $157 |
|---|---|---|---|---|---|
| Rent | -10% $117 | -5% $202 | +0% $287 | +5% $372 | +10% $457 |
| Rate | -1.0pp $403 | -0.5pp $345 | base $287 | +0.5pp $227 | +1.0pp $167 |
UW: 25.0% down · 7.5% · 30yr · 1.5% tax · 5.0% vac · 8.0% maint · 8.0% mgmt
Financing live
Cash to close
- Down payment
- $57,500
- Closing costs
- $6,900
- Reserves months
- —
- Total cash needed
- —
Loan-product check · same deal, 3 products live
Conventional
25% down · 7.5% · 30yr
- Down + closing
- —
- Monthly P&I
- —
- Monthly cashflow
- —
- DSCR
- —
- Eligible?
- —
Personal DTI + credit; lowest rate.
DSCR
20% down · 8.5% · 30yr
- Down + closing
- —
- Monthly P&I
- —
- Monthly cashflow
- —
- DSCR
- —
- Eligible?
- —
No personal income docs; deal must DSCR.
Hard money
10% down · 12.0% · 12mo
- Down + closing
- —
- Monthly P&I
- —
- Monthly cashflow
- —
- DSCR
- —
- Eligible?
- —
Short-term bridge; refi at stabilization.
Rent comps 6 comps
| Address | Beds | Baths | Sqft | Rent | $/sqft | DOM | Units | Dist |
|---|---|---|---|---|---|---|---|---|
| 6081 Secretariat Way Pensacola, FL | 4.0 | 2.0 | 1783 | $2,125 | $1.19 | 24d | 1 | 0.69mi |
| 7748 Alydar Loop Pensacola, FL | 4.0 | 2.0 | 1787 | $1,950 | $1.09 | 24d | 1 | 0.77mi |
| 6161 Native Dancer Way Pensacola, FL | 4.0 | 2.0 | 1787 | $1,895 | $1.06 | 24d | 1 | 0.84mi |
| 7024 Tepin Ct Pensacola, FL | 4.0 | 2.0 | 1433 | $2,000 | $1.40 | 24d | 1 | 0.89mi |
| 6130 Native Dancer Way Pensacola, FL | 4.0 | 2.0 | 1787 | $2,025 | $1.13 | 24d | 1 | 0.92mi |
| 7805 Lakeside Oaks Dr Pensacola, FL | 4.0 | 2.0 | 1830 | $2,400 | $1.31 | 24d | 1 | 1.08mi |
Listing history 25 events
-
2026-06-18days on market $230,000 Active 50 DOM
-
2026-06-17days on market $230,000 Active 49 DOM
-
2026-06-16days on market $230,000 Active 48 DOM
-
2026-06-15days on market $230,000 Active 47 DOM
-
2026-06-14days on market $230,000 Active 45 DOM
-
2026-06-10days on market $230,000 Active 42 DOM
-
2026-06-09days on market $230,000 Active 41 DOM
-
2026-06-08days on market $230,000 Active 40 DOM
-
2026-06-07days on market $230,000 Active 39 DOM
-
2026-06-03days on market $230,000 Active 35 DOM
-
2026-06-02days on market $230,000 Active 34 DOM
-
2026-06-01days on market $230,000 Active 33 DOM
-
2026-05-31days on market $230,000 Active 32 DOM
-
2026-05-31days on market $230,000 Active 31 DOM
-
2026-04-29$230,000 Active 617-char remark
-
2026-02-01historical
-
2026-01-14price $220,000
-
2025-11-18$230,000 Active
-
2020-09-30soldstatus $175,000
Show marketing remark (889 chars)
You don't wait to wait on this one! This home is a three bedroom, two bathroom with over 1300 square feet! Just minutes away from Navy Federal and Beulah Elementary! Located in the Beulah community it has quick access to I-10 and convenient to all of Pensacola. The location is peaceful with woods both in front of and behind the home. This home features a new roof installed in 2018, engineered wood floors, and a updates throughout. The kitchen has been updated to feature stainless steel appliances, tile flooring, tiler backsplash, wainscoting, and a breakfast nook. All ceilings fans have been replaced. The AC/heater has also been replaced. Out back you'll notice great back porch for entertaining, a spacious fenced yard, and plenty of storage with a workshop and shed excellent for parking a vehicle or boat.. The home's color palette make it a perfect move-in ready home for you!
-
2020-02-21$179,900
Show marketing remark (889 chars)
You don't wait to wait on this one! This home is a three bedroom, two bathroom with over 1300 square feet! Just minutes away from Navy Federal and Beulah Elementary! Located in the Beulah community it has quick access to I-10 and convenient to all of Pensacola. The location is peaceful with woods both in front of and behind the home. This home features a new roof installed in 2018, engineered wood floors, and a updates throughout. The kitchen has been updated to feature stainless steel appliances, tile flooring, tiler backsplash, wainscoting, and a breakfast nook. All ceilings fans have been replaced. The AC/heater has also been replaced. Out back you'll notice great back porch for entertaining, a spacious fenced yard, and plenty of storage with a workshop and shed excellent for parking a vehicle or boat.. The home's color palette make it a perfect move-in ready home for you!
-
2007-02-21soldstatus $115,000
-
2007-02-16soldstatus $115,000
-
2006-12-08$120,000
-
2003-03-18soldstatus $54,900
-
2002-11-14$54,900
ⓘ Source: listings_history table (triggers on properties + properties_extension) + one-shot
backfill from property_details.listing_events for pre-trigger history.
Tax reassessment forecast FL · Resets to sale price
- Current annual tax
- $1,325 · $110/mo
- Projected year-2 tax
- $1,909 · $159/mo
- Expected delta
- +$584/yr (+$49/mo · 44.0%)
ⓘ Screening estimate from a state-policy table — verify with the county assessor before closing.
Climate risk First Street
- Flood 1/10 Low FEMA zone X (unshaded) · 0% chance over 30 yrs
- Wildfire 3/10 Moderate
- Heat 10/10 Extreme 6 d/yr ≥105°F today · 19 d/yr by 30 yrs out
- Wind 9/10 Extreme 99% chance of damaging wind over 30 yrs
- Air quality 1/10 Low 0 unhealthy d/yr today · 0 by 30 yrs out
Nearby sold comps map
Loading sold comps map…
Walkable amenities ~0.75 mi
Loading nearby amenities…
Taxation est. · year 1
- Rental income
- $25,811
- − Mortgage interest
- −$12,884
- − Property taxes
- −$1,325
- − Insurance
- −$1,150
- − Repairs & maintenance
- −$2,065
- − Management
- −$2,065
- − Depreciation
- −$6,691
- Taxable loss
- −$369
- Est. tax savings @ 24.0%
- +$89
- After-tax cash flow
- $3,530/yr
For passive investors: Depreciation is non-cash, so a rental often shows a tax loss while cash-flowing — sheltering income. Rental losses are passive: they offset passive income freely, and up to $25,000/yr can offset ordinary (W-2) income if you actively participate and your MAGI is under $100k (phasing out to $0 by $150k); unused losses carry forward. On sale, claimed depreciation is recaptured at up to 25%, and gains may owe capital-gains tax (a 1031 exchange can defer both). Figures are a year-1 estimate at your 24.0% rate — not tax advice; consult a CPA.
Schools (NCES district)
- District
- Escambia
- NCES district ID
- 1200510
- Math proficiency
- 40% ▼ -9.00%
- Reading proficiency
- 45% ▼ -4.00%
- Median HH income
- $44,649
- Composite
- 36.04/100
- National rank
- #4773
- State rank
- #56 of 73 in FL
Livability — Bellview
- Score
- 67/100
- State rank
- #561
- US rank
- #10731
Category grades
Schools grade is shown separately in the Schools card above.
Census & demographics
- County
- Escambia County · 301,722 people
- Metro
- Pensacola-Ferry Pass-Brent, FL
- Population (ZIP)
- 44,680
- Household income
- $75,098
- Rent vs Own
- Severe rent burden
- 1166.0
Population outlook (Escambia County) Hauer SSP2
- Today (2025)
- 334,637 people
- By 2030
- 345,779 · +3.3%
- By 2040
- 364,828 · +9.0%
- By 2050
- 378,514 · +13.1%
- By 2075
- 403,220 · +20.5%
- By 2100
- 386,125 · +15.4%
Race, ethnicity, and origin ACS 2023
- Neighborhood character
- Predominantly White (66%)
- Race & ethnicity
- White 66% Black 19% Two or more races 8% Hispanic / Latino 5% Asian 3%
- Common ancestry
- Lithuanian 2% Slovak 2% Serbian 2%
- Foreign-born
- 5% · Canada, China
- Languages at home
- 94% English-only · Spanish 2% Tagalog/Filipino 1% Other Indo-European 1%
Political lean MEDSL · Escambia
- 2024 margin
- R (+19.5) · D 39.7% · R 59.2% · Other 1.1%
- 2008→2024 swing
- -0.2pp no change · 2008: -19.3pp · 2024: -19.5pp
- All cycles
- 2024: R+19.5 2020: R+15.1 2016: R+20.6 2012: R+20.6 2008: R+19.3
Not yet ingested
- Civics
- —
Market trends
- HPI YoY
- ▼ -99.68%
- Current HPI
- 252.6406
- Rent YoY
- ▲ 4.42%
- Metro
- Pensacola-Ferry Pass-Brent, FL
- State GDP YoY
- ▲ 3.28%
- F500 in state
- 36
Industry mix (Fortune 500 HQ in FL)
| Industry | F500 HQs | Revenue |
|---|---|---|
| Industrial Technology | 2 | $29B |
|
||
| Insurance | 2 | $17B |
|
||
| Retail | 1 | $60B |
|
||
| Technology Distribution | 1 | $58B |
|
||
| Homebuilding | 1 | $35B |
|
||
| Technology Manufacturing | 1 | $35B |
|
||
Price history
+318.9% since first listed11 events — show timeline
- 2026-04-29 Listed $230,000 PARMLS
- 2026-02-01 Listing Removed — PARMLS
- 2026-01-14 Price Changed $220,000 PARMLS
- 2025-11-18 Listed $230,000 PARMLS
- 2020-09-30 Sold (MLS) $175,000 PARMLS
- 2020-02-21 Listed $179,900 PARMLS
- 2007-02-21 Sold (Public Records) $115,000 Public Records
- 2007-02-16 Sold (MLS) $115,000 PARMLS
- 2006-12-08 Listed $120,000 PARMLS
- 2003-03-18 Sold (MLS) $54,900 PARMLS
- 2002-11-14 Listed $54,900 PARMLS
Property tax history
+10.2%/yrLatest (2025): $1,325 · +16.4% YoY. Source: county tax records.
Cash-flow waterfall
monthlySold comps — $/sqft
last 12 mo · ≤1 miLoading sold comps…