 Duplex
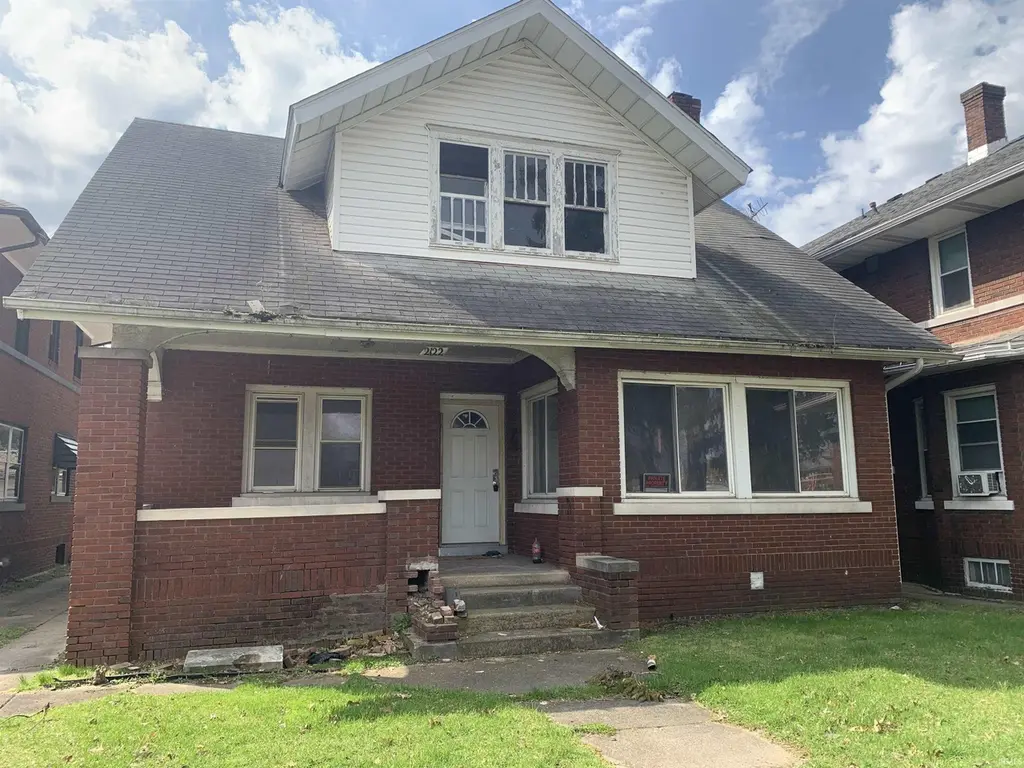
2122 Lincoln Way Way W · South Bend, IN
Flood risk 1/10 · Minimal
- FEMA flood zone
- X (unshaded)
- Chance of flooding over 30 yrs
- 0.0%
- Est. flood insurance / yr
- $473 – $860
Fire risk 1/10 · Minimal
- Est. fire insurance / yr
- $717 – $1,331
Heat risk 2/10 · Minimal
- Hot days now (above 99°F)
- 7 days/yr
- Hot days in 30 yrs
- 15 days/yr
Wind risk 2/10 · Minimal
- Chance of severe wind over 30 yrs
- —
Air-quality risk 3/10 · Minor
- Unhealthy air days now
- 3 days/yr
- Unhealthy air days in 30 yrs
- 3 days/yr
Risk factors via First Street. Map © Google.
Why this score? — see what drove the B grade
The composite is a weighted blend of 9 inputs, each scored 0–100. Each bar is that input's sub-score; the figure is the points it added to the 100-point composite (weight × sub-score).
- Cash flow +30.0/30.0
- ARV discount +13.4/15.0
- 1% rule +10.0/10.0
- DSCR +10.0/10.0
- Rent growth +4.2/5.0
- Livability +3.2/5.0
- Condition / age +2.5/5.0
- Schools +1.4/10.0
- Appreciation +0.0/10.0
$79,000
🖨 Deal sheet 📄 Offer letter ✓ Due diligence
Multi-family units
County records classify this as Multi-Family (2-4 Unit). Listing-text estimate: 2 units. confirmed
Listing remarks
* Seller willing to sell on land contract * Check out this duplex that is ready for a complete transformation! This property has been taken down to the studs, offering a clean slate for your next project. Perfect for investors, flippers, or anyone looking to customize a multi-unit property from the ground up. Endless possibilities to design, build, and add value. Located near local amenities and positioned for strong future returns.
Key facts
- 5,227 sq ft lot
- 2 parking spots
- Built 1927
Property features AI
Finance
- Other: Pets allowed
- Financial info: Annual tax listed (see broker)
Exterior
- Parking: Two open parking spaces
- Utilities: Public water; Public sewer
- Home design: Residential income duplex; Two-story
- Construction: Brick construction
- Exterior features: Level lot; Lot dimensions approximately 41 x 132
Interior
- Bathrooms: Two full bathrooms; Three main-level bathrooms
- Heating & cooling: No central heating listed
- Interior features: Full, unfinished basement
Neighborhood map
What this means for you Summary
Snapshot
- This is a 2 × 3-bed/2.0-bath units multifamily listed at $79k.
Deal economics
- At list price, monthly cash flow is $1k ($16k/yr) — positive. Per door: $672/mo.
- The deal already cash-flows at list — no discount required.
- Meets the 1% rule at list price ($2k rent vs $79k).
- Recommended offer: $77k (3.0% below list) — sets the bar for market timing.
- Cap rate 26.7% vs local median 4.4% in South Bend — top-decile yield for the area; either an underpriced asset or a hidden risk that comps aren't pricing in. Stress-test before assuming the spread holds.
Location & tenants
- Location reads 64/100 on livability (#365 in IN) — a middle-class / working-renter tenant base. Strengths: cost of living A+, housing A+, health & safety A+; Watch: amenities D, employment D, crime F.
- South Bend Community School Corporation (urban): math 12% / reading 21% proficiency, ranked #284 of 301 in IN (top 94%) — low school quality limits family demand, transient renter base, plan for 1-2y turnover; 66% free/reduced lunch — lower-income household profile, screen leases tightly.
- Zoned schools: Coquillard Elementary School (math 2% / reading 2%, grade F, #989 of 994 statewide, top 100%, 343 students, 89% FRL); Dickinson Fine Arts Academy (math 0% / reading 5%, grade F, #329 of 330 statewide, top 100%, 449 students, 86% FRL); Washington High School (math 12% / reading 42%, grade F, #315 of 369 statewide, top 86%, 834 students, 79% FRL) — zoned schools average 85% FRL vs 66% district-wide (18 pts higher); higher-poverty schools than district average — tighter screening recommended.
- Market conditions: Rents rising fast (+6.8%/yr); 424 active listings in the ZIP; 14 comparable units currently listed for rent nearby; rentals at typical pace (median 21d on market — plan ~3-4 weeks tenant-placement turnaround); 754 units permitted in St. Joseph County in 2024 (460 in 5+ unit buildings).
- At $2,487/mo this rent would consume 48% of the median local household income ($62k/yr) (locally 1024% of renters already pay >50% of income on rent) — very limited rent-growth headroom before tenants either downsize or default.
Forward outlook
- Local home prices are declining (-3.0%/yr); year-one equity from $546 of loan paydown is wiped out by about $2k of value loss. Plan a longer hold.
- At projected returns (-3.0% appreciation + 6.8% rent growth), your $22k cash investment doubles in ~2 years — after that, you're playing with house money.
Negotiation context
- It's been on market 43 days — a 3% lower offer ($77k) is reasonable based on typical stale-listing flexibility.
Risks & watch-outs
- Watch-outs: property tax is 2.6% of price; built in 1927 — expect roof / HVAC / electrical / plumbing capex.
Questions for the listing agent
- It's been on market 43 days. Have you received any prior offers? Is the seller open to a 3% concession, seller financing, or rate buy-down credit?
- Can we see the unit-by-unit rent roll, current vacancy, and any below-market leases? What's the average tenancy length?
- What capital expenditures (roof, boiler, parking lot, exteriors) have been made in the last 5 years, and what's planned in the next 2?
- Built in 1927 — when were the roof, HVAC, electrical panel, plumbing, and water heater last replaced?
- Property tax is high relative to price — has the assessment been appealed recently, and will the sale trigger a re-assessment?
- Is there a deadline driving the sale (1031 exchange, divorce, estate, relocation)? That informs how much negotiation room exists.
- Schools are F-rated, which usually means shorter tenancies and higher turnover. Who's the typical renter profile here, and what's been the actual vacancy rate?
- Crime grade is F in this area — have there been break-ins, vandalism, or insurance claims at this property in the last 3 years? What carrier currently insures it and at what premium?
- What's the average days-on-market for RENTAL listings here right now (not sales)? A rising rental-DOM trend means longer vacancies and softer asking-rent achievability than the comps imply.
- What's the recent tenant-quality profile in this submarket — average credit score on applications, eviction rate, late-payment / NSF rate, and stable-employment percentage? A property-management company in the area should have these aggregated.
- How much new apartment / multifamily construction is in the pipeline within 1–3 miles? Heavy new supply (>2% of stock underway) typically softens rents 12–24 months out; light construction supports rent growth.
Investment metrics
- 1% rule
- 3.15% ✓
- Cap rate
- 26.71%
- Cash-on-cash
- 72.92%
- DSCR
- 4.24
- GRM
- 2.6
CMA / ARV
- ARV (median comp)
- $90,883
- List price
- $79,000
- Delta
- -13.08%
- Verdict
- UNDERPRICED
- Comps
- 6 within 1.0 mi
Projected returns pro-forma
-3.0% appreciation · 6.78% rent growth · sell at horizon
- IRR
- 77.1%
- Equity multiple
- 4.74×
- Total profit
- $82,706
- Equity at exit
- $11,779
- IRR
- 81.8%
- Equity multiple
- 11.22×
- Total profit
- $226,142
- Equity at exit
- $6,830
Cash invested: $22,120 (down + closing). Projections, not guarantees.
Landlord ↔ Tenant lean methodology
- Overall (STATE)
- 90 Strongly Landlord-Friendly
- State Indiana
- 90 Strongly Landlord-Friendly · R+11
- County
- — inherits STATE
- City
- — inherits STATE
ZIP-level market 46628
- Rents YoY
- 6.8%
- Active inventory
- 424
- Price-to-rent
- 5.3×
Monthly cashflow live
- Estimated rent
- $2,487 high interval (Pro) →
- Mortgage (P&I)
- −$414
- Tax from tax record
- −$173 /mo · $2,081/yr
- Insurance
- −$33
- HOA
- −$0
- Vacancy / Maint / Mgmt
- −$522
- Net cashflow
- $1,344
Break-even live
2-unit breakdown (identical units grouped — click to expand)
| Units | Beds | Baths | Est. rent |
|---|---|---|---|
| 2× units | 3 | 2 | $2,486 |
| #1 | 3 | 2 | $1,243 |
| #2 | 3 | 2 | $1,243 |
| Total (2 units) | $2,487 | ||
UW: 25.0% down · 7.5% · 30yr · 1.5% tax · 5.0% vac · 8.0% maint · 8.0% mgmt
Financing live
Cash to close
- Down payment
- $19,750
- Closing costs
- $2,370
- Reserves months
- —
- Total cash needed
- —
Loan-product check · same deal, 3 products live
Conventional
25% down · 7.5% · 30yr
- Down + closing
- —
- Monthly P&I
- —
- Monthly cashflow
- —
- DSCR
- —
- Eligible?
- —
Personal DTI + credit; lowest rate.
DSCR
20% down · 8.5% · 30yr
- Down + closing
- —
- Monthly P&I
- —
- Monthly cashflow
- —
- DSCR
- —
- Eligible?
- —
No personal income docs; deal must DSCR.
Hard money
10% down · 12.0% · 12mo
- Down + closing
- —
- Monthly P&I
- —
- Monthly cashflow
- —
- DSCR
- —
- Eligible?
- —
Short-term bridge; refi at stabilization.
Rent comps 14 comps
| Address | Beds | Baths | Sqft | Rent | $/sqft | DOM | Units | Dist |
|---|---|---|---|---|---|---|---|---|
| 2205 Lincoln Way W South Bend, IN | 4.0 | 2.0 | 1440 | $1,565 | $1.09 | 13d | 1 | 0.07mi |
| 1008 O Brien St Unit O South Bend, IN | 3.0 | 1.0 | 1634 | $800 | $0.49 | 20d | 1 | 0.08mi |
| 1054 Huey St South Bend, IN | 4.0 | 2.0 | 1288 | $1,550 | $1.20 | 13d | 1 | 0.15mi |
| 1206 Johnson St South Bend, IN | 3.0 | 1.5 | 1320 | $1,400 | $1.06 | 43d | 1 | 0.30mi |
| 1210 Johnson St South Bend, IN | 3.0 | 2.0 | 1568 | $1,250 | $0.80 | 20d | 1 | 0.31mi |
| 2203 Smith St South Bend, IN | 3.0 | 1.0 | 1248 | $1,215 | $0.97 | 13d | 1 | 0.48mi |
| 752 Diamond Ave South Bend, IN | 3.0 | 1.5 | 1248 | $1,400 | $1.12 | 43d | 1 | 0.59mi |
| 1642 Johnson St South Bend, IN | 3.0 | 1.0 | 1375 | $1,400 | $1.02 | 13d | 1 | 0.69mi |
| 1118 Van Buren St South Bend, IN | 3.0 | 1.0 | 1394 | $1,375 | $0.99 | 20d | 1 | 0.73mi |
| 1032 Allen St South Bend, IN | 3.0 | 2.0 | 1580 | $1,200 | $0.76 | 43d | 1 | 0.79mi |
| 1243 Portage Ave South Bend, IN | 3.0 | 1.0 | 1570 | $1,500 | $0.96 | 43d | 1 | 0.79mi |
| 504 W Navarre St South Bend, IN | 3.0 | 1.5 | 1520 | $1,350 | $0.89 | 13d | 1 | 1.27mi |
| 2217 Inglewood Pl South Bend, IN | 3.0 | 1.0 | 1800 | $2,200 | $1.22 | 43d | 1 | 1.45mi |
| 721 S Arnold St South Bend, IN | 4.0 | 2.0 | 2568 | $1,800 | $0.70 | 13d | 1 | 1.50mi |
Listing history 16 events
-
2026-06-18days on market $79,000 Active 43 DOM
-
2026-06-17days on market $79,000 Active 42 DOM
-
2026-06-16days on market $79,000 Active 41 DOM
-
2026-06-15days on market $79,000 Active 40 DOM
-
2026-06-14days on market $79,000 Active 38 DOM
-
2026-06-13days on market $79,000 Active 37 DOM
-
2026-06-10days on market $79,000 Active 35 DOM
-
2026-06-09days on market $79,000 Active 34 DOM
-
2026-06-08days on market $79,000 Active 33 DOM
-
2026-06-07days on market $79,000 Active 32 DOM
-
2026-06-03days on market $79,000 Active 28 DOM
-
2026-06-02days on market $79,000 Active 27 DOM
-
2026-06-01days on market $79,000 Active 26 DOM
-
2026-05-31days on market $79,000 Active 25 DOM
-
2026-05-30days on market $79,000 Active 24 DOM
-
2026-05-06$79,000 Active 424-char remark
ⓘ Source: listings_history table (triggers on properties + properties_extension) + one-shot
backfill from property_details.listing_events for pre-trigger history.
Tax reassessment forecast IN · Partial reset (capped growth)
- Current annual tax
- $2,081 · $173/mo
- Projected year-2 tax
- $2,081 · $173/mo
- Expected delta
- $0/yr ($0/mo · 0.0%)
ⓘ Screening estimate from a state-policy table — verify with the county assessor before closing.
Climate risk First Street
- Flood 1/10 Low FEMA zone X (unshaded) · 0% chance over 30 yrs
- Wildfire 1/10 Low
- Heat 2/10 Low 7 d/yr ≥99°F today · 15 d/yr by 30 yrs out
- Wind 2/10 Low
- Air quality 3/10 Moderate 3 unhealthy d/yr today · 3 by 30 yrs out
Nearby sold comps map
Loading sold comps map…
Walkable amenities ~0.75 mi
Loading nearby amenities…
Taxation est. · year 1
- Rental income
- $29,844
- − Mortgage interest
- −$4,425
- − Property taxes
- −$2,081
- − Insurance
- −$395
- − Repairs & maintenance
- −$2,388
- − Management
- −$2,388
- − Depreciation
- −$2,298
- Taxable income
- $15,869
- Est. tax owed @ 24.0%
- −$3,809
- After-tax cash flow
- $12,321/yr
For passive investors: Depreciation is non-cash, so a rental often shows a tax loss while cash-flowing — sheltering income. Rental losses are passive: they offset passive income freely, and up to $25,000/yr can offset ordinary (W-2) income if you actively participate and your MAGI is under $100k (phasing out to $0 by $150k); unused losses carry forward. On sale, claimed depreciation is recaptured at up to 25%, and gains may owe capital-gains tax (a 1031 exchange can defer both). Figures are a year-1 estimate at your 24.0% rate — not tax advice; consult a CPA.
Schools (NCES district)
- District
- South Bend Community School Corporation
- NCES district ID
- 1810290
- Math proficiency
- 12% ▼ -10.00%
- Reading proficiency
- 21% ▼ -6.00%
- Median HH income
- $41,935
- Composite
- 14.21/100
- National rank
- #9452
- State rank
- #284 of 301 in IN
Livability — South Bend
- Score
- 64/100
- State rank
- #365
- US rank
- #13730
Category grades
Schools grade is shown separately in the Schools card above.
Census & demographics
- Census place
- South Bend, IN
- County
- Saint Joseph County · 189,048 people
- City population
- 99,767
- Metro
- South Bend-Mishawaka, IN-MI
- Population (ZIP)
- 27,685
- Household income
- $61,759
- Rent vs Own
- Severe rent burden
- 1024.0
Population outlook (St. Joseph County) Hauer SSP2
- Today (2025)
- 273,186 people
- By 2030
- 273,594 · +0.1%
- By 2040
- 271,641 · -0.6%
- By 2050
- 269,187 · -1.5%
- By 2075
- 263,136 · -3.7%
- By 2100
- 245,659 · -10.1%
Race, ethnicity, and origin ACS 2023
- Neighborhood character
- Diverse neighborhood (Simpson 0.60)
- Race & ethnicity
- White 55% Black 30% Hispanic / Latino 10% Two or more races 8%
- Hispanic origin (detail)
- Mexican 8%
- Common ancestry
- Romanian 12% Lithuanian 1% Slovak 1%
- Foreign-born
- 7% · Canada, China
- Languages at home
- 89% English-only · Spanish 7% Russian/Polish/Slavic 1%
Political lean MEDSL · St. Joseph
- 2024 margin
- Toss-up / Even · D 50.0% · R 48.5% · Other 1.5%
- 2008→2024 swing
- -15.6pp toward R · 2008: 17.1pp · 2024: 1.5pp
- All cycles
- 2024: D+1.5 2020: D+5.8 2016: D+0.2 2012: D+3.5 2008: D+17.1
Not yet ingested
- Civics
- —
Market trends
- HPI YoY
- ▼ -130.47%
- Current HPI
- 202.112
- Rent YoY
- ▲ 6.78%
- Metro
- South Bend-Mishawaka, IN-MI
- State GDP YoY
- ▲ 2.90%
- F500 in state
- 18
Industry mix (Fortune 500 HQ in IN)
| Industry | F500 HQs | Revenue |
|---|---|---|
| Industrial Machinery | 2 | $37B |
|
||
| Healthcare | 1 | $177B |
|
||
| Pharmaceuticals | 1 | $45B |
|
||
| Metals / Steel | 1 | $18B |
|
||
| Agriculture | 1 | $17B |
|
||
| Packaging | 1 | $12B |
|
||
Price history
1 event — show timeline
- 2026-05-06 Listed $79,000 IRMLS
Property tax history
+0.3%/yrLatest (2025): $2,081 · -2.1% YoY. Source: county tax records.
Cash-flow waterfall
monthlySold comps — $/sqft
last 12 mo · ≤1 miLoading sold comps…