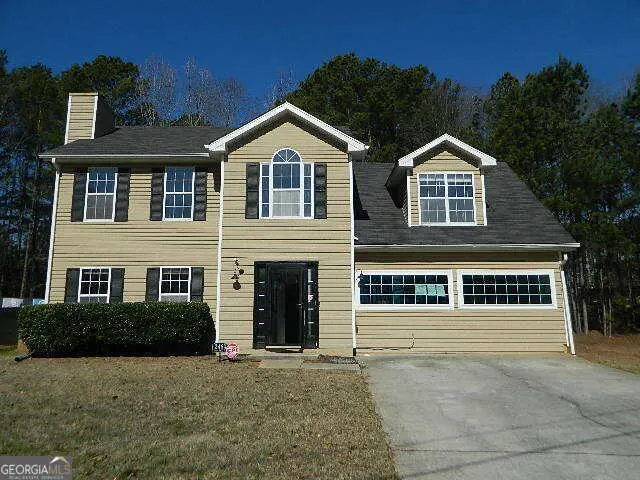
2469 Briar Knoll Rd · Stonecrest, GA
Flood risk 1/10 · Minimal
- FEMA flood zone
- X (unshaded)
- Chance of flooding over 30 yrs
- 0.0%
- Est. flood insurance / yr
- $507 – $1,088
Fire risk 1/10 · Minimal
- Est. fire insurance / yr
- $963 – $1,789
Heat risk 6/10 · Moderate
- Hot days now (above 105°F)
- 7 days/yr
- Hot days in 30 yrs
- 18 days/yr
Wind risk 5/10 · Moderate
- Chance of severe wind over 30 yrs
- 26.0%
Air-quality risk 5/10 · Moderate
- Unhealthy air days now
- 7 days/yr
- Unhealthy air days in 30 yrs
- 10 days/yr
Risk factors via First Street. Map © Google.
Why this score? — see what drove the D+ grade
The composite is a weighted blend of 9 inputs, each scored 0–100. Each bar is that input's sub-score; the figure is the points it added to the 100-point composite (weight × sub-score).
- Cash flow +16.6/30.0
- ARV discount +9.0/15.0
- DSCR +5.1/10.0
- 1% rule +4.4/10.0
- Rent growth +2.8/5.0
- Livability +2.5/5.0
- Condition / age +2.5/5.0
- Schools +2.1/10.0
- Appreciation +0.0/10.0
$230,000
🖨 Deal sheet (PDF) 📄 Offer letter ✓ Due diligence
Listing remarks
Welcome to this lovely 4-bedroom, 2.5-bathroom home nestled in the quiet community of Covington Place subdivision. Open foyer with high-ceiling fireplace in family room and a bedroom on the main. Great entertaining kitchen area open to a huge Great Room for Family and Friends gatherings. A level back yard for addition space to host outdoors barbeques. Upstairs is your Primary Suite with a sperate tub and shower. Two additional bedrooms are upstairs along with another bathroom. THIS IS THE ONE - STOP THE CAR $100.00 DOWN PAYMENT - YES $100 DOWN PAYMENT!!!!!!!!! Visit www. hudhomestore. gov and inter HUD Case #106-432752 for more information.
Key facts
- 0.37 acre lot
- Built 1996
- Listed 43 days
Property features AI
Finance
- HOA & community: No homeowners association; No association fees
Exterior
- Parking: Open parking; Parking pad
- Utilities: Public water; Public sewer; Electricity available; Natural gas available
- Home design: Single-family residence; House; Resale property; Built in 1996
- Construction: Vinyl siding; Composition roof; 1 fireplace
- Exterior features: Level lot
Interior
- Kitchen: Dishwasher; Oven; Refrigerator; Stainless steel appliances; Gas water heater
- Bedrooms: 4 bedrooms total; 1 bedroom on the main level
- Flooring: Vinyl
- Bathrooms: 2 full bathrooms; 1 half bathroom; 3 total bathrooms
- Heating & cooling: Central heating; Central air conditioning; Has heating and cooling
- Interior features: High ceilings; Separate shower; Two levels; Family room, foyer, great room
- Laundry & utility: Laundry closet
Neighborhood map
What this means for you Summary
Snapshot
- This is a 4-bed/2.5-bath single-family listed at $230k.
Deal economics
- At list price, monthly cash flow is $139 ($2k/yr) — positive.
- The deal already cash-flows at list — no discount required.
- To meet the 1% rule (rent ≥ 1% of price), the offer needs to be $217k (5.7% below list).
- Recommended offer: $217k (5.7% below list) — sets the bar for 1% rule.
- Cap rate 7.0% vs local median 5.1% in Stonecrest — top-decile yield for the area; either an underpriced asset or a hidden risk that comps aren't pricing in. Stress-test before assuming the spread holds.
Location & tenants
- Location reads: area grade D — affects rentability + tenant quality, not the cash-flow math above.
- Dekalb County (suburban): math 19% / reading 28% proficiency, ranked #125 of 174 in GA (top 72%) — low school quality limits family demand, transient renter base, plan for 1-2y turnover; 68% free/reduced lunch — lower-income household profile, screen leases tightly.
- Zoned schools: Panola Way Elementary School (math 8% / reading 12%, grade F, #1,092 of 1,228 statewide, top 91%, 653 students, 100% FRL); Miller Grove Middle School (math 8% / reading 18%, grade F, #410 of 470 statewide, top 87%, 722 students, 100% FRL); Miller Grove High School (math 5% / reading 5%, grade F, #394 of 424 statewide, top 97%, 1,188 students, 100% FRL) — zoned schools average 100% FRL vs 68% district-wide (32 pts higher); higher-poverty schools than district average — tighter screening recommended.
- Zoned-school proficiency averages 9% at this address vs 24% district-wide (-14 pts) — the specific schools serving this property underperform the Dekalb County average; the district grade overstates school quality for this exact location.
- Market conditions: Rents rising (+1.2%/yr); 444 active listings in the ZIP; 40 comparable units currently listed for rent nearby; rentals at typical pace (median 24d on market — plan ~3-4 weeks tenant-placement turnaround); 1,240 units permitted in DeKalb County in 2024 (385 in 5+ unit buildings).
- This rent runs 42% of the median local income ($62k/yr) — at the standard rent-burdened threshold; future hikes will face affordability resistance.
Forward outlook
- Local home prices are declining (-3.0%/yr); year-one equity from $2k of loan paydown is wiped out by about $7k of value loss. Plan a longer hold.
- DeKalb County population projected at +28% by 2050 — long-run rental-demand tailwind backs the buy-and-hold thesis.
Negotiation context
- It's been on market 43 days — a 3% lower offer ($223k) is reasonable based on typical stale-listing flexibility.
- 7 sale attempts since 4y ago with the ask held roughly flat each time — persistent listings suggest the price (not the market) is what's stuck; bring a comps-based counter.
Risks & watch-outs
- Climate carrying-cost: moderate wind risk, 26% chance of damaging wind over 30y; extreme-heat days projected 7→18/yr by 2055 (HVAC capex compounding) — expect insurance premiums to compound above CPI over the hold.
Questions for the listing agent
- It's been on market 43 days. Have you received any prior offers? Is the seller open to a 6% concession, seller financing, or rate buy-down credit?
- Is there a deadline driving the sale (1031 exchange, divorce, estate, relocation)? That informs how much negotiation room exists.
- The area grade is low — what's the realistic commute time and amenity access for the typical tenant pool here? Any planned neighborhood developments (good or bad) we should know about?
- What's the average days-on-market for RENTAL listings here right now (not sales)? A rising rental-DOM trend means longer vacancies and softer asking-rent achievability than the comps imply.
- What's the recent tenant-quality profile in this submarket — average credit score on applications, eviction rate, late-payment / NSF rate, and stable-employment percentage? A property-management company in the area should have these aggregated.
- How much new for-sale + rental construction is in the pipeline within 1–3 miles? Heavy new supply typically softens prices + rents 12–24 months out; constrained supply supports both.
Investment metrics
- 1% rule
- 0.94% ✗
- Cap rate
- 7.02%
- Cash-on-cash
- 2.58%
- DSCR
- 1.11
- GRM
- 8.8
CMA / ARV
- ARV (on-the-fly)
- $238,007
- Comps found
- 12
Show comp detail 12 sales within ~0.75 mi
| Address | Dist | Beds/Ba | Sqft | Sold | Price | $/sf | Match |
|---|---|---|---|---|---|---|---|
| 5455 Wood Duck Ln | 0.16mi | 3/3.0 (-1) | 1,956 (-1%) | 5mo | $237,000 | $121 | 81 |
| 2275 Briar Knoll Rd | 0.34mi | 3/2.5 (-1) | 2,036 (+4%) | 2mo | $230,000 | $113 | 72 |
| 2357 Wellborn Hills Pl | 0.30mi | 3/2.5 (-1) | 2,036 (+4%) | 6mo | $256,900 | $126 | 70 |
| 5477 Forest Pines Dr | 0.40mi | 3/2.0 (-1) | 1,887 (-4%) | 2mo | $135,000 | $72 | 66 |
| 5571 Panola Pl | 0.34mi | 3/2.5 (-1) | 2,151 (+9%) | 2mo | $330,000 | $153 | 62 |
| 5350 Olde St | 0.51mi | 3/2.0 (-1) | 1,788 (-9%) | 0mo | $169,900 | $95 | 54 |
| 5786 Singer Ct | 0.72mi | 4/3.0 | 2,044 (+4%) | 5mo | $194,000 | $95 | 54 |
| 2106 Singer Way | 0.65mi | 4/4.0 | 2,051 (+4%) | 7mo | $259,900 | $127 | 50 |
| 2397 Cove Lake Rd | 0.72mi | 3/2.0 (-1) | 1,996 (+2%) | 10mo | $240,000 | $120 | 49 |
| 1931 Patton Pl | 0.60mi | 4/3.0 | 1,761 (-10%) | 6mo | $280,000 | $159 | 47 |
| 1983 Northerly Way | 0.75mi | 4/2.0 | 1,776 (-10%) | 3mo | $228,660 | $129 | 45 |
| 2172 Cold Springs Cir | 0.67mi | 4/3.0 | 2,166 (+10%) | 7mo | $231,000 | $107 | 44 |
Match score weights: distance 35% · size 25% · config 20% · recency 20%. Top-matched comps best support the ARV.
Projected returns pro-forma
-3.0% appreciation · 1.18% rent growth · sell at horizon
- IRR
- -14.3%
- Equity multiple
- 0.50×
- Total profit
- $-32,319
- Equity at exit
- $34,294
- IRR
- -8.7%
- Equity multiple
- 0.50×
- Total profit
- $-32,109
- Equity at exit
- $19,886
Cash invested: $64,400 (down + closing). Projections, not guarantees.
Landlord ↔ Tenant lean methodology
- Overall (STATE)
- 90 Strongly Landlord-Friendly
- State Georgia
- 90 Strongly Landlord-Friendly · R+3
- County
- — inherits STATE
- City
- — inherits STATE
ZIP-level market 30058
- Home prices YoY
- -21.4%
- Rents YoY
- 1.2%
- Active inventory
- 444
- Price-to-rent
- 8.8×
Monthly cashflow live
- Estimated rent
- $2,168 high interval (Pro) →
- Mortgage (P&I)
- −$1,206
- Tax from tax record
- −$272 /mo · $3,266/yr
- Insurance
- −$96
- HOA
- −$0
- Vacancy / Maint / Mgmt
- −$455
- Net cashflow
- $139
Break-even live
Sensitivity live
| Price | -10% $269 | -5% $204 | +0% $139 | +5% $73 | +10% $8 |
|---|---|---|---|---|---|
| Rent | -10% $-33 | -5% $53 | +0% $139 | +5% $224 | +10% $310 |
| Rate | -1.0pp $254 | -0.5pp $197 | base $139 | +0.5pp $79 | +1.0pp $18 |
UW: 25.0% down · 7.5% · 30yr · 1.5% tax · 5.0% vac · 8.0% maint · 8.0% mgmt
Financing live
Cash to close
- Down payment
- $57,500
- Closing costs
- $6,900
- Reserves months
- —
- Total cash needed
- —
Loan-product check · same deal, 3 products live
Conventional
25% down · 7.5% · 30yr
- Down + closing
- —
- Monthly P&I
- —
- Monthly cashflow
- —
- DSCR
- —
- Eligible?
- —
Personal DTI + credit; lowest rate.
DSCR
20% down · 8.5% · 30yr
- Down + closing
- —
- Monthly P&I
- —
- Monthly cashflow
- —
- DSCR
- —
- Eligible?
- —
No personal income docs; deal must DSCR.
Hard money
10% down · 12.0% · 12mo
- Down + closing
- —
- Monthly P&I
- —
- Monthly cashflow
- —
- DSCR
- —
- Eligible?
- —
Short-term bridge; refi at stabilization.
Rent comps 40 comps
| Address | Beds | Baths | Sqft | Rent | $/sqft | DOM | Units | Dist |
|---|---|---|---|---|---|---|---|---|
| 5622 Glen Ridge Bnd Lithonia, GA | 3.0 | 2.5 | 1967 | $2,110 | $1.07 | 26d | 1 | 0.11mi |
| 2188 Justify LN #40 Lithonia, GA | 3.0 | 2.5 | 2085 | $2,400 | $1.15 | 45d | 1 | 0.11mi |
| 2233 Glen Briar Way Lithonia, GA | 3.0 | 2.5 | 2036 | $2,500 | $1.23 | 13d | 1 | 0.19mi |
| 5452 Perching Pl Lithonia, GA | 3.0 | 2.5 | 2036 | $1,900 | $0.93 | 26d | 1 | 0.25mi |
| 5536 Downs Way Lithonia, GA | 3.0 | 2.0 | 1400 | $1,600 | $1.14 | 45d | 1 | 0.27mi |
| 5625 Strathmoor Manor Cir Lithonia, GA | 3.0 | 2.5 | 1336 | $1,550 | $1.16 | 5d | 1 | 0.28mi |
| 5625 Strathmoor Manor Cir Lithonia, GA | 3.0 | 2.5 | 1336 | $1,550 | $1.16 | 1d | 1 | 0.28mi |
| 2287 Rolling Trl Lithonia, GA | 3.0 | 2.5 | 1596 | $2,150 | $1.35 | 1d | 1 | 0.31mi |
| 5477 Wellborn Creek Dr Lithonia, GA | 3.0 | 3.0 | 2084 | $2,400 | $1.15 | 5d | 1 | 0.32mi |
| 5550 Wellborn Creek Dr Lithonia, GA | 3.0 | 2.5 | 1850 | $2,085 | $1.13 | 3d | 1 | 0.34mi |
| 2005 Marbut Forest Dr Lithonia, GA | 3.0 | 2.0 | 1556 | $1,900 | $1.22 | 7d | 1 | 0.38mi |
| 5863 Strathmoor Manor Cir Lithonia, GA | 3.0 | 2.5 | 1347 | $1,650 | $1.22 | 5d | 1 | 0.39mi |
| 5823 Strathmoor Manor Cir Lithonia, GA | 3.0 | 2.5 | 1348 | $1,925 | $1.43 | 26d | 1 | 0.42mi |
| 2248 Mulsanne Dr Lithonia, GA | 3.0 | 2.5 | 1750 | $2,250 | $1.29 | 45d | 1 | 0.42mi |
| 2244 Mulsanne Dr Lithonia, GA | 3.0 | 2.5 | 1750 | $2,250 | $1.29 | 7d | 1 | 0.42mi |
| 5876 Strathmoor Manor Cir Unit 1 Lithonia, GA | 3.0 | 2.5 | 1400 | $1,295 | $0.93 | 26d | 1 | 0.43mi |
| 5798 Strathmoor Manor Cir Lithonia, GA | 3.0 | 2.5 | 1347 | $1,575 | $1.17 | 45d | 1 | 0.43mi |
| 2286 Strathmoor Manor Dr Lithonia, GA | 3.0 | 2.5 | 1348 | $1,675 | $1.24 | 3d | 1 | 0.44mi |
| 5368 Olde St Stone Mountain, GA | 5.0 | 3.0 | 1988 | $2,195 | $1.10 | 24d | 1 | 0.49mi |
| 5579 Marbut Rd Lithonia, GA | 3.0 | 2.5 | 1280 | $1,850 | $1.45 | 45d | 1 | 0.51mi |
| 5356 Olde St Stone Mountain, GA | 3.0 | 2.5 | 1560 | $1,745 | $1.12 | 22d | 1 | 0.52mi |
| 5663 Windfall Ln Lithonia, GA | 3.0 | 2.5 | 1272 | $1,650 | $1.30 | 26d | 1 | 0.56mi |
| 5663 Windfall Ln Lithonia, GA | 3.0 | 2.5 | 1272 | $1,650 | $1.30 | 45d | 1 | 0.56mi |
| 5663 Saint Thomas Dr Lithonia, GA | 4.0 | 2.0 | 1230 | $1,595 | $1.30 | 14d | 1 | 0.58mi |
| 2079 Panola Way Ct Lithonia, GA | 4.0 | 3.0 | 1971 | $1,850 | $0.94 | 26d | 1 | 0.58mi |
| 1964 Taffeta Trl Lithonia, GA | 3.0 | 2.0 | 1508 | $1,870 | $1.24 | 21d | 1 | 0.59mi |
| 5788 Calle Vista Dr Lithonia, GA | 3.0 | 2.5 | 1593 | $2,300 | $1.44 | 20d | 1 | 0.59mi |
| 5812 Wind Gate Ln Lithonia, GA | 3.0 | 2.5 | 1372 | $1,700 | $1.24 | 45d | 1 | 0.69mi |
| 1874 Vauxhall Dr Lithonia, GA | 3.0 | 2.0 | 1367 | $1,595 | $1.17 | 5d | 1 | 0.71mi |
| 2207 Clayton Rdg Lithonia, GA | 4.0 | 3.0 | 2175 | $2,400 | $1.10 | 45d | 1 | 0.73mi |
| 2070 Scarbrough Trl E Stone Mountain, GA | 3.0 | 2.5 | 1608 | $1,920 | $1.19 | 1d | 1 | 0.79mi |
| 5885 Wellborn Trl Lithonia, GA | 3.0 | 2.0 | 1635 | $1,950 | $1.19 | 26d | 1 | 0.83mi |
| 5876 Old Wellborn Trce Lithonia, GA | 4.0 | 3.0 | 2418 | $2,200 | $0.91 | 45d | 1 | 0.84mi |
| 5811 Calico Ct Lithonia, GA | 4.0 | 2.5 | 2016 | $2,300 | $1.14 | 45d | 1 | 0.84mi |
| 5179 Scarbrough Trl W Stone Mountain, GA | 4.0 | 3.0 | 1700 | $1,650 | $0.97 | 1d | 1 | 0.85mi |
| 5883 Old Wellborn Trce Lithonia, GA | 3.0 | 2.0 | 1444 | $1,745 | $1.21 | 14d | 1 | 0.87mi |
| 5883 Poplin Ct Lithonia, GA | 5.0 | 2.0 | 1708 | $2,350 | $1.38 | 45d | 1 | 0.87mi |
| 1815 Herringbone Holw Lithonia, GA | 3.0 | 2.0 | 1812 | $1,750 | $0.97 | 45d | 1 | 0.90mi |
| 1724 Laurel Creek Cir Lithonia, GA | 3.0 | 2.5 | 1558 | $1,935 | $1.24 | 14d | 1 | 0.99mi |
| 2136 Sara Ashley Way Lithonia, GA | 3.0 | 2.0 | 1590 | $2,200 | $1.38 | 1d | 1 | 1.02mi |
Listing history 21 events
-
2026-05-21status Back On Market
-
2026-04-03status Under Contract
-
2026-03-24historical Active Under Contract
-
2026-03-17status Back On Market
-
2026-03-12historical Active Under Contract
-
2026-02-24$230,000 New
-
2025-11-05historical
-
2025-06-18price $300,000
-
2025-04-24price $295,000
-
2025-03-23$325,000 New
-
2025-03-23$325,000 Active
-
2022-07-13soldstatus $320,000
-
2022-06-06soldstatus $320,000 Closed
-
2022-06-06soldstatus $320,000 Sold
-
2022-05-09status Pending
-
2022-05-02status Under Contract
-
2022-05-02historical Active Under Contract
-
2022-04-29$315,000 Active
-
2022-04-29$315,000 New
-
2000-09-05soldstatus $127,000
-
1996-12-20soldstatus $96,400
ⓘ Source: listings_history table (triggers on properties + properties_extension) + one-shot
backfill from property_details.listing_events for pre-trigger history.
Tax reassessment forecast GA · Resets to sale price
- Current annual tax
- $3,266 · $272/mo
- Projected year-2 tax
- $3,266 · $272/mo
- Expected delta
- $0/yr ($0/mo · 0.0%)
ⓘ Screening estimate from a state-policy table — verify with the county assessor before closing.
Climate risk First Street
- Flood 1/10 Low FEMA zone X (unshaded) · 0% chance over 30 yrs
- Wildfire 1/10 Low
- Heat 6/10 Major 7 d/yr ≥105°F today · 18 d/yr by 30 yrs out
- Wind 5/10 Major 26% chance of damaging wind over 30 yrs
- Air quality 5/10 Major 7 unhealthy d/yr today · 10 by 30 yrs out
Nearby sold comps map
Loading sold comps map…
Walkable amenities ~0.75 mi
Loading nearby amenities…
Taxation est. · year 1
- Rental income
- $26,016
- − Mortgage interest
- −$12,884
- − Property taxes
- −$3,266
- − Insurance
- −$1,150
- − Repairs & maintenance
- −$2,081
- − Management
- −$2,081
- − Depreciation
- −$6,691
- Taxable loss
- −$2,137
- Est. tax savings @ 24.0%
- +$513
- After-tax cash flow
- $2,176/yr
For passive investors: Depreciation is non-cash, so a rental often shows a tax loss while cash-flowing — sheltering income. Rental losses are passive: they offset passive income freely, and up to $25,000/yr can offset ordinary (W-2) income if you actively participate and your MAGI is under $100k (phasing out to $0 by $150k); unused losses carry forward. On sale, claimed depreciation is recaptured at up to 25%, and gains may owe capital-gains tax (a 1031 exchange can defer both). Figures are a year-1 estimate at your 24.0% rate — not tax advice; consult a CPA.
Schools (NCES district)
- District
- Dekalb County
- NCES district ID
- 1301740
- Math proficiency
- 19% ▼ -12.00%
- Reading proficiency
- 28% ▼ -7.00%
- Median HH income
- $51,448
- Composite
- 20.92/100
- National rank
- #8482
- State rank
- #125 of 174 in GA
Livability — Stonecrest
No livability data for this city. (Only ~50 U.S. cities are tracked.)
Census & demographics
- Census place
- Stonecrest, GA
- County
- Dekalb County · 782,738 people
- City population
- 106,165
- Metro
- Atlanta-Sandy Springs-Alpharetta, GA
- Population (ZIP)
- 62,614
- Household income
- $61,684
- Rent vs Own
- Severe rent burden
- 3471.0
Population outlook (DeKalb County) Hauer SSP2
- Today (2025)
- 839,977 people
- By 2030
- 891,768 · +6.2%
- By 2040
- 988,894 · +17.7%
- By 2050
- 1,074,583 · +27.9%
- By 2075
- 1,245,026 · +48.2%
- By 2100
- 1,303,135 · +55.1%
Race, ethnicity, and origin ACS 2023
- Neighborhood character
- Predominantly Black (91%)
- Race & ethnicity
- Black 91% Hispanic / Latino 3% White 3% Two or more races 3%
- Common ancestry
- Hispanic 0%
- Foreign-born
- 12% · Canada, United Kingdom
- Languages at home
- 93% English-only · Spanish 2% French/Haitian/Cajun 1%
Political lean MEDSL · DeKalb
- 2024 margin
- Solid D (+64.8) · D 81.9% · R 17.1% · Other 1.0%
- 2008→2024 swing
- +6.1pp toward D · 2008: 58.6pp · 2024: 64.8pp
- All cycles
- 2024: D+64.8 2020: D+67.4 2016: D+64.8 2012: D+56.8 2008: D+58.6
Not yet ingested
- Civics
- —
Market trends
- HPI YoY
- ▼ -60.90%
- Current HPI
- 224.0366
- Rent YoY
- ▲ 1.18%
- Metro
- Atlanta-Sandy Springs-Alpharetta, GA
- State GDP YoY
- ▲ 2.66%
- F500 in state
- 28
Industry mix (Fortune 500 HQ in GA)
| Industry | F500 HQs | Revenue |
|---|---|---|
| Paper / Packaging | 2 | $29B |
|
||
| Retail | 1 | $160B |
|
||
| Transportation / Logistics | 1 | $91B |
|
||
| Airlines | 1 | $62B |
|
||
| Consumer Goods | 1 | $47B |
|
||
| Utilities | 1 | $25B |
|
||
Price history
+138.6% since first listed21 events — show timeline
- 2026-05-21 Relisted — GAMLS
- 2026-04-03 Pending — GAMLS
- 2026-03-24 Contingent — GAMLS
- 2026-03-17 Relisted — GAMLS
- 2026-03-12 Contingent — GAMLS
- 2026-02-24 Listed $230,000 GAMLS
- 2025-11-05 Listing Removed — GAMLS
- 2025-06-18 Price Changed $300,000 FMLS
- 2025-04-24 Price Changed $295,000 FMLS
- 2025-03-23 Listed $325,000 FMLS
- 2025-03-23 Listed $325,000 GAMLS
- 2022-07-13 Sold (Public Records) $320,000 Public Records
- 2022-06-06 Sold (MLS) $320,000 GAMLS
- 2022-06-06 Sold (MLS) $320,000 FMLS
- 2022-05-09 Pending — FMLS
- 2022-05-02 Pending — GAMLS
- 2022-05-02 Contingent — FMLS
- 2022-04-29 Listed $315,000 GAMLS
- 2022-04-29 Listed $315,000 FMLS
- 2000-09-05 Sold (Public Records) $127,000 Public Records
- 1996-12-20 Sold (Public Records) $96,400 Public Records
Property tax history
+4.3%/yrLatest (2025): $3,266 · -3.7% YoY. Source: county tax records.
Cash-flow waterfall
monthlySold comps — $/sqft
last 12 mo · ≤1 miLoading sold comps…