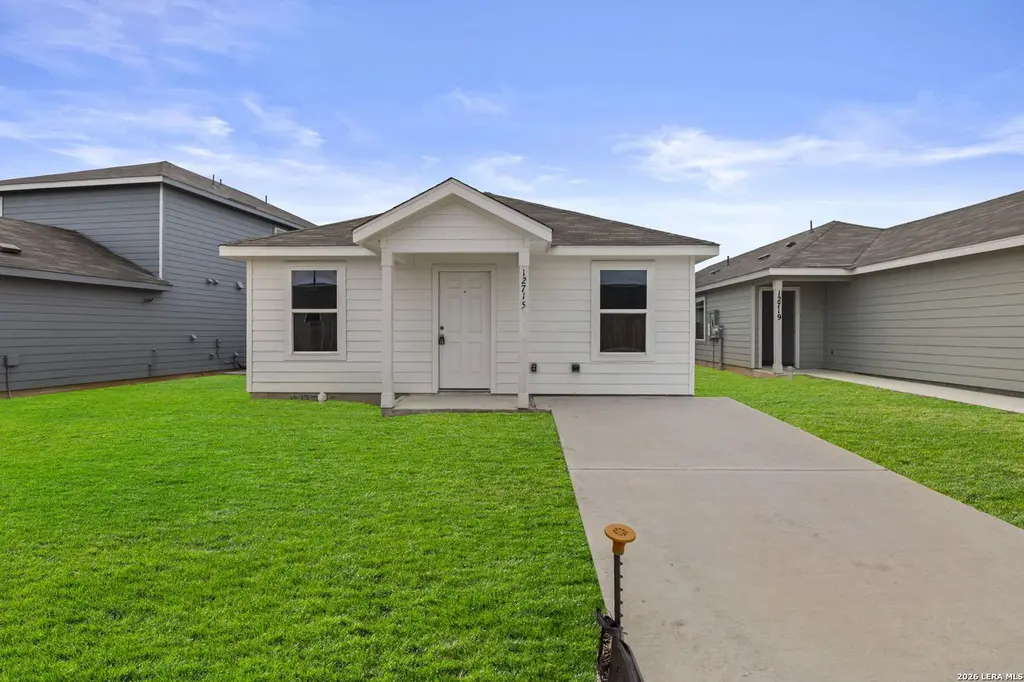
12715 Kathleen St · St. Hedwig, TX
Flood risk No data
- FEMA flood zone
- —
- Chance of flooding over 30 yrs
- —
- Est. flood insurance / yr
- —
Fire risk No data
- Est. fire insurance / yr
- —
Heat risk No data
- Hot days now (above threshold)
- —
- Hot days in 30 yrs
- —
Wind risk No data
- Chance of severe wind over 30 yrs
- —
Air-quality risk No data
- Unhealthy air days now
- —
- Unhealthy air days in 30 yrs
- —
Risk factors via First Street. Map © Google.
Why this score? — see what drove the C grade
The composite is a weighted blend of 9 inputs, each scored 0–100. Each bar is that input's sub-score; the figure is the points it added to the 100-point composite (weight × sub-score).
- Cash flow +21.2/30.0
- ARV discount +7.0/15.0
- DSCR +6.7/10.0
- Appreciation +5.6/10.0
- 1% rule +4.4/10.0
- Condition / age +4.0/5.0
- Livability +2.5/5.0
- Rent growth +2.3/5.0
- Schools +1.9/10.0
$189,500
🖨 Deal sheet 📄 Offer letter ✓ Due diligence
Listing remarks MLS
*Seller is willing to assist with closing costs or a rate buy-down through preferred lender with an acceptable offer. The Timms- This convenient single-story plan opens to three secondary bedrooms framing the entryway. Down the hall, an open peninsula-style kitchen overlooks an inviting dining area and a spacious family room, ideal for seamless modern living. The owner's suite is ideally situated in the back corner to provide a serene retreat, featuring a bedroom, attached bathroom and a walk-in closet.
Key facts
- 4,791 sq ft lot
- Built 2025
- Listed 66 days
Neighborhood map
What this means for you Summary
Snapshot
- This is a 4-bed/2.0-bath single-family listed at $190k. Condition is rated good.
Deal economics
- At list price, monthly cash flow is $273 ($3k/yr) — positive.
- The deal already cash-flows at list — no discount required.
- To meet the 1% rule (rent ≥ 1% of price), the offer needs to be $178k (5.8% below list).
- Recommended offer: $178k (6.0% below list) — sets the bar for market timing.
- Cap rate 8.0% vs local median 4.0% in St. Hedwig — top-decile yield for the area; either an underpriced asset or a hidden risk that comps aren't pricing in. Stress-test before assuming the spread holds.
Location & tenants
- Location reads: area grade C — affects rentability + tenant quality, not the cash-flow math above.
- East Central ISD (rural): math 16% / reading 25% proficiency, ranked #758 of 826 in TX (top 92%) — low school quality limits family demand, transient renter base, plan for 1-2y turnover; 61% free/reduced lunch — lower-income household profile, screen leases tightly.
- Market conditions: Rents soft (-0.9%/yr); 155 active listings in the ZIP; 40 comparable units currently listed for rent nearby; rentals at typical pace (median 17d on market — plan ~3-4 weeks tenant-placement turnaround); high-income renter base; 8,308 units permitted in Bexar County in 2024 (2,506 in 5+ unit buildings).
- This rent is only 17% of the median local income ($124k/yr) — well below the 30% rent-burden line; pricing power to push rent on renewal without tenant pushback.
Forward outlook
- In year one you build about $4k of equity ($1k loan paydown + $2k appreciation (1.2% local appreciation)).
- Bexar County population projected at +50% by 2050 — long-run rental-demand tailwind backs the buy-and-hold thesis.
- At projected returns (1.2% appreciation + 0.0% rent growth), your $53k cash investment doubles in ~8 years — after that, you're playing with house money.
- By year 9, paydown + projected appreciation supports a ~$33k cash-out refi (75% LTV) — recoverable capital for the next deal without selling this one.
Negotiation context
- It's been on market 66 days — a 6% lower offer ($178k) is reasonable based on typical stale-listing flexibility.
- 2 sale attempts with the ask held roughly flat each time — persistent listings suggest the price (not the market) is what's stuck; bring a comps-based counter.
Questions for the listing agent
- It's been on market 66 days. Have you received any prior offers? Is the seller open to a 6% concession, seller financing, or rate buy-down credit?
- What does the HOA fee cover, when was the last increase, and are there any pending special assessments or reserve-fund shortfalls?
- Why hasn't it sold? Are there any deal-killer items the seller is aware of (foundation, flood, title, zoning, code violations)?
- Is there a deadline driving the sale (1031 exchange, divorce, estate, relocation)? That informs how much negotiation room exists.
- What's the average days-on-market for RENTAL listings here right now (not sales)? A rising rental-DOM trend means longer vacancies and softer asking-rent achievability than the comps imply.
- What's the recent tenant-quality profile in this submarket — average credit score on applications, eviction rate, late-payment / NSF rate, and stable-employment percentage? A property-management company in the area should have these aggregated.
- How much new for-sale + rental construction is in the pipeline within 1–3 miles? Heavy new supply typically softens prices + rents 12–24 months out; constrained supply supports both.
Investment metrics
- 1% rule
- 0.94% ✗
- Cap rate
- 8.02%
- Cash-on-cash
- 6.17%
- DSCR
- 1.27
- GRM
- 8.9
CMA / ARV
- ARV (median comp)
- $187,588
- List price
- $189,500
- Delta
- 1.02%
- Verdict
- FAIR
- Comps
- 20 within 1.0 mi
Show comp detail 12 sales within ~0.75 mi
| Address | Dist | Beds/Ba | Sqft | Sold | Price | $/sf | Match |
|---|---|---|---|---|---|---|---|
| 12823 Kathleen St | 0.16mi | 4/2.0 | 1,500 (0%) | 3mo | $176,499 | $118 | 90 |
| 13011 Chinali Spgs | 0.21mi | 4/2.0 | 1,500 (0%) | 3mo | $184,950 | $123 | 88 |
| 3530 Jacobs Wl | 0.10mi | 4/2.0 | 1,500 (0%) | 11mo | $179,899 | $120 | 86 |
| 3606 Jacobs Wl | 0.11mi | 4/2.0 | 1,483 (-1%) | 12mo | $218,459 | $147 | 83 |
| 3921 Asher Aly | 0.36mi | 4/2.0 | 1,459 (-3%) | 4mo | $199,900 | $137 | 76 |
| 3857 Ivy Path | 0.26mi | 3/2.0 (-1) | 1,446 (-4%) | 6mo | $182,400 | $126 | 72 |
| 12915 Cicely Ct | 0.45mi | 3/2.0 (-1) | 1,339 (-11%) | 1mo | $209,900 | $157 | 55 |
| 12930 Deep Eddy | 0.24mi | 3/2.0 (-1) | 1,300 (-13%) | 8mo | $227,800 | $175 | 55 |
| 3925 Asher Aly | 0.37mi | 3/3.5 (-1) | 1,681 (+12%) | 2mo | $214,900 | $128 | 50 |
| 3916 Asher Aly | 0.39mi | 3/2.5 (-1) | 1,681 (+12%) | 6mo | $224,900 | $134 | 50 |
| 13012 Lineberry Ln | 0.42mi | 3/2.5 (-1) | 1,681 (+12%) | 7mo | $224,900 | $134 | 48 |
| 13027 Dolomar Pkwy | 0.59mi | 3/2.5 (-1) | 1,700 (+13%) | 3mo | $224,347 | $132 | 41 |
Match score weights: distance 35% · size 25% · config 20% · recency 20%. Top-matched comps best support the ARV.
Projected returns pro-forma
1.24% appreciation · 0.0% rent growth · sell at horizon
- IRR
- 6.7%
- Equity multiple
- 1.34×
- Total profit
- $17,873
- Equity at exit
- $67,109
- IRR
- 9.0%
- Equity multiple
- 2.05×
- Total profit
- $55,807
- Equity at exit
- $91,081
Cash invested: $53,060 (down + closing). Projections, not guarantees.
Landlord ↔ Tenant lean methodology
- Overall (STATE)
- 87 Strongly Landlord-Friendly
- State Texas
- 87 Strongly Landlord-Friendly · R+5
- County
- — inherits STATE
- City
- — inherits STATE
ZIP-level market 78152
- Home prices YoY
- 0.4%
- Rents YoY
- -0.9%
- Active inventory
- 155
- Price-to-rent
- 8.9×
Monthly cashflow live
- Estimated rent
- $1,784 high interval (Pro) →
- Mortgage (P&I)
- −$994
- Tax from tax record
- −$47 /mo · $566/yr
- Insurance
- −$79
- HOA
- −$17
- Vacancy / Maint / Mgmt
- −$375
- Net cashflow
- $273
Break-even live
UW: 25.0% down · 7.5% · 30yr · 1.5% tax · 5.0% vac · 8.0% maint · 8.0% mgmt
Financing live
Cash to close
- Down payment
- $47,375
- Closing costs
- $5,685
- Reserves months
- —
- Total cash needed
- —
Loan-product check · same deal, 3 products live
Conventional
25% down · 7.5% · 30yr
- Down + closing
- —
- Monthly P&I
- —
- Monthly cashflow
- —
- DSCR
- —
- Eligible?
- —
Personal DTI + credit; lowest rate.
DSCR
20% down · 8.5% · 30yr
- Down + closing
- —
- Monthly P&I
- —
- Monthly cashflow
- —
- DSCR
- —
- Eligible?
- —
No personal income docs; deal must DSCR.
Hard money
10% down · 12.0% · 12mo
- Down + closing
- —
- Monthly P&I
- —
- Monthly cashflow
- —
- DSCR
- —
- Eligible?
- —
Short-term bridge; refi at stabilization.
Rent comps 40 comps
| Address | Beds | Baths | Sqft | Rent | $/sqft | DOM | Units | Dist |
|---|---|---|---|---|---|---|---|---|
| 12932 Lake Fryer Converse, TX | 3.0 | 2.0 | 1230 | $1,200 | $0.98 | 4d | 1 | 0.11mi |
| 3414 Jacobs Wls Saint Hedwig, TX | 3.0 | 2.0 | 1450 | $1,325 | $0.91 | 4d | 1 | 0.17mi |
| 12927 Deep Eddy Saint Hedwig, TX | 4.0 | 2.0 | 1880 | $1,695 | $0.90 | 44d | 1 | 0.24mi |
| 3923 Ivy Path Saint Hedwig, TX | 3.0 | 2.0 | 1445 | $1,600 | $1.11 | 24d | 1 | 0.25mi |
| 12942 Deep Eddy Saint Hedwig, TX | 3.0 | 2.0 | 1129 | $1,495 | $1.32 | 44d | 1 | 0.28mi |
| 13015 Kathleen St Saint Hedwig, TX | 3.0 | 2.0 | 1235 | $1,540 | $1.25 | 22d | 1 | 0.30mi |
| 13015 Kathleen St Saint Hedwig, TX | 3.0 | 2.0 | 1235 | $1,540 | $1.25 | 24d | 1 | 0.30mi |
| 13015 Red Elks Lks Saint Hedwig, TX | 3.0 | 2.0 | 1445 | $1,650 | $1.14 | 3d | 1 | 0.30mi |
| 3921 Abbott Pass Unit 101 St Hedwig, TX | 3.0 | 2.5 | 1345 | $1,595 | $1.19 | 11d | 1 | 0.34mi |
| 3925 Abbott Pass Unit 101 St Hedwig, TX | 3.0 | 2.5 | 1345 | $1,450 | $1.08 | 44d | 1 | 0.35mi |
| 3933 Abbott Pass Unit 101 St Hedwig, TX | 3.0 | 2.5 | 1345 | $1,450 | $1.08 | 24d | 1 | 0.35mi |
| 3937 Abbott Pass Unit 102 St Hedwig, TX | 3.0 | 2.5 | 1345 | $1,495 | $1.11 | 44d | 1 | 0.35mi |
| 3815 Abbott Pass Unit 102 St Hedwig, TX | 3.0 | 2.5 | 1345 | $1,450 | $1.08 | 44d | 1 | 0.36mi |
| 3909 Asher Aly Saint Hedwig, TX | 3.0–4.0 | 2.0–2.5 | 1575 | $1,670 | $1.06 | 2d | 1 | 0.37mi |
| 3932 Abbott Pass Unit 102 St Hedwig, TX | 3.0 | 2.5 | 1345 | $1,495 | $1.11 | 24d | 1 | 0.38mi |
| 3936 Abbott Pass Unit 101 St Hedwig, TX | 3.0 | 2.5 | 1345 | $1,450 | $1.08 | 22d | 1 | 0.38mi |
| 4211 Asher Aly Saint Hedwig, TX | 3.0 | 2.0 | 1248 | $1,438 | $1.15 | 4d | 1 | 0.42mi |
| 13019 Lineberry Ln Saint Hedwig, TX | 3.0 | 2.0 | 1689 | $1,638 | $0.97 | 15d | 1 | 0.44mi |
| 13117 Candace Way Converse, TX | 4.0 | 2.5 | 1903 | $1,800 | $0.95 | 4d | 1 | 0.46mi |
| 13112 Candace Way Saint Hedwig, TX | 4.0 | 2.5 | 1903 | $1,750 | $0.92 | 4d | 1 | 0.48mi |
| 4241 Fort Palmer Blvd Saint Hedwig, TX | 3.0 | 2.5 | 1858 | $1,880 | $1.01 | 2d | 1 | 0.49mi |
| 13014 Candace Way Converse, TX | 3.0 | 2.5 | 1553 | $1,675 | $1.08 | 4d | 1 | 0.51mi |
| 13038 Candace Way Converse, TX | 3.0 | 2.5 | 1689 | $1,675 | $0.99 | 4d | 1 | 0.51mi |
| 13023 Heathers Elm Saint Hedwig, TX | 3.0 | 2.0 | 1234 | $1,500 | $1.22 | 2d | 1 | 0.69mi |
| 4522 Heathers Cross Saint Hedwig, TX | 3.0 | 2.0 | 1652 | $1,900 | $1.15 | 16d | 1 | 0.82mi |
| 4614 Heathers Cross Saint Hedwig, TX | 3.0 | 2.0 | 1770 | $1,850 | $1.05 | 24d | 1 | 0.83mi |
| 13039 Heathers Sun Saint Hedwig, TX | 4.0 | 2.5 | 2216 | $1,895 | $0.86 | 24d | 1 | 0.84mi |
| 4522 Meerkat Converse, TX | 3.0 | 2.0 | 1489 | $1,750 | $1.18 | 11d | 1 | 0.85mi |
| 4550 Meerkat Converse, TX | 4.0 | 2.5 | 2041 | $1,950 | $0.96 | 16d | 1 | 0.86mi |
| 4918 Valenzuela Converse, TX | 3.0–4.0 | 2.0–2.5 | 1719 | $2,144 | $1.25 | 2d | 82 | 0.87mi |
| 13111 Bay Point Way Saint Hedwig, TX | 3.0 | 2.0 | 1642 | $1,595 | $0.97 | 24d | 1 | 1.07mi |
| 13302 Savory Pl Converse, TX | 3.0 | 2.0 | 1217 | $1,499 | $1.23 | 12d | 1 | 1.11mi |
| 5424 Thyme Cor Saint Hedwig, TX | 4.0 | 2.0 | 1667 | $1,450 | $0.87 | 20d | 1 | 1.12mi |
| 12811 Sage Turn Converse, TX | 4.0 | 3.0 | 1914 | $1,800 | $0.94 | 24d | 1 | 1.14mi |
| 13014 Rosemary Cv Saint Hedwig, TX | 3.0 | 2.0 | 1479 | $1,800 | $1.22 | 24d | 1 | 1.15mi |
| 13003 Rosemary Cv Converse, TX | 4.0 | 3.0 | 1910 | $1,726 | $0.90 | 11d | 1 | 1.15mi |
| 5333 Basil Chase Converse, TX | 3.0 | 2.0 | 1474 | $1,680 | $1.14 | 15d | 1 | 1.18mi |
| 12922 Sage Turn Saint Hedwig, TX | 4.0 | 2.0 | 1667 | $1,597 | $0.96 | 24d | 1 | 1.18mi |
| 5510 Basil Chase St Hedwig, TX | 3.0 | 2.0 | 1217 | $1,625 | $1.34 | 18d | 1 | 1.21mi |
| 13505 Sunrise Mdw Saint Hedwig, TX | 3.0 | 2.0 | 1111 | $1,671 | $1.50 | 4d | 1 | 1.24mi |
HOA detail
- Monthly dues
- $17 · $204/yr
Listing history 18 events
-
2026-06-18days on market $189,500 Active 66 DOM
-
2026-06-17days on market $189,500 Active 65 DOM
-
2026-06-16days on market $189,500 Active 64 DOM
-
2026-06-15days on market $189,500 Active 63 DOM
-
2026-06-13days on market $189,500 Active 61 DOM
-
2026-06-09days on market $189,500 Active 57 DOM
-
2026-06-08days on market $189,500 Active 56 DOM
-
2026-06-07days on market $189,500 Active 55 DOM
-
2026-06-04days on market $189,500 Active 52 DOM
-
2026-06-03days on market $189,500 Active 51 DOM
-
2026-06-02statusdays on market $189,500 Active 50 DOM
-
2026-06-01days on market $189,500 Price Change 49 DOM
-
2026-05-31days on market $189,500 Price Change 48 DOM
-
2026-04-13$190,000 New 508-char remark
Show marketing remark (508 chars)
*Seller is willing to assist with closing costs or a rate buy-down through preferred lender with an acceptable offer. The Timms- This convenient single-story plan opens to three secondary bedrooms framing the entryway. Down the hall, an open peninsula-style kitchen overlooks an inviting dining area and a spacious family room, ideal for seamless modern living. The owner's suite is ideally situated in the back corner to provide a serene retreat, featuring a bedroom, attached bathroom and a walk-in closet.
-
2026-03-27soldstatus Sold 489-char remark
Show marketing remark (489 chars)
The Timms- This convenient single-story plan opens to three secondary bedrooms framing the entryway. Down the hall, an open peninsula-style kitchen overlooks an inviting dining area and a spacious family room, ideal for seamless modern living. The owner's suite is ideally situated in the back corner to provide a serene retreat, featuring a bedroom, attached bathroom and a walk-in closet. Prices and features may vary and are subject to change. Photos are for illustrative purposes only.
-
2026-03-04status Pending 489-char remark
Show marketing remark (489 chars)
The Timms- This convenient single-story plan opens to three secondary bedrooms framing the entryway. Down the hall, an open peninsula-style kitchen overlooks an inviting dining area and a spacious family room, ideal for seamless modern living. The owner's suite is ideally situated in the back corner to provide a serene retreat, featuring a bedroom, attached bathroom and a walk-in closet. Prices and features may vary and are subject to change. Photos are for illustrative purposes only.
-
2026-02-24price $218,499 489-char remark
Show marketing remark (489 chars)
The Timms- This convenient single-story plan opens to three secondary bedrooms framing the entryway. Down the hall, an open peninsula-style kitchen overlooks an inviting dining area and a spacious family room, ideal for seamless modern living. The owner's suite is ideally situated in the back corner to provide a serene retreat, featuring a bedroom, attached bathroom and a walk-in closet. Prices and features may vary and are subject to change. Photos are for illustrative purposes only.
-
2026-01-12$223,499 New 489-char remark
Show marketing remark (489 chars)
The Timms- This convenient single-story plan opens to three secondary bedrooms framing the entryway. Down the hall, an open peninsula-style kitchen overlooks an inviting dining area and a spacious family room, ideal for seamless modern living. The owner's suite is ideally situated in the back corner to provide a serene retreat, featuring a bedroom, attached bathroom and a walk-in closet. Prices and features may vary and are subject to change. Photos are for illustrative purposes only.
ⓘ Source: listings_history table (triggers on properties + properties_extension) + one-shot
backfill from property_details.listing_events for pre-trigger history.
Tax reassessment forecast TX · Resets to sale price
- Current annual tax
- $566 · $47/mo
- Projected year-2 tax
- $3,468 · $289/mo
- Expected delta
- +$2,902/yr (+$242/mo · 512.8%)
ⓘ Screening estimate from a state-policy table — verify with the county assessor before closing.
Nearby sold comps map
Loading sold comps map…
Walkable amenities ~0.75 mi
Loading nearby amenities…
Taxation est. · year 1
- Rental income
- $21,411
- − Mortgage interest
- −$10,615
- − Property taxes
- −$566
- − Insurance
- −$948
- − Repairs & maintenance
- −$1,713
- − Management
- −$1,713
- − HOA
- −$204
- − Depreciation
- −$5,513
- Taxable income
- $140
- Est. tax owed @ 24.0%
- −$34
- After-tax cash flow
- $3,238/yr
For passive investors: Depreciation is non-cash, so a rental often shows a tax loss while cash-flowing — sheltering income. Rental losses are passive: they offset passive income freely, and up to $25,000/yr can offset ordinary (W-2) income if you actively participate and your MAGI is under $100k (phasing out to $0 by $150k); unused losses carry forward. On sale, claimed depreciation is recaptured at up to 25%, and gains may owe capital-gains tax (a 1031 exchange can defer both). Figures are a year-1 estimate at your 24.0% rate — not tax advice; consult a CPA.
Condition & rehab AI · 6 photos
This single-story home is in good condition with minimal repairs needed. Upgrades to paint, flooring, and appliances would significantly enhance its value for both resale and rental.
Value-add opportunities
- Both Painting exterior and interior walls — Fresh paint enhances curb appeal and interior aesthetics
- Both Replacing carpet with hardwood or tile flooring — Hardwood or tile flooring is more durable and adds value
- Both Upgrading kitchen appliances — Modern appliances improve functionality and appeal
- Both Upgrading bathrooms with modern fixtures — Modern fixtures enhance functionality and appeal
- Both Landscaping improvements — Landscaping improvements enhance curb appeal and property value
Renovation cost estimate screening
Value-add ROI direction
- Both Painting exterior and interior walls — Fresh paint enhances curb appeal and interior aesthetics ↑
- Both Replacing carpet with hardwood or tile flooring — Hardwood or tile flooring is more durable and adds value ↑
- Both Upgrading kitchen appliances — Modern appliances improve functionality and appeal ↑
- Both Upgrading bathrooms with modern fixtures — Modern fixtures enhance functionality and appeal ↑
- Both Landscaping improvements — Landscaping improvements enhance curb appeal and property value ↑
ⓘ Cost ranges are severity-bucket heuristics (US national rule-of-thumb). Get contractor quotes + a written scope before underwriting a rehab budget.
Schools (NCES district)
- District
- East Central ISD
- NCES district ID
- 4817850
- Math proficiency
- 16% ▼ -12.00%
- Reading proficiency
- 25% ▼ -6.00%
- Median HH income
- $53,941
- Composite
- 18.67/100
- National rank
- #8887
- State rank
- #758 of 826 in TX
Livability — St. Hedwig
No livability data for this city. (Only ~50 U.S. cities are tracked.)
Census & demographics
- County
- Bexar County · 1,990,555 people
- City population
- 3,958
- Metro
- San Antonio-New Braunfels, TX
- Population (ZIP)
- 4,521
- Household income
- $123,981
- Rent vs Own
- Severe rent burden
- 27.0
Population outlook (Bexar County) Hauer SSP2
- Today (2025)
- 2,336,851 people
- By 2030
- 2,560,728 · +9.6%
- By 2040
- 3,020,569 · +29.3%
- By 2050
- 3,493,522 · +49.5%
- By 2075
- 4,668,459 · +99.8%
- By 2100
- 5,533,242 · +136.8%
Race, ethnicity, and origin ACS 2023
- Neighborhood character
- Diverse neighborhood (Simpson 0.58)
- Race & ethnicity
- White 56% Hispanic / Latino 31% Two or more races 21% Black 4%
- Hispanic origin (detail)
- Mexican 23% Puerto Rican 1%
- Common ancestry
- Romanian 17% Lithuanian 2% Slovak 2%
- Foreign-born
- 8% · Canada
- Languages at home
- 89% English-only · Spanish 10% Tagalog/Filipino 1%
Political lean MEDSL · Bexar
- 2024 margin
- Lean D (+9.8) · D 54.3% · R 44.6% · Other 1.1%
- 2008→2024 swing
- +4.2pp toward D · 2008: 5.6pp · 2024: 9.8pp
- All cycles
- 2024: D+9.8 2020: D+18.2 2016: D+13.5 2012: D+4.6 2008: D+5.6
Not yet ingested
- Civics
- —
Market trends
- HPI YoY
- ▲ 1.24%
- Current HPI
- 328.7859
- Rent YoY
- ▼ -0.90%
- Metro
- San Antonio-New Braunfels, TX
- State GDP YoY
- ▲ 3.95%
- F500 in state
- 110
Industry mix (Fortune 500 HQ in TX)
| Industry | F500 HQs | Revenue |
|---|---|---|
| Energy | 16 | $1,198B |
|
||
| Technology | 5 | $198B |
|
||
| Engineering / Construction | 4 | $72B |
|
||
| Energy Services | 3 | $60B |
|
||
| Utilities | 3 | $41B |
|
||
| Healthcare | 2 | $330B |
|
||
Price history
-15.0% since first listed5 events — show timeline
- 2026-04-13 Listed $190,000 LERA
- 2026-03-27 Sold (MLS) — LERA
- 2026-03-04 Pending — LERA
- 2026-02-24 Price Changed $218,499 LERA
- 2026-01-12 Listed $223,499 LERA
Property tax history
+17.1%/yrLatest (2025): $566 · +17.1% YoY. Source: county tax records.
Cash-flow waterfall
monthlySold comps — $/sqft
last 12 mo · ≤1 miLoading sold comps…