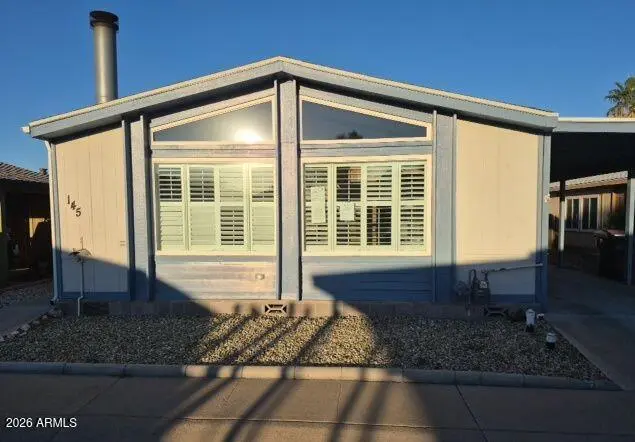
11275 N 99th Ave #145 · Peoria, AZ
Flood risk 1/10 · Minimal
- FEMA flood zone
- X (shaded)
- Chance of flooding over 30 yrs
- 0.0%
- Est. flood insurance / yr
- $507 – $1,088
Fire risk 1/10 · Minimal
- Est. fire insurance / yr
- $610 – $1,132
Heat risk 9/10 · Severe
- Hot days now (above 113°F)
- 7 days/yr
- Hot days in 30 yrs
- 19 days/yr
Wind risk 1/10 · Minimal
- Chance of severe wind over 30 yrs
- —
Air-quality risk 2/10 · Minimal
- Unhealthy air days now
- 1 days/yr
- Unhealthy air days in 30 yrs
- 1 days/yr
Risk factors via First Street. Map © Google.
Why this score? — see what drove the C grade
The composite is a weighted blend of 9 inputs, each scored 0–100. Each bar is that input's sub-score; the figure is the points it added to the 100-point composite (weight × sub-score).
- Cash flow +19.7/30.0
- ARV discount +15.0/15.0
- DSCR +6.3/10.0
- 1% rule +4.8/10.0
- Livability +3.8/5.0
- Schools +3.5/10.0
- Rent growth +2.7/5.0
- Condition / age +2.5/5.0
- Appreciation +0.0/10.0
$197,600
🖨 Deal sheet 📄 Offer letter ✓ Due diligence
Listing remarks MLS
Inviting 2-bedroom, 2-bath home filled with natural light and comfortable living space. Enjoy a covered patio, fenced yard, storage shed, and 2-car attached carport--ideal for everyday convenience. Set in a peaceful Peoria neighborhood with easy access to shopping, dining, and daily essentials along Peoria Ave and Grand Ave. Outdoor destinations like Rio Vista Community Park, scenic trails, and the Peoria Sports Complex are just minutes away. The home shows deferred maintenance and an outdated interior, offering a great chance to refresh, personalize, and add value in a well-located area.
Key facts
- Attached carport
- Fenced yard
- Covered patio
Tags
Neighborhood map
What this means for you Summary
Snapshot
- This is a 2-bed/2.0-bath manufactured listed at $198k.
Deal economics
- At list price, monthly cash flow is $233 ($3k/yr) — positive.
- The deal already cash-flows at list — no discount required.
- To meet the 1% rule (rent ≥ 1% of price), the offer needs to be $194k (1.8% below list).
- Recommended offer: $186k (6.0% below list) — sets the bar for market timing.
- Cap rate 7.7% vs local median 3.3% in Peoria — top-decile yield for the area; either an underpriced asset or a hidden risk that comps aren't pricing in. Stress-test before assuming the spread holds.
Location & tenants
- Location reads 76/100 on livability (#14 in AZ, #3,603 nationally) — a middle-class / working-renter tenant base. Strengths: housing A+, commute A, employment A; Watch: cost of living C-, amenities D, health & safety F.
- Peoria Unified School District (4237) (suburban): math 36% / reading 42% proficiency, ranked #64 of 249 in AZ (top 26%) — families likely to look elsewhere, expect single-tenant / working-renter base with shorter leases.
- Market conditions: Rents flat; 333 active listings in the ZIP; 33 comparable units currently listed for rent nearby; rentals at typical pace (median 24d on market — plan ~3-4 weeks tenant-placement turnaround); 36,011 units permitted in Maricopa County in 2024 (12,801 in 5+ unit buildings).
- This rent runs 35% of the median local income ($67k/yr) — at the standard rent-burdened threshold; future hikes will face affordability resistance.
Forward outlook
- Local home prices are declining (-3.0%/yr); year-one equity from $1k of loan paydown is wiped out by about $6k of value loss. Plan a longer hold.
- Maricopa County population projected at +38% by 2050 — long-run rental-demand tailwind backs the buy-and-hold thesis.
Negotiation context
- It's been on market 86 days — a 6% lower offer ($186k) is reasonable based on typical stale-listing flexibility.
- 5 sale attempts since 2y ago; this cycle's ask has dropped $49k (20%) from the opening price — seller is motivated, your offer sets the floor, not the list.
- Current owner paid $66k; list at $198k implies a 201% gain — meaningful room to come down on a strong offer.
Risks & watch-outs
- Climate carrying-cost: extreme-heat days projected 7→19/yr by 2055 (HVAC capex compounding) — expect insurance premiums to compound above CPI over the hold.
Questions for the listing agent
- It's been on market 86 days. Have you received any prior offers? Is the seller open to a 6% concession, seller financing, or rate buy-down credit?
- What does the HOA fee cover, when was the last increase, and are there any pending special assessments or reserve-fund shortfalls?
- Why hasn't it sold? Are there any deal-killer items the seller is aware of (foundation, flood, title, zoning, code violations)?
- Is there a deadline driving the sale (1031 exchange, divorce, estate, relocation)? That informs how much negotiation room exists.
- Schools are B-rated — typically a magnet for longer-tenancy family renters. What's the average tenant stay here, and is there a school-zone premium baked into asking?
- What's the average days-on-market for RENTAL listings here right now (not sales)? A rising rental-DOM trend means longer vacancies and softer asking-rent achievability than the comps imply.
- What's the recent tenant-quality profile in this submarket — average credit score on applications, eviction rate, late-payment / NSF rate, and stable-employment percentage? A property-management company in the area should have these aggregated.
- How much new for-sale + rental construction is in the pipeline within 1–3 miles? Heavy new supply typically softens prices + rents 12–24 months out; constrained supply supports both.
Investment metrics
- 1% rule
- 0.98% ✗
- Cap rate
- 7.71%
- Cash-on-cash
- 5.06%
- DSCR
- 1.23
- GRM
- 8.5
CMA / ARV
- ARV (median comp)
- $269,706
- List price
- $197,600
- Delta
- -26.73%
- Verdict
- UNDERPRICED
- Comps
- 20 within 1.0 mi
Show comp detail 12 sales within ~0.75 mi
| Address | Dist | Beds/Ba | Sqft | Sold | Price | $/sf | Match |
|---|---|---|---|---|---|---|---|
| 10701 N 99 Ave #209 | 0.19mi | 3/2.0 (+1) | 1,440 (0%) | 1mo | $83,000 | $58 | 85 |
| 11275 N 99th Ave #119 | 0.04mi | 3/2.0 (+1) | 1,392 (-3%) | 4mo | $265,000 | $190 | 84 |
| 11275 N 99th Ave #61 | 0.09mi | 3/2.0 (+1) | 1,402 (-3%) | 3mo | $268,500 | $192 | 84 |
| 11275 N 99th Ave #118 | 0.04mi | 3/2.0 (+1) | 1,273 (-12%) | 2mo | $265,000 | $208 | 72 |
| 10701 N 99th Ave #22 | 0.18mi | 2/2.0 | 1,624 (+13%) | 7mo | $55,000 | $34 | 65 |
| 10701 N 99th Ave #61 | 0.23mi | 3/2.0 (+1) | 1,560 (+8%) | 14mo | $85,500 | $55 | 59 |
| 10951 N 91st Ave #266 | 0.72mi | 3/2.0 (+1) | 1,456 (+1%) | 3mo | $119,000 | $82 | 57 |
| 11000 N 91st Ave #101 | 0.59mi | 2/2.0 | 1,350 (-6%) | 10mo | $120,000 | $89 | 54 |
| 10701 N 99th Ave #115 | 0.23mi | 3/2.0 (+1) | 1,248 (-13%) | 11mo | $82,900 | $66 | 53 |
| 10951 N 91st Ave #61 | 0.72mi | 3/2.0 (+1) | 1,320 (-8%) | 4mo | $79,000 | $60 | 44 |
| 11000 N 91st Ave #19 | 0.59mi | 3/2.0 (+1) | 1,600 (+11%) | 10mo | $125,000 | $78 | 41 |
| 10201 N 99th Ave #166 | 0.64mi | 3/2.0 (+1) | 1,248 (-13%) | 8mo | $55,000 | $44 | 36 |
Match score weights: distance 35% · size 25% · config 20% · recency 20%. Top-matched comps best support the ARV.
Projected returns pro-forma
-3.0% appreciation · 0.62% rent growth · sell at horizon
- IRR
- -11.1%
- Equity multiple
- 0.61×
- Total profit
- $-21,717
- Equity at exit
- $29,463
- IRR
- -5.5%
- Equity multiple
- 0.68×
- Total profit
- $-17,591
- Equity at exit
- $17,085
Cash invested: $55,328 (down + closing). Projections, not guarantees.
Landlord ↔ Tenant lean methodology
- Overall (STATE)
- 87 Strongly Landlord-Friendly
- State Arizona
- 87 Strongly Landlord-Friendly · R+3
- County
- — inherits STATE
- City
- — inherits STATE
ZIP-level market 85345
- Home prices YoY
- -19.8%
- Rents YoY
- 0.6%
- Active inventory
- 333
- Price-to-rent
- 8.5×
Monthly cashflow live
- Estimated rent
- $1,941 high interval (Pro) →
- Mortgage (P&I)
- −$1,036
- Tax from tax record
- −$42 /mo · $500/yr
- Insurance
- −$82
- HOA
- −$140
- Vacancy / Maint / Mgmt
- −$408
- Net cashflow
- $233
Break-even live
UW: 25.0% down · 7.5% · 30yr · 1.5% tax · 5.0% vac · 8.0% maint · 8.0% mgmt
Financing live
Cash to close
- Down payment
- $49,400
- Closing costs
- $5,928
- Reserves months
- —
- Total cash needed
- —
Loan-product check · same deal, 3 products live
Conventional
25% down · 7.5% · 30yr
- Down + closing
- —
- Monthly P&I
- —
- Monthly cashflow
- —
- DSCR
- —
- Eligible?
- —
Personal DTI + credit; lowest rate.
DSCR
20% down · 8.5% · 30yr
- Down + closing
- —
- Monthly P&I
- —
- Monthly cashflow
- —
- DSCR
- —
- Eligible?
- —
No personal income docs; deal must DSCR.
Hard money
10% down · 12.0% · 12mo
- Down + closing
- —
- Monthly P&I
- —
- Monthly cashflow
- —
- DSCR
- —
- Eligible?
- —
Short-term bridge; refi at stabilization.
Rent comps 33 comps
| Address | Beds | Baths | Sqft | Rent | $/sqft | DOM | Units | Dist |
|---|---|---|---|---|---|---|---|---|
| 10822 N Balboa Dr Sun City, AZ | 2.0 | 1.0 | 942 | $3,000 | $3.18 | 24d | 1 | 0.47mi |
| 10316 N 94th Ln Peoria, AZ | 3.0 | 2.0 | 1352 | $2,000 | $1.48 | 24d | 1 | 0.58mi |
| 10022 W Lakeview Cir N Sun City, AZ | 2.0 | 2.0 | 1575 | $2,800 | $1.78 | 24d | 1 | 0.62mi |
| 9426 W Monroe St Peoria, AZ | 3.0 | 3.5 | 1405 | $1,800 | $1.28 | 16d | 1 | 0.67mi |
| 10110 N 97th Dr Unit A Peoria, AZ | 2.0 | 1.5 | 1025 | $1,500 | $1.46 | 24d | 1 | 0.72mi |
| 10104 N 96th Dr Unit A Peoria, AZ | 2.0 | 2.0 | 1072 | $1,750 | $1.63 | 24d | 1 | 0.74mi |
| 11411 N 91st Ave Unit 134 Peoria, AZ | 3.0 | 2.0 | 1310 | $1,599 | $1.22 | 43d | 1 | 0.76mi |
| 9626 W Mountain View Rd Unit A Peoria, AZ | 2.0 | 2.0 | 1156 | $1,500 | $1.30 | 43d | 1 | 0.88mi |
| 9323 W Ironwood Dr Peoria, AZ | 3.0 | 2.0 | 1306 | $1,985 | $1.52 | 24d | 1 | 0.91mi |
| 9323 W Ironwood Dr Peoria, AZ | 3.0 | 2.0 | 1306 | $2,085 | $1.60 | 43d | 1 | 0.91mi |
| 12751 N Plaza Del Rio Blvd Peoria, AZ | 1.0–2.0 | 1.0–2.0 | 1007 | $1,890 | $1.88 | 1d | 10 | 0.96mi |
| 8930 W Monroe St Peoria, AZ | 3.0 | 2.0 | 1300 | $1,899 | $1.46 | 43d | 2 | 1.03mi |
| 8930 W Monroe St Peoria, AZ | 3.0 | 2.0 | 1300 | $2,099 | $1.61 | 24d | 1 | 1.03mi |
| 10101 N 91st Ave #109 Peoria, AZ | 2.0 | 2.5 | 1161 | $1,395 | $1.20 | 2d | 1 | 1.04mi |
| 8821 W Sahuaro Dr Peoria, AZ | 3.0 | 2.0 | 1074 | $1,595 | $1.49 | 24d | 1 | 1.06mi |
| 8821 W Sahuaro Dr Peoria, AZ | 3.0 | 2.0 | 1074 | $1,595 | $1.49 | 2d | 1 | 1.06mi |
| 9002 W Malapai Dr Peoria, AZ | 3.0 | 2.0 | 1270 | $2,040 | $1.61 | 20d | 1 | 1.09mi |
| 10350 W Camden Ave Sun City, AZ | 2.0 | 2.0 | 1413 | $2,850 | $2.02 | 24d | 1 | 1.16mi |
| 10319 W Oakmont Dr Sun City, AZ | 2.0 | 2.0 | 1274 | $2,900 | $2.28 | 24d | 1 | 1.20mi |
| 8763 W Paradise Dr Peoria, AZ | 3.0 | 2.0 | 1575 | $1,800 | $1.14 | 43d | 1 | 1.23mi |
| 10221 N 87th Ln Peoria, AZ | 3.0 | 2.0 | 1232 | $2,059 | $1.67 | 43d | 1 | 1.23mi |
| 8782 W Shaw Butte Dr Peoria, AZ | 3.0 | 2.0 | 1575 | $2,200 | $1.40 | 24d | 1 | 1.24mi |
| 9680 W Olive Ave Peoria, AZ | 1.0–3.0 | 1.0–2.0 | 850 | $1,540 | $1.81 | 2d | 9 | 1.26mi |
| 8650 W Peoria Ave Peoria, AZ | 1.0–2.0 | 1.0–2.0 | 836 | $1,492 | $1.78 | 2d | 19 | 1.29mi |
| 8834 W Purdue Ave Peoria, AZ | 3.0 | 2.0 | 1319 | $1,800 | $1.36 | 3d | 1 | 1.33mi |
| 8560 W Peoria Ave Peoria, AZ | 2.0 | 1.0 | 888 | $1,450 | $1.63 | 1d | 8 | 1.37mi |
| 8630 W Shaw Butte Dr Peoria, AZ | 3.0 | 2.0 | 1284 | $1,951 | $1.52 | 12d | 1 | 1.41mi |
| 8621 W Shaw Butte Dr Peoria, AZ | 3.0 | 2.0 | 1546 | $1,975 | $1.28 | 18d | 1 | 1.41mi |
| 10729 W Sun City Blvd Sun City, AZ | 3.0 | 2.0 | 1697 | $3,500 | $2.06 | 24d | 1 | 1.43mi |
| 13310 N Plaza del Rio Blvd Peoria, AZ | 1.0–3.0 | 1.0–2.0 | 981 | $1,556 | $1.59 | 2d | 13 | 1.45mi |
| 9625 W Olive Ave Peoria, AZ | 1.0–3.0 | 1.0–3.0 | 1485 | $2,136 | $1.44 | 5d | 7 | 1.46mi |
| 12976 N 88th Ln Peoria, AZ | 3.0 | 2.5 | 1765 | $1,825 | $1.03 | 43d | 1 | 1.48mi |
| 12990 N 88th Ln Peoria, AZ | 3.0 | 2.5 | 1624 | $1,995 | $1.23 | 22d | 1 | 1.48mi |
HOA detail
- Monthly dues
- $140 · $1,680/yr
Listing history 22 events
-
2026-05-19price $197,600 595-char remark
Show marketing remark (595 chars)
Inviting 2-bedroom, 2-bath home filled with natural light and comfortable living space. Enjoy a covered patio, fenced yard, storage shed, and 2-car attached carport--ideal for everyday convenience. Set in a peaceful Peoria neighborhood with easy access to shopping, dining, and daily essentials along Peoria Ave and Grand Ave. Outdoor destinations like Rio Vista Community Park, scenic trails, and the Peoria Sports Complex are just minutes away. The home shows deferred maintenance and an outdated interior, offering a great chance to refresh, personalize, and add value in a well-located area.
-
2026-04-18price $222,500 595-char remark
Show marketing remark (595 chars)
Inviting 2-bedroom, 2-bath home filled with natural light and comfortable living space. Enjoy a covered patio, fenced yard, storage shed, and 2-car attached carport--ideal for everyday convenience. Set in a peaceful Peoria neighborhood with easy access to shopping, dining, and daily essentials along Peoria Ave and Grand Ave. Outdoor destinations like Rio Vista Community Park, scenic trails, and the Peoria Sports Complex are just minutes away. The home shows deferred maintenance and an outdated interior, offering a great chance to refresh, personalize, and add value in a well-located area.
-
2026-03-04$247,000 Active 595-char remark
Show marketing remark (595 chars)
Inviting 2-bedroom, 2-bath home filled with natural light and comfortable living space. Enjoy a covered patio, fenced yard, storage shed, and 2-car attached carport--ideal for everyday convenience. Set in a peaceful Peoria neighborhood with easy access to shopping, dining, and daily essentials along Peoria Ave and Grand Ave. Outdoor destinations like Rio Vista Community Park, scenic trails, and the Peoria Sports Complex are just minutes away. The home shows deferred maintenance and an outdated interior, offering a great chance to refresh, personalize, and add value in a well-located area.
-
2025-08-29Under Contract Accepting Backups
-
2025-07-28historical Under Contract Accepting Backups
-
2025-06-26price $239,710
-
2025-06-14price $249,900
-
2025-06-10price $262,500
-
2025-05-09price $264,500
-
2025-03-31status Active
-
2025-03-21status Pending
-
2025-03-21historical
-
2025-03-13price $265,000
-
2025-01-21price $285,000
-
2025-01-09price $299,900
-
2024-12-19status Active
-
2024-11-06historical
-
2024-10-31$315,000 Active
-
2000-08-22soldstatus $65,650
-
1998-12-22soldstatus $9,210
-
1996-06-28soldstatus $488,400
-
1991-10-17soldstatus $2,478,662
ⓘ Source: listings_history table (triggers on properties + properties_extension) + one-shot
backfill from property_details.listing_events for pre-trigger history.
Tax reassessment forecast AZ · Resets to sale price
- Current annual tax
- $500 · $42/mo
- Projected year-2 tax
- $1,304 · $109/mo
- Expected delta
- +$804/yr (+$67/mo · 160.9%)
ⓘ Screening estimate from a state-policy table — verify with the county assessor before closing.
Climate risk First Street
- Flood 1/10 Low FEMA zone X (shaded) · 0% chance over 30 yrs
- Wildfire 1/10 Low
- Heat 9/10 Extreme 7 d/yr ≥113°F today · 19 d/yr by 30 yrs out
- Wind 1/10 Low
- Air quality 2/10 Low 1 unhealthy d/yr today · 1 by 30 yrs out
Nearby sold comps map
Loading sold comps map…
Walkable amenities ~0.75 mi
Loading nearby amenities…
Taxation est. · year 1
- Rental income
- $23,293
- − Mortgage interest
- −$11,069
- − Property taxes
- −$500
- − Insurance
- −$988
- − Repairs & maintenance
- −$1,863
- − Management
- −$1,863
- − HOA
- −$1,680
- − Depreciation
- −$5,748
- Taxable loss
- −$419
- Est. tax savings @ 24.0%
- +$101
- After-tax cash flow
- $2,899/yr
For passive investors: Depreciation is non-cash, so a rental often shows a tax loss while cash-flowing — sheltering income. Rental losses are passive: they offset passive income freely, and up to $25,000/yr can offset ordinary (W-2) income if you actively participate and your MAGI is under $100k (phasing out to $0 by $150k); unused losses carry forward. On sale, claimed depreciation is recaptured at up to 25%, and gains may owe capital-gains tax (a 1031 exchange can defer both). Figures are a year-1 estimate at your 24.0% rate — not tax advice; consult a CPA.
Schools (NCES district)
- District
- Peoria Unified School District (4237)
- NCES district ID
- 0406250
- Math proficiency
- 36% ▼ -14.00%
- Reading proficiency
- 42% ▼ -8.00%
- Median HH income
- $60,171
- Composite
- 34.62/100
- National rank
- #5152
- State rank
- #64 of 249 in AZ
Livability — Peoria
- Score
- 76/100
- State rank
- #14
- US rank
- #3603
Category grades
Schools grade is shown separately in the Schools card above.
Census & demographics
- Census place
- Peoria, AZ
- County
- Maricopa County · 4,537,380 people
- City population
- 206,687
- Metro
- Phoenix-Mesa-Chandler, AZ
- Population (ZIP)
- 60,918
- Household income
- $67,380
- Rent vs Own
- Severe rent burden
- 1879.0
Population outlook (Maricopa County) Hauer SSP2
- Today (2025)
- 4,979,203 people
- By 2030
- 5,378,229 · +8.0%
- By 2040
- 6,156,598 · +23.6%
- By 2050
- 6,872,376 · +38.0%
- By 2075
- 8,401,270 · +68.7%
- By 2100
- 9,247,439 · +85.7%
Race, ethnicity, and origin ACS 2023
- Neighborhood character
- Diverse neighborhood (Simpson 0.62)
- Race & ethnicity
- White 51% Hispanic / Latino 34% Two or more races 14% Black 5% Asian 4% Native American 2%
- Hispanic origin (detail)
- Mexican 29%
- Common ancestry
- Romanian 2% Italian 2% Slovak 1%
- Foreign-born
- 13% · Canada, Vietnam
- Languages at home
- 76% English-only · Spanish 18% Other Indo-European 1% Vietnamese 1%
Political lean MEDSL · Maricopa
- 2024 margin
- Toss-up / Even · D 47.7% · R 51.2% · Other 1.1%
- 2008→2024 swing
- +7.1pp toward D · 2008: -10.6pp · 2024: -3.5pp
- All cycles
- 2024: R+3.5 2020: D+2.2 2016: R+3.5 2012: R+12.0 2008: R+10.6
Not yet ingested
- Civics
- —
Market trends
- HPI YoY
- ▼ -80.77%
- Current HPI
- 328.1069
- Rent YoY
- ▲ 0.62%
- Metro
- Phoenix-Mesa-Chandler, AZ
- State GDP YoY
- ▲ 4.54%
- F500 in state
- 20
Industry mix (Fortune 500 HQ in AZ)
| Industry | F500 HQs | Revenue |
|---|---|---|
| Technology | 2 | $13B |
|
||
| Mining / Metals | 1 | $23B |
|
||
| Environmental Services | 1 | $16B |
|
||
| Metals / Steel | 1 | $14B |
|
||
| Technology Distribution | 1 | $9B |
|
||
| Homebuilding | 1 | $8B |
|
||
Price history
-92.0% since first listed22 events — show timeline
- 2026-05-19 Price Changed $197,600 ARMLS
- 2026-04-18 Price Changed $222,500 ARMLS
- 2026-03-04 Listed $247,000 ARMLS
- 2025-08-29 Listed — ARMLS
- 2025-07-28 Contingent — ARMLS
- 2025-06-26 Price Changed $239,710 ARMLS
- 2025-06-14 Price Changed $249,900 ARMLS
- 2025-06-10 Price Changed $262,500 ARMLS
- 2025-05-09 Price Changed $264,500 ARMLS
- 2025-03-31 Relisted — ARMLS
- 2025-03-21 Pending — ARMLS
- 2025-03-21 Listing Removed — ARMLS
- 2025-03-13 Price Changed $265,000 ARMLS
- 2025-01-21 Price Changed $285,000 ARMLS
- 2025-01-09 Price Changed $299,900 ARMLS
- 2024-12-19 Relisted — ARMLS
- 2024-11-06 Listing Removed — ARMLS
- 2024-10-31 Listed $315,000 ARMLS
- 2000-08-22 Sold (Public Records) $65,650 Public Records
- 1998-12-22 Sold (Public Records) $9,210 Public Records
- 1996-06-28 Sold (Public Records) $488,400 Public Records
- 1991-10-17 Sold (Public Records) $2,478,662 Public Records
Property tax history
-1.9%/yrLatest (2025): $500 · -2.1% YoY. Source: county tax records.
Cash-flow waterfall
monthlySold comps — $/sqft
last 12 mo · ≤1 miLoading sold comps…