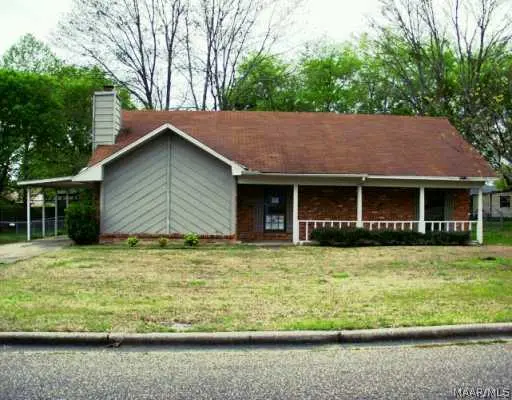
2208 Briar Gate Dr · Montgomery, AL
Flood risk 1/10 · Minimal
- FEMA flood zone
- X (unshaded)
- Chance of flooding over 30 yrs
- 0.0%
- Est. flood insurance / yr
- $507 – $1,088
Fire risk 3/10 · Minor
- Est. fire insurance / yr
- $916 – $1,700
Heat risk 8/10 · Major
- Hot days now (above 108°F)
- 7 days/yr
- Hot days in 30 yrs
- 20 days/yr
Wind risk 8/10 · Major
- Chance of severe wind over 30 yrs
- 80.0%
Air-quality risk 2/10 · Minimal
- Unhealthy air days now
- 1 days/yr
- Unhealthy air days in 30 yrs
- 3 days/yr
Risk factors via First Street. Map © Google.
Why this score? — see what drove the C- grade
The composite is a weighted blend of 9 inputs, each scored 0–100. Each bar is that input's sub-score; the figure is the points it added to the 100-point composite (weight × sub-score).
- Cash flow +20.7/30.0
- ARV discount +6.8/15.0
- DSCR +6.6/10.0
- 1% rule +4.7/10.0
- Rent growth +3.9/5.0
- Livability +3.2/5.0
- Condition / age +2.5/5.0
- Schools +1.7/10.0
- Appreciation +0.0/10.0
$179,900
🖨 Deal sheet 📄 Offer letter ✓ Due diligence
Listing remarks
This beautifully updated 4-bedroom, 2-bath home is truly move-in ready and packed with upgrades! Fresh interior and exterior paint gives the home a clean, modern feel, while brand-new LVP flooring throughout offers both style and durability. The kitchen shines with NEW countertops and NEW stainless steel appliances, perfect for everyday living and entertaining. You’ll also appreciate the details, including NEW light fixtures and NEW 2" blinds! BRAND NEW ROOF for peace of mind. With thoughtful updates from top to bottom, this home offers modern comfort and low-maintenance living—schedule your showing today!
Key facts
- Brand new roof
- New light fixtures
- New countertops
Tags
Neighborhood map
What this means for you Summary
Snapshot
- This is a 4-bed/2.0-bath single-family listed at $180k.
Deal economics
- At list price, monthly cash flow is $244 ($3k/yr) — positive.
- The deal already cash-flows at list — no discount required.
- To meet the 1% rule (rent ≥ 1% of price), the offer needs to be $175k (2.7% below list).
- Recommended offer: $158k (12.0% below list) — sets the bar for market timing.
- Cap rate 7.9% vs local median 6.0% in Montgomery — top-decile yield for the area; either an underpriced asset or a hidden risk that comps aren't pricing in. Stress-test before assuming the spread holds.
Location & tenants
- Location reads 65/100 on livability (#138 in AL) — a middle-class / working-renter tenant base. Strengths: cost of living A+, housing A+; Watch: schools C-, employment D, crime F.
- Montgomery County (urban): math 9% / reading 31% proficiency, ranked #106 of 129 in AL (top 82%) — low school quality limits family demand, transient renter base, plan for 1-2y turnover; 70% free/reduced lunch — lower-income household profile, screen leases tightly.
- Market conditions: Rents rising fast (+5.7%/yr); 293 active listings in the ZIP; 15 comparable units currently listed for rent nearby; rentals at typical pace (median 21d on market — plan ~3-4 weeks tenant-placement turnaround); 40% of comp listings sitting > 30 days — soft ceiling on asking rent; 460 units permitted in Montgomery County in 2024 (37 in 5+ unit buildings).
- This rent runs 38% of the median local income ($55k/yr) — at the standard rent-burdened threshold; future hikes will face affordability resistance.
Forward outlook
- Local home prices are declining (-3.0%/yr); year-one equity from $1k of loan paydown is wiped out by about $5k of value loss. Plan a longer hold.
- Montgomery County population projected to shrink 8% by 2050 — rents likely to lag national; underwrite the cash flow, not the appreciation.
Negotiation context
- It's been on market 130 days — a 12% lower offer ($158k) is reasonable based on typical stale-listing flexibility.
- 3 sale attempts since 25y ago; this cycle's ask has dropped $10k (5%) from the opening price — seller is motivated, your offer sets the floor, not the list.
- Current owner paid $110k; list at $180k implies a 64% gain — meaningful room to come down on a strong offer.
Risks & watch-outs
- Climate carrying-cost: severe wind risk, 80% chance of damaging wind over 30y; extreme-heat days projected 7→20/yr by 2055 (HVAC capex compounding) — expect insurance premiums to compound above CPI over the hold.
Questions for the listing agent
- It's been on market 130 days. Have you received any prior offers? Is the seller open to a 12% concession, seller financing, or rate buy-down credit?
- Built in 1979 — when were the roof, HVAC, electrical panel, plumbing, and water heater last replaced?
- Why hasn't it sold? Are there any deal-killer items the seller is aware of (foundation, flood, title, zoning, code violations)?
- Is there a deadline driving the sale (1031 exchange, divorce, estate, relocation)? That informs how much negotiation room exists.
- Crime grade is F in this area — have there been break-ins, vandalism, or insurance claims at this property in the last 3 years? What carrier currently insures it and at what premium?
- What's the average days-on-market for RENTAL listings here right now (not sales)? A rising rental-DOM trend means longer vacancies and softer asking-rent achievability than the comps imply.
- What's the recent tenant-quality profile in this submarket — average credit score on applications, eviction rate, late-payment / NSF rate, and stable-employment percentage? A property-management company in the area should have these aggregated.
- How much new for-sale + rental construction is in the pipeline within 1–3 miles? Heavy new supply typically softens prices + rents 12–24 months out; constrained supply supports both.
Investment metrics
- 1% rule
- 0.97% ✗
- Cap rate
- 7.92%
- Cash-on-cash
- 5.82%
- DSCR
- 1.26
- GRM
- 8.6
CMA / ARV
- ARV (median comp)
- $177,062
- List price
- $179,900
- Delta
- 1.60%
- Verdict
- FAIR
- Comps
- 20 within 1.0 mi
Show comp detail 12 sales within ~0.75 mi
| Address | Dist | Beds/Ba | Sqft | Sold | Price | $/sf | Match |
|---|---|---|---|---|---|---|---|
| 2105 Briar Gate Dr | 0.29mi | 4/2.0 | 1,620 (+8%) | 0mo | $189,000 | $117 | 72 |
| 6828 Wampold Ct | 0.12mi | 4/2.0 | 1,696 (+13%) | 4mo | $129,000 | $76 | 69 |
| 2209 Briar Gate Dr | 0.03mi | 3/2.5 (-1) | 1,701 (+14%) | 4mo | $215,000 | $126 | 66 |
| 6736 Patti Ct | 0.22mi | 3/2.0 (-1) | 1,355 (-10%) | 3mo | $143,500 | $106 | 66 |
| 2201 Edinburgh Dr | 0.10mi | 3/2.0 (-1) | 1,674 (+12%) | 6mo | $170,000 | $102 | 65 |
| 3140 Knotts Dr | 0.72mi | 3/2.0 (-1) | 1,486 (-1%) | 3mo | $279,900 | $188 | 57 |
| 2420 Haddington Rd | 0.38mi | 4/2.0 | 1,684 (+12%) | 8mo | $125,000 | $74 | 55 |
| 3204 Knotts Dr | 0.74mi | 3/2.0 (-1) | 1,486 (-1%) | 7mo | $294,900 | $198 | 53 |
| 7905 Millstone Ct | 0.41mi | 3/2.0 (-1) | 1,672 (+12%) | 5mo | $199,000 | $119 | 52 |
| 2330 Sansone Rd | 0.35mi | 3/2.0 (-1) | 1,721 (+15%) | 6mo | $205,000 | $119 | 49 |
| 6605 E Aberdeen Dr | 0.40mi | 3/2.0 (-1) | 1,694 (+13%) | 8mo | $180,000 | $106 | 48 |
| 4057 Albion Dr | 0.72mi | 4/2.0 | 1,668 (+11%) | 2mo | $261,000 | $156 | 46 |
Match score weights: distance 35% · size 25% · config 20% · recency 20%. Top-matched comps best support the ARV.
Projected returns pro-forma
-3.0% appreciation · 5.65% rent growth · sell at horizon
- IRR
- -4.6%
- Equity multiple
- 0.82×
- Total profit
- $-8,833
- Equity at exit
- $26,824
- IRR
- 7.8%
- Equity multiple
- 1.65×
- Total profit
- $32,951
- Equity at exit
- $15,554
Cash invested: $50,372 (down + closing). Projections, not guarantees.
Landlord ↔ Tenant lean methodology
- Overall (STATE)
- 90 Strongly Landlord-Friendly
- State Alabama
- 90 Strongly Landlord-Friendly · R+15
- County
- — inherits STATE
- City
- — inherits STATE
ZIP-level market 36116
- Home prices YoY
- -9.7%
- Rents YoY
- 5.7%
- Active inventory
- 293
- Price-to-rent
- 8.6×
Monthly cashflow live
- Estimated rent
- $1,750 high interval (Pro) →
- Mortgage (P&I)
- −$943
- Tax from tax record
- −$120 /mo · $1,438/yr
- Insurance
- −$75
- HOA
- −$0
- Vacancy / Maint / Mgmt
- −$368
- Net cashflow
- $244
Break-even live
UW: 25.0% down · 7.5% · 30yr · 1.5% tax · 5.0% vac · 8.0% maint · 8.0% mgmt
Financing live
Cash to close
- Down payment
- $44,975
- Closing costs
- $5,397
- Reserves months
- —
- Total cash needed
- —
Loan-product check · same deal, 3 products live
Conventional
25% down · 7.5% · 30yr
- Down + closing
- —
- Monthly P&I
- —
- Monthly cashflow
- —
- DSCR
- —
- Eligible?
- —
Personal DTI + credit; lowest rate.
DSCR
20% down · 8.5% · 30yr
- Down + closing
- —
- Monthly P&I
- —
- Monthly cashflow
- —
- DSCR
- —
- Eligible?
- —
No personal income docs; deal must DSCR.
Hard money
10% down · 12.0% · 12mo
- Down + closing
- —
- Monthly P&I
- —
- Monthly cashflow
- —
- DSCR
- —
- Eligible?
- —
Short-term bridge; refi at stabilization.
Rent comps 15 comps
| Address | Beds | Baths | Sqft | Rent | $/sqft | DOM | Units | Dist |
|---|---|---|---|---|---|---|---|---|
| 2420 Haddington Rd Unit 1519890P Montgomery, AL | 4.0 | 1.0 | 1679 | $4,483 | $2.67 | 13d | 1 | 0.40mi |
| 3201 Watchman Dr Montgomery, AL | 1.0–3.0 | 1.0–2.0 | 1054 | $1,644 | $1.56 | 13d | 10 | 0.54mi |
| 7104 Fair Oaks Ct Montgomery, AL | 3.0 | 2.0 | 1656 | $1,881 | $1.14 | 43d | 1 | 0.64mi |
| 7406 Mill Ridge Ct Montgomery, AL | 3.0 | 2.0 | 1785 | $2,250 | $1.26 | 44d | 1 | 0.83mi |
| 2066 Rexford Rd Montgomery, AL | 3.0 | 2.5 | 1632 | $1,250 | $0.77 | 21d | 1 | 1.07mi |
| 2060 Rexford Rd Montgomery, AL | 3.0 | 2.5 | 1566 | $925 | $0.59 | 21d | 1 | 1.08mi |
| 1944 Woodrun Dr Montgomery, AL | 3.0 | 2.0 | 1689 | $1,595 | $0.94 | 13d | 1 | 1.08mi |
| 2014 Rexford Rd Montgomery, AL | 3.0 | 2.0 | 1596 | $1,150 | $0.72 | 43d | 1 | 1.14mi |
| 7701 Taylor Oaks Cir Montgomery, AL | 1.0–3.0 | 1.0–2.0 | 1047 | $1,712 | $1.63 | 13d | 22 | 1.24mi |
| 5635 Red Barn Rd Unit 1043848P Montgomery, AL | 3.0 | 2.0 | 1496 | $3,390 | $2.27 | 13d | 1 | 1.34mi |
| 6025 Oldcastle Pl Montgomery, AL | 3.0 | 2.0 | 1350 | $1,775 | $1.31 | 43d | 1 | 1.37mi |
| 1615 Woodmere Loop Montgomery, AL | 3.0 | 2.0 | 1212 | $1,250 | $1.03 | 43d | 1 | 1.39mi |
| 1612 Woodmere Loop Montgomery, AL | 3.0 | 1.5 | 1425 | $1,775 | $1.25 | 43d | 1 | 1.43mi |
| 1610 Limestone Ct Montgomery, AL | 3.0 | 2.5 | 1218 | $1,300 | $1.07 | 21d | 1 | 1.45mi |
| 2495 Meadow Ridge Ln Montgomery, AL | 1.0–3.0 | 1.0–2.0 | 1205 | $1,199 | $1.00 | 13d | 14 | 1.46mi |
Listing history 21 events
-
2026-06-18days on market $179,900 Active 130 DOM
-
2026-06-17days on market $179,900 Active 129 DOM
-
2026-06-16days on market $179,900 Active 128 DOM
-
2026-06-15days on market $179,900 Active 127 DOM
-
2026-06-14days on market $179,900 Active 125 DOM
-
2026-06-13days on market $179,900 Active 124 DOM
-
2026-06-10days on market $179,900 Active 122 DOM
-
2026-06-09days on market $179,900 Active 121 DOM
-
2026-06-08days on market $179,900 Active 120 DOM
-
2026-06-07days on market $179,900 Active 119 DOM
-
2026-06-03days on market $179,900 Active 115 DOM
-
2026-06-02days on market $179,900 Active 114 DOM
-
2026-06-01days on market $179,900 Active 113 DOM
-
2026-05-31days on market $179,900 Active 112 DOM
-
2026-05-30days on market $179,900 Active 111 DOM
-
2026-04-01price $184,000
-
2026-01-24$189,900 Active
-
2025-06-30soldstatus $110,000
-
2024-12-03$145,000 Active
-
2001-09-05soldstatus $65,230
-
2001-03-29$86,000
ⓘ Source: listings_history table (triggers on properties + properties_extension) + one-shot
backfill from property_details.listing_events for pre-trigger history.
Tax reassessment forecast AL · Resets to sale price
- Current annual tax
- $1,438 · $120/mo
- Projected year-2 tax
- $1,438 · $120/mo
- Expected delta
- $0/yr ($0/mo · 0.0%)
ⓘ Screening estimate from a state-policy table — verify with the county assessor before closing.
Climate risk First Street
- Flood 1/10 Low FEMA zone X (unshaded) · 0% chance over 30 yrs
- Wildfire 3/10 Moderate
- Heat 8/10 Severe 7 d/yr ≥108°F today · 20 d/yr by 30 yrs out
- Wind 8/10 Severe 80% chance of damaging wind over 30 yrs
- Air quality 2/10 Low 1 unhealthy d/yr today · 3 by 30 yrs out
Nearby sold comps map
Loading sold comps map…
Walkable amenities ~0.75 mi
Loading nearby amenities…
Taxation est. · year 1
- Rental income
- $21,001
- − Mortgage interest
- −$10,077
- − Property taxes
- −$1,438
- − Insurance
- −$900
- − Repairs & maintenance
- −$1,680
- − Management
- −$1,680
- − Depreciation
- −$5,233
- Taxable loss
- −$7
- Est. tax savings @ 24.0%
- +$2
- After-tax cash flow
- $2,935/yr
For passive investors: Depreciation is non-cash, so a rental often shows a tax loss while cash-flowing — sheltering income. Rental losses are passive: they offset passive income freely, and up to $25,000/yr can offset ordinary (W-2) income if you actively participate and your MAGI is under $100k (phasing out to $0 by $150k); unused losses carry forward. On sale, claimed depreciation is recaptured at up to 25%, and gains may owe capital-gains tax (a 1031 exchange can defer both). Figures are a year-1 estimate at your 24.0% rate — not tax advice; consult a CPA.
Schools (NCES district)
- District
- Montgomery County
- NCES district ID
- 0102430
- Math proficiency
- 9% ▼ -21.00%
- Reading proficiency
- 31% ▼ -1.00%
- Median HH income
- $43,902
- Composite
- 17.24/100
- National rank
- #9093
- State rank
- #106 of 129 in AL
Livability — Montgomery
- Score
- 65/100
- State rank
- #138
- US rank
- #13416
Category grades
Schools grade is shown separately in the Schools card above.
Census & demographics
- Census place
- Montgomery, AL
- County
- Montgomery County · 190,016 people
- City population
- 175,913
- Metro
- Montgomery, AL
- Population (ZIP)
- 45,250
- Household income
- $55,160
- Rent vs Own
- Severe rent burden
- 2786.0
Population outlook (Montgomery County) Hauer SSP2
- Today (2025)
- 224,008 people
- By 2030
- 221,460 · -1.1%
- By 2040
- 214,179 · -4.4%
- By 2050
- 204,912 · -8.5%
- By 2075
- 177,821 · -20.6%
- By 2100
- 145,134 · -35.2%
Race, ethnicity, and origin ACS 2023
- Neighborhood character
- Predominantly Black (80%)
- Race & ethnicity
- Black 80% White 12% Two or more races 4% Asian 3% Hispanic / Latino 2%
- Common ancestry
- Italian 1%
- Foreign-born
- 5% · Canada, South Korea
- Languages at home
- 94% English-only · Spanish 2% Other Indo-European 1% Korean 1%
Political lean MEDSL · Montgomery
- 2024 margin
- Solid D (+30.7) · D 64.8% · R 34.1% · Other 1.1%
- 2008→2024 swing
- +11.5pp toward D · 2008: 19.2pp · 2024: 30.7pp
- All cycles
- 2024: D+30.7 2020: D+31.5 2016: D+26.2 2012: D+24.3 2008: D+19.2
Not yet ingested
- Civics
- —
Market trends
- HPI YoY
- ▼ -16.31%
- Current HPI
- 151.8598
- Rent YoY
- ▲ 5.65%
- Metro
- Montgomery, AL
- State GDP YoY
- ▲ 2.94%
- F500 in state
- 4
Industry mix (Fortune 500 HQ in AL)
| Industry | F500 HQs | Revenue |
|---|---|---|
| Financial Services | 1 | $8B |
|
||
| Healthcare | 1 | $5B |
|
||
Price history
+114.0% since first listed6 events — show timeline
- 2026-04-01 Price Changed $184,000 MAAR
- 2026-01-24 Listed $189,900 MAAR
- 2025-06-30 Sold (Public Records) $110,000 Public Records
- 2024-12-03 Listed $145,000 MAAR
- 2001-09-05 Sold (MLS) $65,230 MAAR
- 2001-03-29 Listed $86,000 MAAR
Property tax history
+6.7%/yrLatest (2025): $1,438 · +1.9% YoY. Source: county tax records.
Cash-flow waterfall
monthlySold comps — $/sqft
last 12 mo · ≤1 miLoading sold comps…