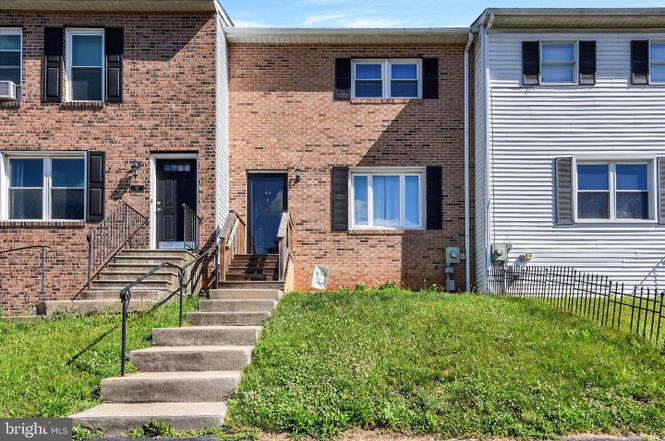
44 Rose Of Sharon Dr · Newberry, PA
Flood risk 1/10 · Minimal
- FEMA flood zone
- X (unshaded)
- Chance of flooding over 30 yrs
- 0.0%
- Est. flood insurance / yr
- $473 – $860
Fire risk 3/10 · Minor
- Est. fire insurance / yr
- $511 – $949
Heat risk 6/10 · Moderate
- Hot days now (above 100°F)
- 7 days/yr
- Hot days in 30 yrs
- 16 days/yr
Wind risk 3/10 · Minor
- Chance of severe wind over 30 yrs
- 7.0%
Air-quality risk 3/10 · Minor
- Unhealthy air days now
- 3 days/yr
- Unhealthy air days in 30 yrs
- 5 days/yr
Risk factors via First Street. Map © Google.
Why this score? — see what drove the B- grade
The composite is a weighted blend of 9 inputs, each scored 0–100. Each bar is that input's sub-score; the figure is the points it added to the 100-point composite (weight × sub-score).
- Cash flow +27.6/30.0
- ARV discount +10.1/15.0
- DSCR +9.7/10.0
- 1% rule +7.6/10.0
- Schools +4.1/10.0
- Rent growth +2.5/5.0
- Livability +2.5/5.0
- Condition / age +2.5/5.0
- Appreciation +0.0/10.0
$190,000
🖨 Deal sheet 📄 Offer letter ✓ Due diligence
Listing remarks MLS
Why RENT when you can OWN? 2 BR 1.5 BA Brick Townhome ready for you with NEW flooring in main rooms. Enjoy the seasons on your Updated Deck! Central Air Conditioning! Laundry in Basement. Walk-out Lower Level ready for you to finish. Easy Access to both York and Harrisburg. Community amenities include a pool (for a small fee), walking trails, tennis courts, clubhouse, basketball, & a playground for the kids.
Key facts
- Walkout basement
- Hoa includes pool
- Vinyl plank flooring
Tags
Property features AI
Finance
- Other: Above-grade finished area about 1,200 (assessor); Finished below-grade area about 600 (assessor); Total below-grade area reported as 600; Living area source: Assessor; Year built source: Assessor
- HOA & community: Monthly HOA fee (approximately $46.35) that includes pool access; Community amenities: outdoor pool, clubhouse, basketball courts, dog park
Exterior
- Parking: Parking lot with 2 spaces; Total of 2 garage/parking spaces
- Utilities: Public water; Public sewer; Electric service
- Home design: Interior townhouse/rowhouse; Fee simple ownership
- Construction: Vinyl siding; Block foundation
- Exterior features: Not in a federal flood zone
Interior
- Kitchen: Kitchen
- Bedrooms: Two bedrooms on the upper level
- Bathrooms: One full bathroom on the upper level; One half bathroom on the main level
- Heating & cooling: Heat pump heating; Central air conditioning; Electric heating and cooling systems; Electric hot water
- Interior features: Living room; Dining room; Walkout basement
- Laundry & utility: Laundry in the basement
Neighborhood map
What this means for you Summary
Snapshot
- This is a 2-bed/1.5-bath townhouse listed at $190k.
Deal economics
- At list price, monthly cash flow is $566 ($7k/yr) — positive.
- The deal already cash-flows at list — no discount required.
- Meets the 1% rule at list price ($2k rent vs $190k).
Location & tenants
- Location reads: area grade B — affects rentability + tenant quality, not the cash-flow math above.
- West Shore SD (suburban): math 37% / reading 56% proficiency, ranked #222 of 539 in PA (top 41%) — families likely to look elsewhere, expect single-tenant / working-renter base with shorter leases.
- Market conditions: 45 active listings in the ZIP; 1 comparable units currently listed for rent nearby; 1,328 units permitted in York County in 2024 (338 in 5+ unit buildings).
Forward outlook
- Local home prices are declining (-3.0%/yr); year-one equity from $1k of loan paydown is wiped out by about $6k of value loss. Plan a longer hold.
- At projected returns (-3.0% appreciation + 3.0% rent growth), your $53k cash investment doubles in ~9 years — after that, you're playing with house money.
Negotiation context
- Only 1 days on market — expect competitive offers; lowballing is unlikely to land.
- 3 sale attempts since 20y ago; this cycle's ask is 27% above the opening price — seller raised mid-cycle; expect resistance to lowballs.
- Current owner paid $160k; 19% above their basis — modest negotiation headroom, anchor on the comps not their cost.
Risks & watch-outs
- Climate carrying-cost: extreme-heat days projected 7→16/yr by 2055 (HVAC capex compounding) — expect insurance premiums to compound above CPI over the hold.
Questions for the listing agent
- What does the HOA fee cover, when was the last increase, and are there any pending special assessments or reserve-fund shortfalls?
- Is there a deadline driving the sale (1031 exchange, divorce, estate, relocation)? That informs how much negotiation room exists.
- What's the average days-on-market for RENTAL listings here right now (not sales)? A rising rental-DOM trend means longer vacancies and softer asking-rent achievability than the comps imply.
- What's the recent tenant-quality profile in this submarket — average credit score on applications, eviction rate, late-payment / NSF rate, and stable-employment percentage? A property-management company in the area should have these aggregated.
- How much new for-sale + rental construction is in the pipeline within 1–3 miles? Heavy new supply typically softens prices + rents 12–24 months out; constrained supply supports both.
Investment metrics
- 1% rule
- 1.26% ✓
- Cap rate
- 9.87%
- Cash-on-cash
- 12.77%
- DSCR
- 1.57
- GRM
- 6.6
CMA / ARV
- ARV (on-the-fly)
- $201,600
- Comps found
- 10
Show comp detail 10 sales within ~0.75 mi
| Address | Dist | Beds/Ba | Sqft | Sold | Price | $/sf | Match |
|---|---|---|---|---|---|---|---|
| 51 N Conley Ln | 0.16mi | 2/1.5 | 1,800 (0%) | 12mo | $210,000 | $117 | 82 |
| 12 Bill Dugan Dr | 0.17mi | 3/1.5 (+1) | 1,770 (-2%) | 4mo | $191,500 | $108 | 81 |
| 73 Rose Of Sharon Dr | 0.05mi | 3/1.5 (+1) | 1,700 (-6%) | 7mo | $175,000 | $103 | 78 |
| 10 Rose Of Sharon Dr | 0.05mi | 3/1.5 (+1) | 1,800 (0%) | 18mo | $195,000 | $108 | 77 |
| 184 White Dogwood Dr | 0.09mi | 2/1.5 | 1,716 (-5%) | 15mo | $201,000 | $117 | 75 |
| 214 White Dogwood Dr | 0.13mi | 2/2.5 | 1,800 (0%) | 19mo | $195,799 | $109 | 74 |
| 21 N Conley Ln | 0.16mi | 2/1.5 | 1,650 (-8%) | 9mo | $212,000 | $128 | 71 |
| 87 Persian Lilac Dr | 0.09mi | 2/1.5 | 1,700 (-6%) | 21mo | $174,900 | $103 | 69 |
| 17 Mall Rd | 0.22mi | 2/1.5 | 1,600 (-11%) | 6mo | $203,000 | $127 | 66 |
| 39 Mall Rd | 0.25mi | 3/1.5 (+1) | 1,700 (-6%) | 18mo | $190,000 | $112 | 58 |
Match score weights: distance 35% · size 25% · config 20% · recency 20%. Top-matched comps best support the ARV.
Projected returns pro-forma
-3.0% appreciation · 3.0% rent growth · sell at horizon
- IRR
- 2.6%
- Equity multiple
- 1.10×
- Total profit
- $5,320
- Equity at exit
- $28,330
- IRR
- 12.2%
- Equity multiple
- 1.96×
- Total profit
- $51,256
- Equity at exit
- $16,428
Cash invested: $53,200 (down + closing). Projections, not guarantees.
Landlord ↔ Tenant lean methodology
- Overall (STATE)
- 62 Landlord-Friendly
- State Pennsylvania
- 62 Landlord-Friendly · EVEN
- County
- — inherits STATE
- City
- — inherits STATE
ZIP-level market 17319
- Home prices YoY
- -20.2%
- Active inventory
- 45
- Price-to-rent
- 6.6×
Monthly cashflow live
- Estimated rent
- $2,400 medium interval (Pro) →
- Mortgage (P&I)
- −$996
- Tax from tax record
- −$208 /mo · $2,499/yr
- Insurance
- −$79
- HOA
- −$46
- Vacancy / Maint / Mgmt
- −$504
- Net cashflow
- $566
Break-even live
UW: 25.0% down · 7.5% · 30yr · 1.5% tax · 5.0% vac · 8.0% maint · 8.0% mgmt
Financing live
Cash to close
- Down payment
- $47,500
- Closing costs
- $5,700
- Reserves months
- —
- Total cash needed
- —
Loan-product check · same deal, 3 products live
Conventional
25% down · 7.5% · 30yr
- Down + closing
- —
- Monthly P&I
- —
- Monthly cashflow
- —
- DSCR
- —
- Eligible?
- —
Personal DTI + credit; lowest rate.
DSCR
20% down · 8.5% · 30yr
- Down + closing
- —
- Monthly P&I
- —
- Monthly cashflow
- —
- DSCR
- —
- Eligible?
- —
No personal income docs; deal must DSCR.
Hard money
10% down · 12.0% · 12mo
- Down + closing
- —
- Monthly P&I
- —
- Monthly cashflow
- —
- DSCR
- —
- Eligible?
- —
Short-term bridge; refi at stabilization.
Rent comps 1 comps
| Address | Beds | Baths | Sqft | Rent | $/sqft | DOM | Units | Dist |
|---|---|---|---|---|---|---|---|---|
| 131 Scully Pl Lewisberry, PA | 3.0 | 2.5 | 2324 | $2,400 | $1.03 | 43d | 1 | 1.43mi |
HOA detail
- Monthly dues
- $46 · $552/yr
- Likely covers
- pool
Listing history 4 events
-
2026-06-19statusdays on market $190,000 Active 1 DOM
-
2026-06-18days on market $190,000 Coming Soon 2 DOM
-
2026-06-16remarks 450-char remark
-
2026-06-16$190,000 Coming Soon 1 DOM
ⓘ Source: listings_history table (triggers on properties + properties_extension) + one-shot
backfill from property_details.listing_events for pre-trigger history.
Tax reassessment forecast PA · Partial reset (capped growth)
- Current annual tax
- $2,499 · $208/mo
- Projected year-2 tax
- $2,751 · $229/mo
- Expected delta
- +$251/yr (+$21/mo · 10.1%)
ⓘ Screening estimate from a state-policy table — verify with the county assessor before closing.
Climate risk First Street
- Flood 1/10 Low FEMA zone X (unshaded) · 0% chance over 30 yrs
- Wildfire 3/10 Moderate
- Heat 6/10 Major 7 d/yr ≥100°F today · 16 d/yr by 30 yrs out
- Wind 3/10 Moderate 7% chance of damaging wind over 30 yrs
- Air quality 3/10 Moderate 3 unhealthy d/yr today · 5 by 30 yrs out
Nearby sold comps map
Loading sold comps map…
Walkable amenities ~0.75 mi
Loading nearby amenities…
Taxation est. · year 1
- Rental income
- $28,800
- − Mortgage interest
- −$10,643
- − Property taxes
- −$2,499
- − Insurance
- −$950
- − Repairs & maintenance
- −$2,304
- − Management
- −$2,304
- − HOA
- −$552
- − Depreciation
- −$5,527
- Taxable income
- $4,021
- Est. tax owed @ 24.0%
- −$965
- After-tax cash flow
- $5,829/yr
For passive investors: Depreciation is non-cash, so a rental often shows a tax loss while cash-flowing — sheltering income. Rental losses are passive: they offset passive income freely, and up to $25,000/yr can offset ordinary (W-2) income if you actively participate and your MAGI is under $100k (phasing out to $0 by $150k); unused losses carry forward. On sale, claimed depreciation is recaptured at up to 25%, and gains may owe capital-gains tax (a 1031 exchange can defer both). Figures are a year-1 estimate at your 24.0% rate — not tax advice; consult a CPA.
Schools (NCES district)
- District
- West Shore SD
- NCES district ID
- 4225830
- Math proficiency
- 37% ▼ -12.00%
- Reading proficiency
- 56% ▼ -10.00%
- Median HH income
- $61,398
- Composite
- 40.9/100
- National rank
- #3617
- State rank
- #222 of 539 in PA
Livability — Newberry
No livability data for this city. (Only ~50 U.S. cities are tracked.)
Census & demographics
- Census place
- Valley Green, PA
- Population (ZIP)
- 10,990
Population outlook (York County) Hauer SSP2
- Today (2025)
- 454,205 people
- By 2030
- 457,407 · +0.7%
- By 2040
- 457,529 · +0.7%
- By 2050
- 448,261 · -1.3%
- By 2075
- 427,388 · -5.9%
- By 2100
- 384,218 · -15.4%
Race, ethnicity, and origin ACS 2023
- Neighborhood character
- Predominantly White (94%)
- Race & ethnicity
- White 94% Two or more races 3% Hispanic / Latino 2%
- Common ancestry
- Romanian 6% Polish 5% Lithuanian 2%
- Foreign-born
- 1% · Canada
- Languages at home
- 98% English-only · Spanish 1%
Political lean MEDSL · York
- 2024 margin
- Strong R (+25.3) · D 36.9% · R 62.1%
- 2008→2024 swing
- -11.7pp toward R · 2008: -13.6pp · 2024: -25.3pp
- All cycles
- 2024: R+25.3 2020: R+24.6 2016: R+29.3 2012: R+21.2 2008: R+13.6
Not yet ingested
- Civics
- —
Market trends
- HPI YoY
- ▼ -68.02%
- Current HPI
- 268.9557
- Rent YoY
- —
- Metro
- —
- State GDP YoY
- ▲ 1.68%
- F500 in state
- 34
Industry mix (Fortune 500 HQ in PA)
| Industry | F500 HQs | Revenue |
|---|---|---|
| Healthcare | 2 | $309B |
|
||
| Insurance | 2 | $27B |
|
||
| Telecommunications / Media | 1 | $124B |
|
||
| Industrial Distribution | 1 | $22B |
|
||
| Financial Services | 1 | $20B |
|
||
| Chemicals / Materials | 1 | $18B |
|
||
Price history
+271.5% since first listed13 events — show timeline
- 2026-06-16 Coming Soon $190,000 BRIGHT MLS
- 2022-07-28 Sold (Public Records) $160,000 Public Records
- 2022-07-22 Sold (MLS) $160,000 BRIGHT MLS
- 2022-06-17 Pending — BRIGHT MLS
- 2022-06-14 Listed $149,900 BRIGHT MLS
- 2015-09-18 Sold (Public Records) $93,000 Public Records
- 2015-09-11 Sold (MLS) $93,000 BRIGHT MLS
- 2015-07-02 Listing Removed — BRIGHT MLS
- 2015-05-01 Listed $92,500 BRIGHT MLS
- 2006-09-25 Sold (Public Records) $109,000 Public Records
- 2006-09-15 Sold (MLS) $109,000 BRIGHT MLS
- 2006-06-07 Listed $104,000 BRIGHT MLS
- 1986-02-12 Sold (Public Records) $51,150 Public Records
Property tax history
+3.7%/yrLatest (2026): $2,499 · +5.7% YoY. Source: county tax records.
Cash-flow waterfall
monthlySold comps — $/sqft
last 12 mo · ≤1 miLoading sold comps…