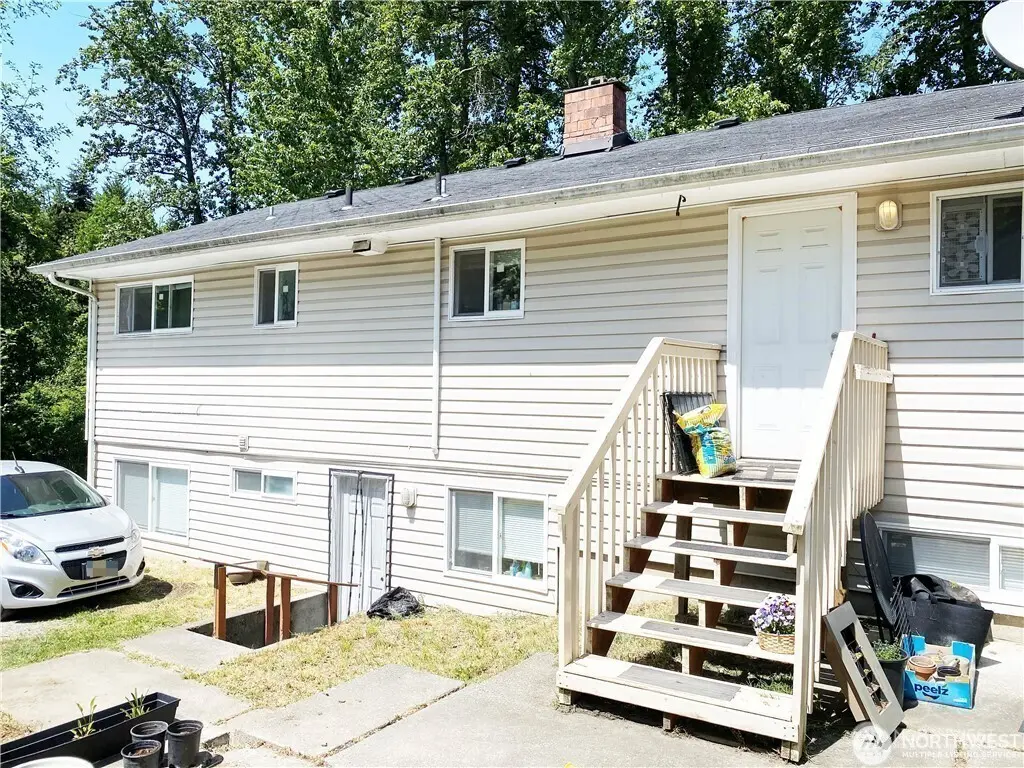
 Duplex
2413 SW Graham St · Seattle, WA
Flood risk 6/10 · Moderate
- FEMA flood zone
- X (unshaded)
- Chance of flooding over 30 yrs
- 0.75%
- Est. flood insurance / yr
- $473 – $860
Fire risk 1/10 · Minimal
- Est. fire insurance / yr
- $604 – $1,122
Heat risk 3/10 · Minor
- Hot days now (above 86°F)
- 7 days/yr
- Hot days in 30 yrs
- 14 days/yr
Wind risk 1/10 · Minimal
- Chance of severe wind over 30 yrs
- —
Air-quality risk 6/10 · Moderate
- Unhealthy air days now
- 8 days/yr
- Unhealthy air days in 30 yrs
- 9 days/yr
Risk factors via First Street. Map © Google.
Why this score? — see what drove the D grade
The composite is a weighted blend of 9 inputs, each scored 0–100. Each bar is that input's sub-score; the figure is the points it added to the 100-point composite (weight × sub-score).
- Cash flow +13.4/30.0
- ARV discount +8.2/15.0
- Schools +6.1/10.0
- DSCR +4.0/10.0
- Livability +3.8/5.0
- 1% rule +3.2/10.0
- Rent growth +2.5/5.0
- Condition / age +2.5/5.0
- Appreciation +0.0/10.0
$715,000
🖨 Deal sheet (PDF) 📄 Offer letter ✓ Due diligence
Multi-family units
County records classify this as Multi-Family (2-4 Unit). Listing-text estimate: 2 units. confirmed
Listing remarks
Great investment opportunity in quickly developing West Seattle. This duplex features 4 bedroom 1 bath (1,200 sq ft) upper unit and 3 bedroom 1 bath (1,200 sq ft) lower unit. Solid rental history and occupied, with total monthly income $4727. Updated lower unit with newer flooring, paint, and windows. Many newer appliances: Upper unit - water heater, dryer, range. Lower unit - refrigerator, dryer, washer, and range. Located on a quiet dead-end street, just steps from green space with walking trail, bus stops, and Boren STEM K-8 school.
Key facts
- Newer flooring
- Newer appliances
- Newer windows
Tags
Neighborhood map
What this means for you Summary
Snapshot
- This is a 1×4bd/1.0ba + 1×3bd/1.0ba units multifamily listed at $715k.
Deal economics
- At list price, monthly cash flow is $8 ($96/yr) — positive. Per door: $4/mo.
- The deal already cash-flows at list — no discount required.
- To meet the 1% rule (rent ≥ 1% of price), the offer needs to be $586k (18.0% below list).
- Recommended offer: $586k (18.0% below list) — sets the bar for 1% rule.
- Cap rate 6.3% vs local median 1.6% in Seattle — top-decile yield for the area; either an underpriced asset or a hidden risk that comps aren't pricing in. Stress-test before assuming the spread holds.
Location & tenants
- Location reads 75/100 on livability (#166 in WA, #4,033 nationally) — a middle-class / working-renter tenant base. Strengths: amenities A+, commute A+, employment A+; Watch: crime F, cost of living F.
- Seattle Public Schools (urban): math 64% / reading 72% proficiency, ranked #19 of 291 in WA (top 6%) — acceptable for families but not a draw, mixed tenant base, ~2y average lease.
- Zoned schools: Sanislo Elementary School (173 students, 65% FRL); Madison Middle School (981 students, 20% FRL); Chief Sealth International High School (1,289 students, 63% FRL) — zoned schools average 49% FRL vs 30% district-wide (19 pts higher); higher-poverty schools than district average — tighter screening recommended.
- Market conditions: Rents soft (-0.2%/yr); 155 active listings in the ZIP; high-income renter base; 10,555 units permitted in King County in 2024 (7,119 in 5+ unit buildings).
- At $5,865/mo this rent would consume 57% of the median local household income ($124k/yr) (locally 1460% of renters already pay >50% of income on rent) — very limited rent-growth headroom before tenants either downsize or default.
Forward outlook
- Local home prices are declining (-3.0%/yr); year-one equity from $5k of loan paydown is wiped out by about $21k of value loss. Plan a longer hold.
- King County population projected at +44% by 2050 — long-run rental-demand tailwind backs the buy-and-hold thesis.
Negotiation context
- It's been on market 187 days — a 12% lower offer ($629k) is reasonable based on typical stale-listing flexibility.
- 4 sale attempts since 21y ago with the ask held roughly flat each time — persistent listings suggest the price (not the market) is what's stuck; bring a comps-based counter.
- Current owner paid $550k; 30% above their basis — modest negotiation headroom, anchor on the comps not their cost.
Risks & watch-outs
- Watch-outs: built in 1943 — expect roof / HVAC / electrical / plumbing capex.
- Climate carrying-cost: major flood risk — expect insurance premiums to compound above CPI over the hold.
Questions for the listing agent
- It's been on market 187 days. Have you received any prior offers? Is the seller open to a 18% concession, seller financing, or rate buy-down credit?
- Can we see the unit-by-unit rent roll, current vacancy, and any below-market leases? What's the average tenancy length?
- What capital expenditures (roof, boiler, parking lot, exteriors) have been made in the last 5 years, and what's planned in the next 2?
- Built in 1943 — when were the roof, HVAC, electrical panel, plumbing, and water heater last replaced?
- Why hasn't it sold? Are there any deal-killer items the seller is aware of (foundation, flood, title, zoning, code violations)?
- Is there a deadline driving the sale (1031 exchange, divorce, estate, relocation)? That informs how much negotiation room exists.
- Schools are A-rated — typically a magnet for longer-tenancy family renters. What's the average tenant stay here, and is there a school-zone premium baked into asking?
- Crime grade is F in this area — have there been break-ins, vandalism, or insurance claims at this property in the last 3 years? What carrier currently insures it and at what premium?
- The area grade is low — what's the realistic commute time and amenity access for the typical tenant pool here? Any planned neighborhood developments (good or bad) we should know about?
- What's the average days-on-market for RENTAL listings here right now (not sales)? A rising rental-DOM trend means longer vacancies and softer asking-rent achievability than the comps imply.
- What's the recent tenant-quality profile in this submarket — average credit score on applications, eviction rate, late-payment / NSF rate, and stable-employment percentage? A property-management company in the area should have these aggregated.
- How much new apartment / multifamily construction is in the pipeline within 1–3 miles? Heavy new supply (>2% of stock underway) typically softens rents 12–24 months out; light construction supports rent growth.
Investment metrics
- 1% rule
- 0.82% ✗
- Cap rate
- 6.31%
- Cash-on-cash
- 0.05%
- DSCR
- 1.00
- GRM
- 10.2
CMA / ARV
- ARV (median comp)
- $725,720
- List price
- $715,000
- Delta
- -1.48%
- Verdict
- FAIR
- Comps
- 5 within 1.0 mi
Projected returns pro-forma
-3.0% appreciation · 0.0% rent growth · sell at horizon
- IRR
- -19.5%
- Equity multiple
- 0.34×
- Total profit
- $-132,646
- Equity at exit
- $106,609
- IRR
- -19.6%
- Equity multiple
- 0.09×
- Total profit
- $-181,706
- Equity at exit
- $61,820
Cash invested: $200,200 (down + closing). Projections, not guarantees.
Landlord ↔ Tenant lean methodology
- Overall (CITY)
- 0 Strongly Tenant-Friendly
- State Washington
- 28 Tenant-Leaning · D+8
- County
- — inherits STATE
- City Seattle
- 0 Strongly Tenant-Friendly · D+52
ZIP-level market 98106
- Rents YoY
- -0.2%
- Active inventory
- 155
- Price-to-rent
- 18.7×
Monthly cashflow live
- Estimated rent
- $5,865 high interval (Pro) →
- Mortgage (P&I)
- −$3,750
- Tax from tax record
- −$578 /mo · $6,935/yr
- Insurance
- −$298
- HOA
- −$0
- Vacancy / Maint / Mgmt
- −$1,232
- Net cashflow
- $8
Break-even live
Sensitivity live
| Price | -10% $413 | -5% $210 | +0% $8 | +5% $-194 | +10% $-397 |
|---|---|---|---|---|---|
| Rent | -10% $-455 | -5% $-224 | +0% $8 | +5% $240 | +10% $471 |
| Rate | -1.0pp $368 | -0.5pp $190 | base $8 | +0.5pp $-177 | +1.0pp $-366 |
2-unit breakdown (identical units grouped — click to expand)
| Units | Beds | Baths | Est. rent |
|---|---|---|---|
| 1× unit | 4 | 1 | $3,180 |
| 1× unit | 3 | 1 | $2,685 |
| Total (2 units) | $5,865 | ||
UW: 25.0% down · 7.5% · 30yr · 1.5% tax · 5.0% vac · 8.0% maint · 8.0% mgmt
Financing live
Cash to close
- Down payment
- $178,750
- Closing costs
- $21,450
- Reserves months
- —
- Total cash needed
- —
Loan-product check · same deal, 3 products live
Conventional
25% down · 7.5% · 30yr
- Down + closing
- —
- Monthly P&I
- —
- Monthly cashflow
- —
- DSCR
- —
- Eligible?
- —
Personal DTI + credit; lowest rate.
DSCR
20% down · 8.5% · 30yr
- Down + closing
- —
- Monthly P&I
- —
- Monthly cashflow
- —
- DSCR
- —
- Eligible?
- —
No personal income docs; deal must DSCR.
Hard money
10% down · 12.0% · 12mo
- Down + closing
- —
- Monthly P&I
- —
- Monthly cashflow
- —
- DSCR
- —
- Eligible?
- —
Short-term bridge; refi at stabilization.
Listing history 37 events
-
2026-06-22days on market $715,000 Active 187 DOM
-
2026-06-21days on market $715,000 Active 186 DOM
-
2026-06-21days on market $715,000 Active 185 DOM
-
2026-06-19days on market $715,000 Active 184 DOM
-
2026-06-18days on market $715,000 Active 183 DOM
-
2026-06-17days on market $715,000 Active 182 DOM
-
2026-06-16days on market $715,000 Active 181 DOM
-
2026-06-15days on market $715,000 Active 180 DOM
-
2026-06-15days on market $715,000 Active 179 DOM
-
2026-06-13days on market $715,000 Active 178 DOM
-
2026-06-12days on market $715,000 Active 177 DOM
-
2026-06-10days on market $715,000 Active 175 DOM
-
2026-06-09days on market $715,000 Active 174 DOM
-
2026-06-08days on market $715,000 Active 173 DOM
-
2026-06-07days on market $715,000 Active 172 DOM
-
2026-06-07days on market $715,000 Active 171 DOM
-
2026-06-04days on market $715,000 Active 169 DOM
-
2026-06-03days on market $715,000 Active 168 DOM
-
2026-06-02days on market $715,000 Active 167 DOM
-
2026-06-01days on market $715,000 Active 166 DOM
-
2026-05-31days on market $715,000 Active 165 DOM
-
2026-04-15price $715,000
-
2026-02-22price $729,000
-
2026-01-15status Active
-
2025-12-03$745,000 Active
-
2017-12-29soldstatus $550,000
-
2010-04-01soldstatus $339,427
-
2005-08-25soldstatus $379,000
-
2005-08-25soldstatus $379,000 Closed
-
2005-08-25soldstatus $379,000
-
2005-07-22historical
-
2005-07-15$389,000
-
2005-07-15$389,000
-
1997-05-22soldstatus $136,100
-
1996-10-30soldstatus $118,846
-
1996-10-11soldstatus $118,846
-
1995-09-05soldstatus $154,000
ⓘ Source: listings_history table (triggers on properties + properties_extension) + one-shot
backfill from property_details.listing_events for pre-trigger history.
Tax reassessment forecast WA · Resets to sale price
- Current annual tax
- $6,935 · $578/mo
- Projected year-2 tax
- $7,007 · $584/mo
- Expected delta
- +$72/yr (+$6/mo · 1.0%)
ⓘ Screening estimate from a state-policy table — verify with the county assessor before closing.
Climate risk First Street
- Flood 6/10 Major FEMA zone X (unshaded) · 75% chance over 30 yrs
- Wildfire 1/10 Low
- Heat 3/10 Moderate 7 d/yr ≥86°F today · 14 d/yr by 30 yrs out
- Wind 1/10 Low
- Air quality 6/10 Major 8 unhealthy d/yr today · 9 by 30 yrs out
Nearby sold comps map
Loading sold comps map…
Walkable amenities ~0.75 mi
Loading nearby amenities…
Taxation est. · year 1
- Rental income
- $70,380
- − Mortgage interest
- −$40,051
- − Property taxes
- −$6,935
- − Insurance
- −$3,575
- − Repairs & maintenance
- −$5,630
- − Management
- −$5,630
- − Depreciation
- −$20,800
- Taxable loss
- −$12,242
- Est. tax savings @ 24.0%
- +$2,938
- After-tax cash flow
- $3,034/yr
For passive investors: Depreciation is non-cash, so a rental often shows a tax loss while cash-flowing — sheltering income. Rental losses are passive: they offset passive income freely, and up to $25,000/yr can offset ordinary (W-2) income if you actively participate and your MAGI is under $100k (phasing out to $0 by $150k); unused losses carry forward. On sale, claimed depreciation is recaptured at up to 25%, and gains may owe capital-gains tax (a 1031 exchange can defer both). Figures are a year-1 estimate at your 24.0% rate — not tax advice; consult a CPA.
Schools (NCES district)
- District
- Seattle Public Schools
- NCES district ID
- 5307710
- Math proficiency
- 64% ▼ -1.00%
- Reading proficiency
- 72% ▬ 0.00%
- Median HH income
- $68,695
- Composite
- 60.76/100
- National rank
- #1649
- State rank
- #19 of 291 in WA
Livability — Seattle
- Score
- 75/100
- State rank
- #166
- US rank
- #4033
Category grades
Schools grade is shown separately in the Schools card above.
Census & demographics
- Census place
- Seattle, WA
- County
- King County · 2,251,916 people
- City population
- 706,262
- Metro
- Seattle-Tacoma-Bellevue, WA
- Population (ZIP)
- 28,690
- Household income
- $124,212
- Rent vs Own
- Severe rent burden
- 1460.0
Population outlook (King County) Hauer SSP2
- Today (2025)
- 2,576,485 people
- By 2030
- 2,803,316 · +8.8%
- By 2040
- 3,255,921 · +26.4%
- By 2050
- 3,706,444 · +43.9%
- By 2075
- 4,746,063 · +84.2%
- By 2100
- 5,407,730 · +109.9%
Race, ethnicity, and origin ACS 2023
- Neighborhood character
- Highly diverse neighborhood (Simpson 0.75)
- Race & ethnicity
- White 43% Hispanic / Latino 16% Black 15% Two or more races 15% Asian 15% Pacific Islander 1%
- Hispanic origin (detail)
- Mexican 11%
- Common ancestry
- Portuguese 3% Slovak 3% Italian 2%
- Foreign-born
- 24% · Canada, Vietnam, China
- Languages at home
- 69% English-only · Spanish 9% Vietnamese 5% Tagalog/Filipino 4%
Political lean MEDSL · King
- 2024 margin
- Solid D (+51.7) · D 74.2% · R 22.5% · Other 3.4%
- 2008→2024 swing
- +9.6pp toward D · 2008: 42.1pp · 2024: 51.7pp
- All cycles
- 2024: D+51.7 2020: D+52.7 2016: D+50.4 2012: D+39.9 2008: D+42.1
Not yet ingested
- Civics
- —
Market trends
- HPI YoY
- ▼ -763.07%
- Current HPI
- 334.9356
- Rent YoY
- ▼ -0.20%
- Metro
- Seattle-Tacoma-Bellevue, WA
- State GDP YoY
- ▲ 4.65%
- F500 in state
- 22
Industry mix (Fortune 500 HQ in WA)
| Industry | F500 HQs | Revenue |
|---|---|---|
| Retail | 2 | $269B |
|
||
| Technology / Retail | 1 | $638B |
|
||
| Technology | 1 | $245B |
|
||
| Telecommunications | 1 | $38B |
|
||
| Food / Beverage | 1 | $36B |
|
||
| Automotive / Trucks | 1 | $34B |
|
||
Price history
+364.3% since first listed16 events — show timeline
- 2026-04-15 Price Changed $715,000 NWMLS as Distributed by MLS Grid
- 2026-02-22 Price Changed $729,000 NWMLS as Distributed by MLS Grid
- 2026-01-15 Relisted — NWMLS as Distributed by MLS Grid
- 2025-12-03 Listed $745,000 NWMLS as Distributed by MLS Grid
- 2017-12-29 Sold (Public Records) $550,000 Public Records
- 2010-04-01 Sold (Public Records) $339,427 Public Records
- 2005-08-25 Sold (Public Records) $379,000 Public Records
- 2005-08-25 Sold (MLS) $379,000 NWMLS as Distributed by MLS Grid
- 2005-08-25 Sold (MLS) $379,000 NWMLS as Distributed by MLS Grid
- 2005-07-22 Delisted — NWMLS as Distributed by MLS Grid
- 2005-07-15 Listed $389,000 NWMLS as Distributed by MLS Grid
- 2005-07-15 Listed $389,000 NWMLS as Distributed by MLS Grid
- 1997-05-22 Sold (Public Records) $136,100 Public Records
- 1996-10-30 Sold (Public Records) $118,846 Public Records
- 1996-10-11 Sold (Public Records) $118,846 Public Records
- 1995-09-05 Sold (Public Records) $154,000 Public Records
Property tax history
+5.6%/yrLatest (2025): $6,935 · +12.5% YoY. Source: county tax records.
Cash-flow waterfall
monthlySold comps — $/sqft
last 12 mo · ≤1 miLoading sold comps…