 Duplex
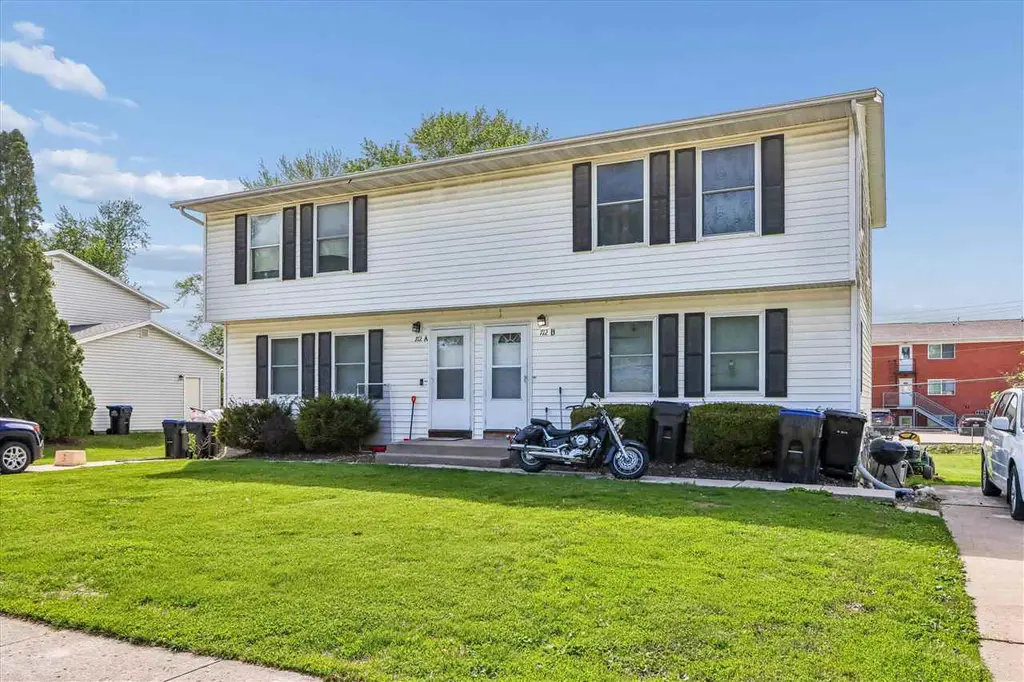
712 19th Ave Unit A & B · Coralville, IA
Flood risk 1/10 · Minimal
- FEMA flood zone
- X (unshaded)
- Chance of flooding over 30 yrs
- 0.0%
- Est. flood insurance / yr
- $473 – $860
Fire risk 4/10 · Minor
- Est. fire insurance / yr
- $902 – $1,676
Heat risk 3/10 · Minor
- Hot days now (above 106°F)
- 7 days/yr
- Hot days in 30 yrs
- 16 days/yr
Wind risk 2/10 · Minimal
- Chance of severe wind over 30 yrs
- —
Air-quality risk 2/10 · Minimal
- Unhealthy air days now
- 1 days/yr
- Unhealthy air days in 30 yrs
- 2 days/yr
Risk factors via First Street. Map © Google.
Why this score? — see what drove the C grade
The composite is a weighted blend of 9 inputs, each scored 0–100. Each bar is that input's sub-score; the figure is the points it added to the 100-point composite (weight × sub-score).
- Cash flow +18.7/30.0
- ARV discount +10.3/15.0
- DSCR +5.9/10.0
- Schools +5.7/10.0
- 1% rule +5.0/10.0
- Livability +4.5/5.0
- Rent growth +4.0/5.0
- Condition / age +2.8/5.0
- Appreciation +0.0/10.0
$319,900
🖨 Deal sheet 📄 Offer letter ✓ Due diligence
Multi-family units
County records classify this as Multi-Family (2-4 Unit). Listing-text estimate: 2 units. confirmed
Listing remarks
Fully leased duplex with excellent rental history. Large backyard. Convenient location close to shopping and parks. Accepted Offer, will continue to show for possible back up offers.
Key facts
- 0.32 acre lot
- 4 parking spots
- Built 1976
Property features AI
Finance
- Financial info: Several units listed with monthly rents of $1,050 (unit-type entries indicate rental income for specific units)
- HOA & community: Association fee paid annually
Exterior
- Parking: 4 parking spaces total; Off-street and on-street parking available
- Utilities: Public water; Public sewer
- Home design: Multi-family residential property; 2 stories
- Construction: Vinyl siding and frame construction; Slab foundation
- Exterior features: Level lot; Sidewalks; Street lights
Interior
- Kitchen: Dishwasher; Microwave
- Bedrooms: Units include living rooms; some units also include dining rooms
- Flooring: Carpet; Vinyl
- Bathrooms: Some units include a half bath; specified unit types list 1 full bathroom for two units
- Heating & cooling: Central air conditioning; Natural gas heating; Floor furnace
- Interior features: Dishwasher; Dryer; Microwave
- Laundry & utility: Main level laundry; Dryer
Neighborhood map
What this means for you Summary
Snapshot
- This is a 2 × 2-bed/1-bath units multifamily listed at $320k. Condition is rated average.
Deal economics
- At list price, monthly cash flow is $318 ($4k/yr) — positive. Per door: $159/mo.
- The deal already cash-flows at list — no discount required.
- Meets the 1% rule at list price ($3k rent vs $320k).
- Recommended offer: $310k (3.0% below list) — sets the bar for market timing.
- Cap rate 7.5% vs local median 2.1% in Coralville — top-decile yield for the area; either an underpriced asset or a hidden risk that comps aren't pricing in. Stress-test before assuming the spread holds.
Location & tenants
- Location reads 90/100 on livability (#5 in IA, #89 nationally) — a professional / high-income tenant draw. Strengths: commute A+, employment A+, housing A+; Watch: amenities C-.
- Iowa City Community School District (urban): math 65% / reading 70% proficiency, ranked #174 of 289 in IA (top 60%) — acceptable for families but not a draw, mixed tenant base, ~2y average lease.
- Zoned schools: Kirkwood Elementary School (math 27% / reading 37%, grade F, #601 of 616 statewide, top 98%, 269 students, 69% FRL); Northwest Junior High School (math 64% / reading 71%, grade A-, #133 of 246 statewide, top 56%, 730 students, 43% FRL); West Senior High School (math 71% / reading 77%, grade B+, #103 of 336 statewide, top 32%, 1,503 students, 38% FRL) — zoned schools average 50% FRL vs 30% district-wide (20 pts higher); higher-poverty schools than district average — tighter screening recommended.
- Market conditions: Rents rising fast (+6.1%/yr); 374 active listings in the ZIP; 714 units permitted in Johnson County in 2024 (158 in 5+ unit buildings).
- At $3,201/mo this rent would consume 55% of the median local household income ($69k/yr) (locally 1220% of renters already pay >50% of income on rent) — very limited rent-growth headroom before tenants either downsize or default.
Forward outlook
- Local home prices are declining (-3.0%/yr); year-one equity from $2k of loan paydown is wiped out by about $10k of value loss. Plan a longer hold.
- Johnson County population projected at +60% by 2050 — long-run rental-demand tailwind backs the buy-and-hold thesis.
Negotiation context
- It's been on market 32 days — a 3% lower offer ($310k) is reasonable based on typical stale-listing flexibility.
Questions for the listing agent
- It's been on market 32 days. Have you received any prior offers? Is the seller open to a 3% concession, seller financing, or rate buy-down credit?
- Can we see the unit-by-unit rent roll, current vacancy, and any below-market leases? What's the average tenancy length?
- What capital expenditures (roof, boiler, parking lot, exteriors) have been made in the last 5 years, and what's planned in the next 2?
- Built in 1976 — when were the roof, HVAC, electrical panel, plumbing, and water heater last replaced?
- Is there a deadline driving the sale (1031 exchange, divorce, estate, relocation)? That informs how much negotiation room exists.
- Schools are B-rated — typically a magnet for longer-tenancy family renters. What's the average tenant stay here, and is there a school-zone premium baked into asking?
- What's the average days-on-market for RENTAL listings here right now (not sales)? A rising rental-DOM trend means longer vacancies and softer asking-rent achievability than the comps imply.
- What's the recent tenant-quality profile in this submarket — average credit score on applications, eviction rate, late-payment / NSF rate, and stable-employment percentage? A property-management company in the area should have these aggregated.
- How much new apartment / multifamily construction is in the pipeline within 1–3 miles? Heavy new supply (>2% of stock underway) typically softens rents 12–24 months out; light construction supports rent growth.
Investment metrics
- 1% rule
- 1.00% ✓
- Cap rate
- 7.49%
- Cash-on-cash
- 4.26%
- DSCR
- 1.19
- GRM
- 8.3
CMA / ARV
- ARV (median comp)
- $341,185
- List price
- $319,900
- Delta
- -6.24%
- Verdict
- FAIR
- Comps
- 7 within 1.0 mi
Show comp detail 2 sales within ~0.75 mi
| Address | Dist | Beds/Ba | Sqft | Sold | Price | $/sf | Match |
|---|---|---|---|---|---|---|---|
| 2102-2103 10th St Pl | 0.42mi | —/2.0 | 3,072 (-8%) | 9mo | $275,000 | $90 | 52 |
| 965 Boston Way Unit 1-4 | 0.71mi | —/4.0 | 3,096 (-7%) | 20mo | $315,000 | $102 | 38 |
Match score weights: distance 35% · size 25% · config 20% · recency 20%. Top-matched comps best support the ARV.
Projected returns pro-forma
-3.0% appreciation · 6.14% rent growth · sell at horizon
- IRR
- -6.2%
- Equity multiple
- 0.76×
- Total profit
- $-21,103
- Equity at exit
- $47,698
- IRR
- 7.0%
- Equity multiple
- 1.60×
- Total profit
- $53,560
- Equity at exit
- $27,659
Cash invested: $89,572 (down + closing). Projections, not guarantees.
Landlord ↔ Tenant lean methodology
- Overall (STATE)
- 83 Strongly Landlord-Friendly
- State Iowa
- 83 Strongly Landlord-Friendly · R+6
- County
- — inherits STATE
- City
- — inherits STATE
ZIP-level market 52241
- Rents YoY
- 6.1%
- Active inventory
- 374
- Price-to-rent
- 16.7×
Monthly cashflow live
- Estimated rent
- $3,201 high interval (Pro) →
- Mortgage (P&I)
- −$1,678
- Tax est. 1.5%
- −$400 /mo · $4,798/yr
- Insurance
- −$133
- HOA
- −$0
- Vacancy / Maint / Mgmt
- −$672
- Net cashflow
- $318
Break-even live
2-unit breakdown (identical units grouped — click to expand)
| Units | Beds | Baths | Est. rent |
|---|---|---|---|
| 2× units | 2 | 1 | $3,200 |
| #1 | 2 | 1 | $1,600 |
| #2 | 2 | 1 | $1,600 |
| Total (2 units) | $3,201 | ||
UW: 25.0% down · 7.5% · 30yr · 1.5% tax · 5.0% vac · 8.0% maint · 8.0% mgmt
Financing live
Cash to close
- Down payment
- $79,975
- Closing costs
- $9,597
- Reserves months
- —
- Total cash needed
- —
Loan-product check · same deal, 3 products live
Conventional
25% down · 7.5% · 30yr
- Down + closing
- —
- Monthly P&I
- —
- Monthly cashflow
- —
- DSCR
- —
- Eligible?
- —
Personal DTI + credit; lowest rate.
DSCR
20% down · 8.5% · 30yr
- Down + closing
- —
- Monthly P&I
- —
- Monthly cashflow
- —
- DSCR
- —
- Eligible?
- —
No personal income docs; deal must DSCR.
Hard money
10% down · 12.0% · 12mo
- Down + closing
- —
- Monthly P&I
- —
- Monthly cashflow
- —
- DSCR
- —
- Eligible?
- —
Short-term bridge; refi at stabilization.
Listing history 4 events
-
2026-06-01statusdays on market $319,900 Pending 32 DOM
-
2026-05-31days on market $319,900 Active 31 DOM
-
2026-05-30days on market $319,900 Active 30 DOM
-
2026-04-30$319,900 Active 182-char remark
ⓘ Source: listings_history table (triggers on properties + properties_extension) + one-shot
backfill from property_details.listing_events for pre-trigger history.
Climate risk First Street
- Flood 1/10 Low FEMA zone X (unshaded) · 0% chance over 30 yrs
- Wildfire 4/10 Moderate
- Heat 3/10 Moderate 7 d/yr ≥106°F today · 16 d/yr by 30 yrs out
- Wind 2/10 Low
- Air quality 2/10 Low 1 unhealthy d/yr today · 2 by 30 yrs out
Nearby sold comps map
Loading sold comps map…
Walkable amenities ~0.75 mi
Loading nearby amenities…
Taxation est. · year 1
- Rental income
- $38,412
- − Mortgage interest
- −$17,919
- − Property taxes
- −$4,798
- − Insurance
- −$1,600
- − Repairs & maintenance
- −$3,073
- − Management
- −$3,073
- − Depreciation
- −$9,306
- Taxable loss
- −$1,357
- Est. tax savings @ 24.0%
- +$326
- After-tax cash flow
- $4,142/yr
For passive investors: Depreciation is non-cash, so a rental often shows a tax loss while cash-flowing — sheltering income. Rental losses are passive: they offset passive income freely, and up to $25,000/yr can offset ordinary (W-2) income if you actively participate and your MAGI is under $100k (phasing out to $0 by $150k); unused losses carry forward. On sale, claimed depreciation is recaptured at up to 25%, and gains may owe capital-gains tax (a 1031 exchange can defer both). Figures are a year-1 estimate at your 24.0% rate — not tax advice; consult a CPA.
Condition & rehab AI · 3 photos
A well-maintained, fully leased duplex with a large backyard and excellent rental history. Minor cosmetic improvements can further enhance its curb appeal and value.
Repairs flagged
- Minor Paint — Slight discoloration on exterior
- Minor Landscaping — Some areas could be trimmed
Value-add opportunities
- Both Paint exterior — Enhances curb appeal and value
- Both Landscaping — Improves curb appeal and rental appeal
Renovation cost estimate screening
| Repair item | Severity | Est. cost |
|---|---|---|
| Paint · Slight discoloration on exterior | Minor | $500–3,000 |
| Landscaping · Some areas could be trimmed | Minor | $500–3,000 |
| Total estimated repair cost · 2 items | $1,000–6,000 |
Value-add ROI direction
- Both Paint exterior — Enhances curb appeal and value ↑
- Both Landscaping — Improves curb appeal and rental appeal ↑
ⓘ Cost ranges are severity-bucket heuristics (US national rule-of-thumb). Get contractor quotes + a written scope before underwriting a rehab budget.
Schools (NCES district)
- District
- Iowa City Community School District
- NCES district ID
- 1914700
- Math proficiency
- 65% ▼ -6.00%
- Reading proficiency
- 70% ▲ 2.00%
- Median HH income
- $50,229
- Composite
- 57.3/100
- National rank
- #1088
- State rank
- #174 of 289 in IA
Livability — Coralville
- Score
- 90/100
- State rank
- #5
- US rank
- #89
Category grades
Schools grade is shown separately in the Schools card above.
Census & demographics
- Census place
- Coralville, IA
- County
- Johnson County · 132,710 people
- City population
- 23,250
- Metro
- Iowa City, IA
- Population (ZIP)
- 23,250
- Household income
- $69,243
- Rent vs Own
- Severe rent burden
- 1220.0
Population outlook (Johnson County) Hauer SSP2
- Today (2025)
- 180,405 people
- By 2030
- 200,014 · +10.9%
- By 2040
- 241,428 · +33.8%
- By 2050
- 288,144 · +59.7%
- By 2075
- 420,009 · +132.8%
- By 2100
- 546,596 · +203.0%
Race, ethnicity, and origin ACS 2023
- Neighborhood character
- Diverse neighborhood (Simpson 0.55)
- Race & ethnicity
- White 64% Black 15% Asian 10% Two or more races 7% Hispanic / Latino 6%
- Hispanic origin (detail)
- Mexican 3%
- Common ancestry
- Portuguese 3% Ukrainian 3% Slovak 2%
- Foreign-born
- 16% · China, Canada, South Korea
- Languages at home
- 78% English-only · Chinese 4% Spanish 4% Other Indo-European 4%
Political lean MEDSL · Johnson
- 2024 margin
- Solid D (+38.1) · D 68.4% · R 30.3% · Other 1.3%
- 2008→2024 swing
- -3.4pp toward R · 2008: 41.5pp · 2024: 38.1pp
- All cycles
- 2024: D+38.1 2020: D+43.2 2016: D+38.3 2012: D+35.4 2008: D+41.5
Not yet ingested
- Civics
- —
Market trends
- HPI YoY
- ▼ -95.15%
- Current HPI
- 154.7424
- Rent YoY
- ▲ 6.14%
- Metro
- Iowa City, IA
- State GDP YoY
- ▲ 2.48%
- F500 in state
- 4
Industry mix (Fortune 500 HQ in IA)
| Industry | F500 HQs | Revenue |
|---|---|---|
| Financial Services | 1 | $16B |
|
||
| Retail / Convenience | 1 | $15B |
|
||
Price history
2 events — show timeline
- 2026-06-01 Pending — ICAARMLS
- 2026-04-30 Listed $319,900 ICAARMLS
Cash-flow waterfall
monthlySold comps — $/sqft
last 12 mo · ≤1 miLoading sold comps…