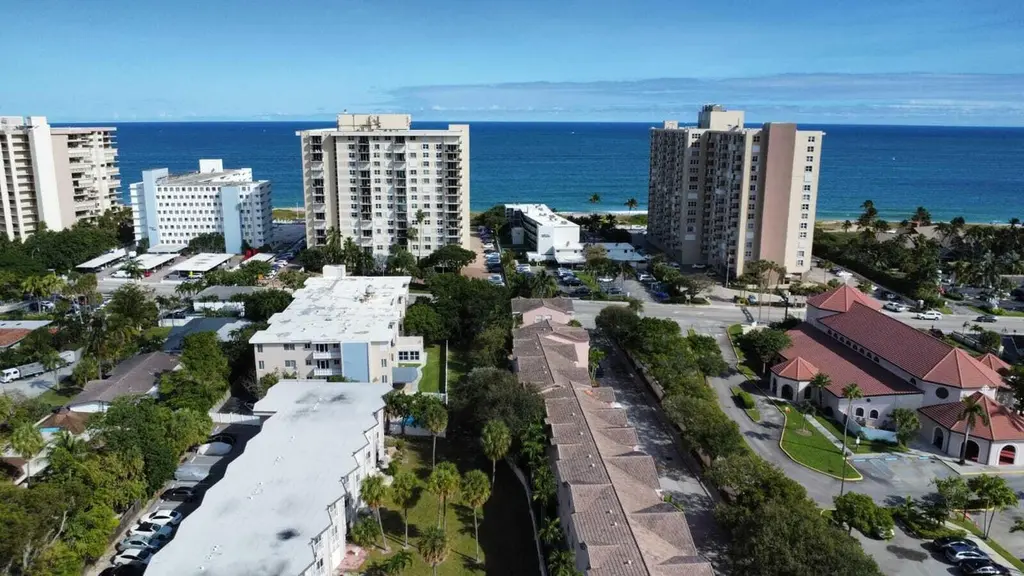
1967 S Ocean Blvd Unit 221d · Lauderdale-by-the-Sea, FL
Flood risk 5/10 · Moderate
- FEMA flood zone
- X (shaded)
- Chance of flooding over 30 yrs
- 0.23%
- Est. flood insurance / yr
- $507 – $1,088
Fire risk 1/10 · Minimal
- Est. fire insurance / yr
- $947 – $1,759
Heat risk 10/10 · Severe
- Hot days now (above 105°F)
- 7 days/yr
- Hot days in 30 yrs
- 27 days/yr
Wind risk 10/10 · Severe
- Chance of severe wind over 30 yrs
- 99.0%
Air-quality risk 2/10 · Minimal
- Unhealthy air days now
- 1 days/yr
- Unhealthy air days in 30 yrs
- 2 days/yr
Risk factors via First Street. Map © Google.
Why this score? — see what drove the C+ grade
The composite is a weighted blend of 9 inputs, each scored 0–100. Each bar is that input's sub-score; the figure is the points it added to the 100-point composite (weight × sub-score).
- Cash flow +24.9/30.0
- 1% rule +10.0/10.0
- DSCR +8.1/10.0
- ARV discount +7.5/15.0
- Schools +4.1/10.0
- Livability +2.5/5.0
- Condition / age +2.5/5.0
- Rent growth +2.4/5.0
- Appreciation +0.0/10.0
$259,900
🖨 Deal sheet 📄 Offer letter ✓ Due diligence
Listing remarks
HANDYMAN SPECIAL!!! 2 BEDROOMS 2 FULL BATHROOMS!!! 1ST 2 BEDROOM UNIT TO BE SOLD ABOVE THE GROUND FLOOR IN 10 YEARS!!! THIS IS A GOLDEN OPPORTUNITY TO MAKE YOUR HOME IN YOUR IMAGE. JUST A SHORT WALK ACROSS THE STREET TO THE BEACH !!! COMMUNITY HAS A GATED HEATED POOL, GYM, LAUNDRY, NEW ROOF IN 2024, BUILDING HAS BEEN PAINTED, AS WELL AS MANY OTHER IMPROVEMENTS. RESTAURANTS, NIGHTLIFE, SHOPS, PUBLIX, ALL WITHIN WALKING DISTANCE. TAKE ADVANTAGE OF THIS RARE OPPORTUNITY TO LIVE BY THE BEACH.
Key facts
- $1,099 HOA
- Parking
- Community pool
Property features AI
Finance
- Other: Pets not allowed
- Financial info:
- HOA & community: Community amenities include beach access, car wash area, elevators, fitness center, laundry, picnic area, parking, pool (heated), shuffleboard court, storage, trash chute, bike storage, community room, maintained community; HOA fee paid monthly; fee includes insurance, grounds and structure maintenance, sewer, trash, water, common areas, elevator, reserve funds, roof repairs, recreation facility and pool service
Exterior
- Parking: Assigned parking (space purchased); 1 open parking space
- Security: Closed-circuit cameras; Security fence
- Utilities: Public water; Public sewer; Cable available, electricity available, phone available, water connected
- Home design: Condominium; One level; Faces north; Resale unit
- Construction: Built with concrete block system (CBS); Other roof; 4-story building
- Exterior features: Open patio and terrace; Patio
Interior
- Kitchen:
- Bedrooms: 2 bedrooms on the main level
- Flooring: Concrete
- Bathrooms: 2 full bathrooms on the main level
- Heating & cooling: Central individual heating; Central air conditioning
- Interior features: Concrete flooring; Patio - open, patio and terrace access
- Laundry & utility: Laundry room and common-area laundry available
Neighborhood map
What this means for you Summary
Snapshot
- This is a 2-bed/2.0-bath condo listed at $260k.
Deal economics
- At list price, monthly cash flow is $560 ($7k/yr) — positive.
- The deal already cash-flows at list — no discount required.
- Meets the 1% rule at list price ($4k rent vs $260k).
- Recommended offer: $244k (6.0% below list) — sets the bar for market timing.
- Cap rate 8.9% vs local median 2.0% in Lauderdale-by-the-Sea — top-decile yield for the area; either an underpriced asset or a hidden risk that comps aren't pricing in. Stress-test before assuming the spread holds.
Location & tenants
- Location reads: area grade C — affects rentability + tenant quality, not the cash-flow math above.
- Broward (suburban): math 42% / reading 53% proficiency, ranked #46 of 73 in FL (top 63%) — families likely to look elsewhere, expect single-tenant / working-renter base with shorter leases.
- Zoned schools: Mcnab Elementary School (math 51% / reading 63%, grade C+, #781 of 2,144 statewide, top 38%, 614 students, 56% FRL); Pompano Beach Middle School (math 29% / reading 40%, grade F, #421 of 571 statewide, top 74%, 1,040 students, 73% FRL); Northeast High School (math 12% / reading 37%, grade F, #505 of 667 statewide, top 79%, 1,552 students, 69% FRL).
- Market conditions: Rents soft (-0.4%/yr); 843 active listings in the ZIP; 40 comparable units currently listed for rent nearby; rentals at typical pace (median 21d on market — plan ~3-4 weeks tenant-placement turnaround); solid renter incomes; 2,111 units permitted in Broward County in 2024 (1,265 in 5+ unit buildings).
- At $4,042/mo this rent would consume 58% of the median local household income ($84k/yr) (locally 1298% of renters already pay >50% of income on rent) — very limited rent-growth headroom before tenants either downsize or default.
Forward outlook
- Local home prices are declining (-3.0%/yr); year-one equity from $2k of loan paydown is wiped out by about $8k of value loss. Plan a longer hold.
- Broward County population projected at +34% by 2050 — long-run rental-demand tailwind backs the buy-and-hold thesis.
Negotiation context
- It's been on market 67 days — a 6% lower offer ($244k) is reasonable based on typical stale-listing flexibility.
Risks & watch-outs
- Watch-outs: HOA is 27% of rent.
- Climate carrying-cost: moderate flood risk; severe wind risk, 99% chance of damaging wind over 30y; extreme-heat days projected 7→27/yr by 2055 (HVAC capex compounding) — expect insurance premiums to compound above CPI over the hold.
Questions for the listing agent
- It's been on market 67 days. Have you received any prior offers? Is the seller open to a 6% concession, seller financing, or rate buy-down credit?
- Built in 1969 — when were the roof, HVAC, electrical panel, plumbing, and water heater last replaced?
- What does the HOA fee cover, when was the last increase, and are there any pending special assessments or reserve-fund shortfalls?
- Any open or pending special assessments — roof, HVAC, plumbing, elevator, façade? What's the per-unit balance and payoff schedule, and is the seller paying it off at close or rolling it to the buyer?
- Why hasn't it sold? Are there any deal-killer items the seller is aware of (foundation, flood, title, zoning, code violations)?
- Is there a deadline driving the sale (1031 exchange, divorce, estate, relocation)? That informs how much negotiation room exists.
- What's the average days-on-market for RENTAL listings here right now (not sales)? A rising rental-DOM trend means longer vacancies and softer asking-rent achievability than the comps imply.
- What's the recent tenant-quality profile in this submarket — average credit score on applications, eviction rate, late-payment / NSF rate, and stable-employment percentage? A property-management company in the area should have these aggregated.
- How much new apartment / multifamily construction is in the pipeline within 1–3 miles? Heavy new supply (>2% of stock underway) typically softens rents 12–24 months out; light construction supports rent growth.
Investment metrics
- 1% rule
- 1.56% ✓
- Cap rate
- 8.88%
- Cash-on-cash
- 9.24%
- DSCR
- 1.41
- GRM
- 5.4
CMA / ARV
No comps found within radius.
Projected returns pro-forma
-3.0% appreciation · 0.0% rent growth · sell at horizon
- IRR
- -6.9%
- Equity multiple
- 0.76×
- Total profit
- $-17,690
- Equity at exit
- $38,752
- IRR
- -3.2%
- Equity multiple
- 0.82×
- Total profit
- $-12,880
- Equity at exit
- $22,471
Cash invested: $72,772 (down + closing). Projections, not guarantees.
Landlord ↔ Tenant lean methodology
- Overall (STATE)
- 87 Strongly Landlord-Friendly
- State Florida
- 87 Strongly Landlord-Friendly · R+3
- County
- — inherits STATE
- City
- — inherits STATE
ZIP-level market 33062
- Rents YoY
- -0.4%
- Active inventory
- 843
- Price-to-rent
- 5.4×
Monthly cashflow live
- Estimated rent
- $4,042 high interval (Pro) →
- Mortgage (P&I)
- −$1,363
- Tax from tax record
- −$62 /mo · $747/yr
- Insurance
- −$108
- HOA
- −$1,099
- Vacancy / Maint / Mgmt
- −$849
- Net cashflow
- $560
Break-even live
UW: 25.0% down · 7.5% · 30yr · 1.5% tax · 5.0% vac · 8.0% maint · 8.0% mgmt
Financing live
Cash to close
- Down payment
- $64,975
- Closing costs
- $7,797
- Reserves months
- —
- Total cash needed
- —
Loan-product check · same deal, 3 products live
Conventional
25% down · 7.5% · 30yr
- Down + closing
- —
- Monthly P&I
- —
- Monthly cashflow
- —
- DSCR
- —
- Eligible?
- —
Personal DTI + credit; lowest rate.
DSCR
20% down · 8.5% · 30yr
- Down + closing
- —
- Monthly P&I
- —
- Monthly cashflow
- —
- DSCR
- —
- Eligible?
- —
No personal income docs; deal must DSCR.
Hard money
10% down · 12.0% · 12mo
- Down + closing
- —
- Monthly P&I
- —
- Monthly cashflow
- —
- DSCR
- —
- Eligible?
- —
Short-term bridge; refi at stabilization.
Rent comps 40 comps
| Address | Beds | Baths | Sqft | Rent | $/sqft | DOM | Units | Dist |
|---|---|---|---|---|---|---|---|---|
| 1900 S Ocean Blvd Pompano Beach, FL | 2.0 | 2.0 | 1165 | $3,750 | $3.22 | 20d | 3 | 0.20mi |
| 1900 S Ocean Blvd Pompano Beach, FL | 2.0 | 2.0 | 1165 | $3,800 | $3.26 | 7d | 2 | 0.20mi |
| 1900 S Ocean Blvd Unit 1E Pompano Beach, FL | 2.0 | 2.0 | 1210 | $4,500 | $3.72 | 24d | 1 | 0.21mi |
| 2000 S Ocean Blvd Pompano Beach, FL | 1.0–2.0 | 1.5–2.0 | 1070 | $6,500 | $6.07 | 17d | 4 | 0.21mi |
| 2000 S Ocean Blvd Pompano Beach, FL | 1.0–2.0 | 1.5–2.0 | 1000 | $6,500 | $6.50 | 2d | 3 | 0.21mi |
| 2000 S Ocean Blvd Pompano Beach, FL | 1.0–2.0 | 1.5–2.0 | 1070 | $6,500 | $6.07 | 20d | 3 | 0.21mi |
| 6000 N Ocean Blvd Unit 1D Lauderdale by the Sea, FL | 2.0 | 2.0 | 904 | $3,200 | $3.54 | 3d | 1 | 0.24mi |
| 6000 N Ocean Blvd Unit 1D Lauderdale by the Sea, FL | 2.0 | 2.0 | 904 | $3,200 | $3.54 | 22d | 1 | 0.24mi |
| 1800 S Ocean Blvd Pompano Beach, FL | 2.0–3.0 | 2.0–2.5 | 1731 | $4,000 | $2.31 | 3d | 5 | 0.25mi |
| 1800 S Ocean Blvd Pompano Beach, FL | 2.0 | 2.0–2.5 | 1731 | $5,300 | $3.06 | 7d | 4 | 0.25mi |
| 1750 S Ocean Blvd Unit 509E Pompano Beach, FL | 2.0 | 2.0 | 945 | $4,200 | $4.44 | 24d | 1 | 0.31mi |
| 5400 N Ocean Blvd Lauderdale by the Sea, FL | 2.0–3.0 | 2.5 | 1631 | $3,800 | $2.33 | 4d | 2 | 0.31mi |
| 3333 Port Royale Dr S Fort Lauderdale, FL | 3.0 | 1.0–2.0 | 1175 | $3,716 | $3.16 | 1d | 40 | 0.33mi |
| 1541 S Ocean Blvd Pompano Beach, FL | 1.0 | 1.5 | 850 | $3,575 | $4.21 | 24d | 2 | 0.34mi |
| 5200 N Ocean Blvd Unit 203B Lauderdale by the Sea, FL | 2.0 | 2.0 | 1330 | $3,200 | $2.41 | 24d | 1 | 0.37mi |
| 5200 N Ocean Blvd Unit 914A Lauderdale by the Sea, FL | 2.0 | 2.0 | 1450 | $5,000 | $3.45 | 24d | 1 | 0.37mi |
| 5200 N Ocean Blvd #506 Fort Lauderdale, FL | 2.0 | 2.0 | 1330 | $3,300 | $2.48 | 14d | 1 | 0.37mi |
| 1620 S Ocean Blvd Unit 5M Pompano Beach, FL | 1.0 | 2.0 | 1116 | $5,000 | $4.48 | 24d | 1 | 0.38mi |
| 1501 S Ocean Blvd #307 Pompano Beach, FL | 2.0 | 2.0 | 1000 | $3,750 | $3.75 | 24d | 1 | 0.41mi |
| 3200 Port Royale Dr N Fort Lauderdale, FL | 2.0 | 2.0 | 1396 | $3,950 | $2.83 | 24d | 2 | 0.43mi |
| 3200 Port Royale Dr N Fort Lauderdale, FL | 2.0 | 2.0 | 1458 | $3,700 | $2.54 | 5d | 1 | 0.43mi |
| 5100 N Ocean Blvd #804 Lauderdale by the Sea, FL | 2.0 | 2.0 | 1400 | $3,800 | $2.71 | 24d | 1 | 0.44mi |
| 5100 N Ocean Blvd #1504 Lauderdale by the Sea, FL | 2.0 | 2.0 | 1400 | $4,000 | $2.86 | 3d | 1 | 0.44mi |
| 5100 N Ocean Blvd #502 Lauderdale by the Sea, FL | 1.0 | 1.5 | 1080 | $3,400 | $3.15 | 24d | 1 | 0.44mi |
| 5100 N Ocean Blvd #1205 Lauderdale by the Sea, FL | 2.0 | 2.0 | 1400 | $3,900 | $2.79 | 24d | 1 | 0.44mi |
| 1530 S Ocean Blvd #203 Pompano Beach, FL | 2.0 | 2.0 | 1250 | $7,000 | $5.60 | 7d | 1 | 0.46mi |
| 1500 S Ocean Blvd #508 Pompano Beach, FL | 2.0 | 2.0 | 1070 | $3,200 | $2.99 | 2d | 1 | 0.49mi |
| 5000 N Ocean Blvd #908 Lauderdale by the Sea, FL | 2.0 | 2.0 | 1433 | $3,700 | $2.58 | 2d | 1 | 0.51mi |
| 5000 N Ocean Blvd #506 Lauderdale by the Sea, FL | 1.0 | 1.5 | 1080 | $3,900 | $3.61 | 24d | 1 | 0.51mi |
| 5000 N Ocean Blvd #703 Lauderdale by the Sea, FL | 2.0 | 2.0 | 1433 | $5,200 | $3.63 | 24d | 1 | 0.51mi |
| 5000 N Ocean Blvd #1405 Lauderdale by the Sea, FL | 2.0 | 2.0 | 1433 | $5,250 | $3.66 | 7d | 1 | 0.51mi |
| 5000 N Ocean Blvd #208 Lauderdale by the Sea, FL | 2.0 | 2.0 | 1433 | $3,400 | $2.37 | 24d | 1 | 0.51mi |
| 5000 N Ocean Blvd #908 Lauderdale by the Sea, FL | 2.0 | 2.0 | 1433 | $3,940 | $2.75 | 17d | 1 | 0.51mi |
| 1500 S Ocean Blvd Pompano Beach, FL | 2.0 | 1.5–2.0 | 985 | $4,000 | $4.06 | 15d | 2 | 0.51mi |
| 2548 SE 14th St Pompano Beach, FL | 2.0 | 2.0 | 1400 | $12,000 | $8.57 | 1d | 1 | 0.53mi |
| 2548 SE 14th St Pompano Beach, FL | 2.0 | 2.0 | 1400 | $12,000 | $8.57 | 24d | 1 | 0.53mi |
| 1461 S Ocean Blvd Pompano Beach, FL | 2.0 | 2.0 | 920 | $3,525 | $3.83 | 5d | 2 | 0.54mi |
| 6299 Bay Club Dr #4 Fort Lauderdale, FL | 2.0 | 2.0 | 1200 | $4,900 | $4.08 | 24d | 1 | 0.56mi |
| 1470 S Ocean Blvd Pompano Beach, FL | 2.0 | 2.0 | 1250 | $4,000 | $3.20 | 24d | 3 | 0.56mi |
| 4900 N Ocean Blvd #705 Lauderdale by the Sea, FL | 2.0 | 2.0 | 1400 | $4,750 | $3.39 | 24d | 1 | 0.57mi |
HOA detail condo
- Monthly dues
- $1,099 · $13,188/yr
- Likely covers
- poolgymsecurity
- Assessments
- None detected in remarks — confirm with the listing agent.
Listing history 14 events
-
2026-06-18days on market $259,900 Active 67 DOM
-
2026-06-17days on market $259,900 Active 66 DOM
-
2026-06-16days on market $259,900 Active 65 DOM
-
2026-06-15days on market $259,900 Active 64 DOM
-
2026-06-13days on market $259,900 Active 62 DOM
-
2026-06-09days on market $259,900 Active 58 DOM
-
2026-06-08days on market $259,900 Active 57 DOM
-
2026-06-07days on market $259,900 Active 56 DOM
-
2026-06-04days on market $259,900 Active 53 DOM
-
2026-06-03days on market $259,900 Active 52 DOM
-
2026-06-02days on market $259,900 Active 51 DOM
-
2026-06-01days on market $259,900 Active 50 DOM
-
2026-05-31days on market $259,900 Active 49 DOM
-
2026-04-12$259,900 Active
ⓘ Source: listings_history table (triggers on properties + properties_extension) + one-shot
backfill from property_details.listing_events for pre-trigger history.
Tax reassessment forecast FL · Resets to sale price
- Current annual tax
- $747 · $62/mo
- Projected year-2 tax
- $2,157 · $180/mo
- Expected delta
- +$1,410/yr (+$117/mo · 188.7%)
ⓘ Screening estimate from a state-policy table — verify with the county assessor before closing.
Climate risk First Street
- Flood 5/10 Major FEMA zone X (shaded) · 23% chance over 30 yrs
- Wildfire 1/10 Low
- Heat 10/10 Extreme 7 d/yr ≥105°F today · 27 d/yr by 30 yrs out
- Wind 10/10 Extreme 99% chance of damaging wind over 30 yrs
- Air quality 2/10 Low 1 unhealthy d/yr today · 2 by 30 yrs out
Nearby sold comps map
Loading sold comps map…
Walkable amenities ~0.75 mi
Loading nearby amenities…
Taxation est. · year 1
- Rental income
- $48,501
- − Mortgage interest
- −$14,558
- − Property taxes
- −$747
- − Insurance
- −$1,300
- − Repairs & maintenance
- −$3,880
- − Management
- −$3,880
- − HOA
- −$13,188
- − Depreciation
- −$7,561
- Taxable income
- $3,386
- Est. tax owed @ 24.0%
- −$813
- After-tax cash flow
- $5,913/yr
For passive investors: Depreciation is non-cash, so a rental often shows a tax loss while cash-flowing — sheltering income. Rental losses are passive: they offset passive income freely, and up to $25,000/yr can offset ordinary (W-2) income if you actively participate and your MAGI is under $100k (phasing out to $0 by $150k); unused losses carry forward. On sale, claimed depreciation is recaptured at up to 25%, and gains may owe capital-gains tax (a 1031 exchange can defer both). Figures are a year-1 estimate at your 24.0% rate — not tax advice; consult a CPA.
Schools (NCES district)
- District
- Broward
- NCES district ID
- 1200180
- Math proficiency
- 42% ▼ -18.00%
- Reading proficiency
- 53% ▼ -5.00%
- Median HH income
- $52,139
- Composite
- 40.88/100
- National rank
- #3621
- State rank
- #46 of 73 in FL
Livability — Lauderdale-by-the-Sea
No livability data for this city. (Only ~50 U.S. cities are tracked.)
Census & demographics
- Census place
- Lauderdale-by-the-Sea, FL
- County
- Broward County · 1,963,430 people
- Metro
- Miami-Fort Lauderdale-Pompano Beach, FL
- Population (ZIP)
- 24,920
- Household income
- $83,582
- Rent vs Own
- Severe rent burden
- 1298.0
Population outlook (Broward County) Hauer SSP2
- Today (2025)
- 2,207,033 people
- By 2030
- 2,360,704 · +7.0%
- By 2040
- 2,661,208 · +20.6%
- By 2050
- 2,946,698 · +33.5%
- By 2075
- 3,602,273 · +63.2%
- By 2100
- 3,970,984 · +79.9%
Race, ethnicity, and origin ACS 2023
- Neighborhood character
- Predominantly White (76%)
- Race & ethnicity
- White 76% Hispanic / Latino 16% Two or more races 12% Black 3%
- Hispanic origin (detail)
- Puerto Rican 4% Cuban 3%
- Common ancestry
- Romanian 4% Italian 3% Scotch-Irish 2%
- Foreign-born
- 22% · Canada, Jamaica, Dominican Republic
- Languages at home
- 74% English-only · Spanish 14% Other Indo-European 4% Russian/Polish/Slavic 2%
Political lean MEDSL · Broward
- 2024 margin
- D (+17.0) · D 58.0% · R 41.0%
- 2008→2024 swing
- -17.8pp toward R · 2008: 34.7pp · 2024: 17.0pp
- All cycles
- 2024: D+17.0 2020: D+29.8 2016: D+35.0 2012: D+34.9 2008: D+34.7
Not yet ingested
- Civics
- —
Market trends
- HPI YoY
- ▼ -427.01%
- Current HPI
- 342.9461
- Rent YoY
- ▼ -0.36%
- Metro
- Miami-Fort Lauderdale-Pompano Beach, FL
- State GDP YoY
- ▲ 3.28%
- F500 in state
- 36
Industry mix (Fortune 500 HQ in FL)
| Industry | F500 HQs | Revenue |
|---|---|---|
| Industrial Technology | 2 | $29B |
|
||
| Insurance | 2 | $17B |
|
||
| Retail | 1 | $60B |
|
||
| Technology Distribution | 1 | $58B |
|
||
| Homebuilding | 1 | $35B |
|
||
| Technology Manufacturing | 1 | $35B |
|
||
Price history
1 event — show timeline
- 2026-04-12 Listed $259,900 Beaches MLS
Property tax history
+0.3%/yrLatest (2025): $747 · +24.2% YoY. Source: county tax records.
Cash-flow waterfall
monthlySold comps — $/sqft
last 12 mo · ≤1 miLoading sold comps…