8935 155th Ave Unit 3M · New York, NY
Flood risk 3/10 · Minor
- FEMA flood zone
- X (unshaded)
- Chance of flooding over 30 yrs
- 0.1%
- Est. flood insurance / yr
- $507 – $1,088
Fire risk 1/10 · Minimal
- Est. fire insurance / yr
- $691 – $1,283
Heat risk 6/10 · Moderate
- Hot days now (above 98°F)
- 7 days/yr
- Hot days in 30 yrs
- 14 days/yr
Wind risk 6/10 · Moderate
- Chance of severe wind over 30 yrs
- 69.0%
Air-quality risk 4/10 · Minor
- Unhealthy air days now
- 6 days/yr
- Unhealthy air days in 30 yrs
- 6 days/yr
Risk factors via First Street. Map © Google.
Why this score? — see what drove the F grade
The composite is a weighted blend of 9 inputs, each scored 0–100. Each bar is that input's sub-score; the figure is the points it added to the 100-point composite (weight × sub-score).
- 1% rule +7.6/10.0
- ARV discount +7.5/15.0
- Schools +5.0/10.0
- Livability +3.8/5.0
- Cash flow +3.1/30.0
- Rent growth +2.5/5.0
- Condition / age +2.5/5.0
- DSCR +0.0/10.0
- Appreciation +0.0/10.0
$199,700
🖨 Deal sheet 📄 Offer letter ✓ Due diligence
Listing remarks
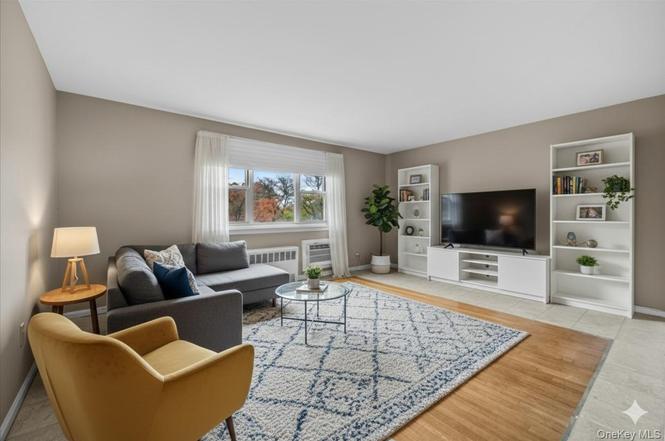
Welcome to this well-maintained 1-bedroom co-op offering convenience, comfort, and incredible accessibility. Located right by Lindenwood Commons Shopping Center and moments from Cross Bay Blvd, Belt Parkway, Conduit Ave, Linden Blvd, and JFK Airport, you’ll enjoy quick access to shopping, dining, and transportation. Situated on the 3rd floor, this unit features great natural lighting, an updated bathroom, and an open, clean slate ready for your personal touch. Move right in and make it your own!
Key facts
- 3rd floor
- Updated bathroom
- Built 1962
Tags
Property features AI
Finance
- HOA & community: Association: Greenwood Village; Monthly association fee; Association fee includes common area maintenance, gas, heat, and trash
Exterior
- Parking: No carport; Parking: waitlist
- Utilities: Public sewer; Cable available
- Home design: Stock cooperative
- Construction: Brick construction
- Exterior features: Brick exterior; Not waterfront
Interior
- Kitchen: Microwave; Oven; Refrigerator
- Bedrooms: Entry level: 3
- Bathrooms: 1 full bathroom
- Heating & cooling: Baseboard heating; Wall/window air conditioning units
- Interior features: Galley-style kitchen; No basement; Total of 4 rooms
- Laundry & utility: Pets allowed — contact management
Neighborhood map
What this means for you Summary
Snapshot
- This is a 1-bed/1.0-bath condo listed at $200k.
Deal economics
- At list price, monthly cash flow is $-639 ($-8k/yr) — negative.
- The deal already cash-flows at list — no discount required.
- Meets the 1% rule at list price ($3k rent vs $200k).
- Recommended offer: $176k (12.0% below list) — sets the bar for market timing.
Location & tenants
- Location reads 75/100 on livability (#268 in NY, #4,188 nationally) — a middle-class / working-renter tenant base. Strengths: amenities A+, commute A+, health & safety A; Watch: crime F, cost of living F.
- Market conditions: 258 active listings in the ZIP; 4 comparable units currently listed for rent nearby; rentals at typical pace (median 25d on market — plan ~3-4 weeks tenant-placement turnaround); solid renter incomes; 5,302 units permitted in Queens County in 2024 (4,918 in 5+ unit buildings).
- This rent runs 32% of the median local income ($95k/yr) — at the standard rent-burdened threshold; future hikes will face affordability resistance.
Forward outlook
- Local home prices are declining (-3.0%/yr); year-one equity from $1k of loan paydown is wiped out by about $6k of value loss. Plan a longer hold.
- Queens County population projected at +16% by 2050 — long-run rental-demand tailwind backs the buy-and-hold thesis.
Negotiation context
- It's been on market 122 days — a 12% lower offer ($176k) is reasonable based on typical stale-listing flexibility.
- 2 sale attempts; this cycle's ask has dropped $20k (9%) from the opening price — seller is motivated, your offer sets the floor, not the list.
Risks & watch-outs
- Watch-outs: HOA is 49% of rent.
- Climate carrying-cost: major wind risk, 69% chance of damaging wind over 30y; extreme-heat days projected 7→14/yr by 2055 (HVAC capex compounding) — expect insurance premiums to compound above CPI over the hold.
Questions for the listing agent
- What do current leases actually rent for vs. the listed asking? Can we see a recent rent roll and the last 12 months of T-12 income?
- It's been on market 122 days. Have you received any prior offers? Is the seller open to a 12% concession, seller financing, or rate buy-down credit?
- Built in 1962 — when were the roof, HVAC, electrical panel, plumbing, and water heater last replaced?
- What does the HOA fee cover, when was the last increase, and are there any pending special assessments or reserve-fund shortfalls?
- Any open or pending special assessments — roof, HVAC, plumbing, elevator, façade? What's the per-unit balance and payoff schedule, and is the seller paying it off at close or rolling it to the buyer?
- Why hasn't it sold? Are there any deal-killer items the seller is aware of (foundation, flood, title, zoning, code violations)?
- Is there a deadline driving the sale (1031 exchange, divorce, estate, relocation)? That informs how much negotiation room exists.
- Schools are B-rated — typically a magnet for longer-tenancy family renters. What's the average tenant stay here, and is there a school-zone premium baked into asking?
- Crime grade is F in this area — have there been break-ins, vandalism, or insurance claims at this property in the last 3 years? What carrier currently insures it and at what premium?
- The area grade is low — what's the realistic commute time and amenity access for the typical tenant pool here? Any planned neighborhood developments (good or bad) we should know about?
- What's the average days-on-market for RENTAL listings here right now (not sales)? A rising rental-DOM trend means longer vacancies and softer asking-rent achievability than the comps imply.
- What's the recent tenant-quality profile in this submarket — average credit score on applications, eviction rate, late-payment / NSF rate, and stable-employment percentage? A property-management company in the area should have these aggregated.
- How much new apartment / multifamily construction is in the pipeline within 1–3 miles? Heavy new supply (>2% of stock underway) typically softens rents 12–24 months out; light construction supports rent growth.
Investment metrics
- 1% rule
- 1.26% ✓
- Cap rate
- 2.45%
- Cash-on-cash
- -13.71%
- DSCR
- 0.39
- GRM
- 6.6
CMA / ARV
No comps found within radius.
Projected returns pro-forma
-3.0% appreciation · 3.0% rent growth · sell at horizon
- IRR
- -41.3%
- Equity multiple
- -0.29×
- Total profit
- $-72,245
- Equity at exit
- $29,776
- IRR
- -62.9%
- Equity multiple
- -1.00×
- Total profit
- $-112,048
- Equity at exit
- $17,266
Cash invested: $55,916 (down + closing). Projections, not guarantees.
Landlord ↔ Tenant lean methodology
- Overall (CITY)
- 0 Strongly Tenant-Friendly
- State New York
- 15 Strongly Tenant-Friendly · D+10
- County
- — inherits STATE
- City New York
- 0 Strongly Tenant-Friendly · D+34
ZIP-level market 11414
- Active inventory
- 258
- Price-to-rent
- 6.6×
Monthly cashflow live
- Estimated rent
- $2,508 medium interval (Pro) →
- Mortgage (P&I)
- −$1,047
- Tax est. 1.5%
- −$250 /mo · $2,996/yr
- Insurance
- −$83
- HOA est. from 1 same-building comp
- −$1,240
- Vacancy / Maint / Mgmt
- −$527
- Net cashflow
- $-639
Break-even live
UW: 25.0% down · 7.5% · 30yr · 1.5% tax · 5.0% vac · 8.0% maint · 8.0% mgmt
Financing live
Cash to close
- Down payment
- $49,925
- Closing costs
- $5,991
- Reserves months
- —
- Total cash needed
- —
Loan-product check · same deal, 3 products live
Conventional
25% down · 7.5% · 30yr
- Down + closing
- —
- Monthly P&I
- —
- Monthly cashflow
- —
- DSCR
- —
- Eligible?
- —
Personal DTI + credit; lowest rate.
DSCR
20% down · 8.5% · 30yr
- Down + closing
- —
- Monthly P&I
- —
- Monthly cashflow
- —
- DSCR
- —
- Eligible?
- —
No personal income docs; deal must DSCR.
Hard money
10% down · 12.0% · 12mo
- Down + closing
- —
- Monthly P&I
- —
- Monthly cashflow
- —
- DSCR
- —
- Eligible?
- —
Short-term bridge; refi at stabilization.
Rent comps 4 comps
| Address | Beds | Baths | Sqft | Rent | $/sqft | DOM | Units | Dist |
|---|---|---|---|---|---|---|---|---|
| 8439 153rd Ave Unit 5A Howard Beach, NY | 1.0 | 1.0 | 800 | $2,500 | $3.12 | 24d | 1 | 0.14mi |
| 84-29 155th Ave Unit 5J Queens, NY | 1.0 | 1.0 | 800 | $2,500 | $3.12 | 24d | 1 | 0.18mi |
| 9512 108th Ave Ozone Park, NY | 2.0 | 1.0 | 1000 | $2,800 | $2.80 | 11d | 1 | 0.80mi |
| 9105 107th Ave Ozone Park, NY | 1.0 | 1.0 | 648 | $2,400 | $3.70 | 19d | 1 | 0.80mi |
HOA detail condo
- Monthly dues
- $0 · $0/yr
- Assessments
- None detected in remarks — confirm with the listing agent.
Listing history 10 events
-
2026-06-18days on market $199,700 Active 122 DOM
-
2026-06-17price $199,700 Active 121 DOM
-
2026-06-17days on market $215,000 Active 121 DOM
-
2026-06-15days on market $215,000 Active 119 DOM
-
2026-06-01days on market $215,000 Active 118 DOM
-
2026-05-31days on market $215,000 Active 117 DOM
-
2026-05-20price $215,000
-
2026-04-02status Active
-
2026-01-28status Pending
-
2025-12-01$220,000 Active
ⓘ Source: listings_history table (triggers on properties + properties_extension) + one-shot
backfill from property_details.listing_events for pre-trigger history.
Climate risk First Street
- Flood 3/10 Moderate FEMA zone X (unshaded) · 10% chance over 30 yrs
- Wildfire 1/10 Low
- Heat 6/10 Major 7 d/yr ≥98°F today · 14 d/yr by 30 yrs out
- Wind 6/10 Major 69% chance of damaging wind over 30 yrs
- Air quality 4/10 Moderate 6 unhealthy d/yr today · 6 by 30 yrs out
Nearby sold comps map
Loading sold comps map…
Walkable amenities ~0.75 mi
Loading nearby amenities…
Taxation est. · year 1
- Rental income
- $30,096
- − Mortgage interest
- −$11,186
- − Property taxes
- −$2,996
- − Insurance
- −$998
- − Repairs & maintenance
- −$2,408
- − Management
- −$2,408
- − HOA
- −$14,880
- − Depreciation
- −$5,809
- Taxable loss
- −$10,589
- Est. tax savings @ 24.0%
- +$2,541
- After-tax cash flow
- $-5,124/yr
For passive investors: Depreciation is non-cash, so a rental often shows a tax loss while cash-flowing — sheltering income. Rental losses are passive: they offset passive income freely, and up to $25,000/yr can offset ordinary (W-2) income if you actively participate and your MAGI is under $100k (phasing out to $0 by $150k); unused losses carry forward. On sale, claimed depreciation is recaptured at up to 25%, and gains may owe capital-gains tax (a 1031 exchange can defer both). Figures are a year-1 estimate at your 24.0% rate — not tax advice; consult a CPA.
Schools (NCES district)
No district data.
Livability — New York
- Score
- 75/100
- State rank
- #268
- US rank
- #4188
Category grades
Schools grade is shown separately in the Schools card above.
Census & demographics
- Census place
- New York, NY
- County
- Queens County · 1,914,869 people
- City population
- 7,731,280
- Metro
- New York-Newark-Jersey City, NY-NJ-PA
- Population (ZIP)
- 31,308
- Household income
- $95,051
- Rent vs Own
- Severe rent burden
- 985.0
Population outlook (Queens County) Hauer SSP2
- Today (2025)
- 2,546,320 people
- By 2030
- 2,643,059 · +3.8%
- By 2040
- 2,815,563 · +10.6%
- By 2050
- 2,944,423 · +15.6%
- By 2075
- 3,123,338 · +22.7%
- By 2100
- 3,098,688 · +21.7%
Race, ethnicity, and origin ACS 2023
- Neighborhood character
- Diverse neighborhood (Simpson 0.56)
- Race & ethnicity
- White 61% Hispanic / Latino 25% Two or more races 13% Black 5% Asian 5%
- Hispanic origin (detail)
- Puerto Rican 11% Dominican 6%
- Common ancestry
- Romanian 4% Scotch-Irish 1%
- Foreign-born
- 20% · Canada, Jamaica, China
- Languages at home
- 63% English-only · Spanish 17% Other Indo-European 14% Russian/Polish/Slavic 2%
Political lean MEDSL · Queens
- 2024 margin
- Strong D (+24.6) · D 62.3% · R 37.7%
- 2008→2024 swing
- -26.2pp toward R · 2008: 50.8pp · 2024: 24.6pp
- All cycles
- 2024: D+24.6 2020: D+45.2 2016: D+53.4 2012: D+58.5 2008: D+50.8
Not yet ingested
- Civics
- —
Market trends
- HPI YoY
- ▼ -227.02%
- Current HPI
- 206.6334
- Rent YoY
- —
- Metro
- New York-Newark-Jersey City, NY-NJ-PA
- State GDP YoY
- ▲ 2.60%
- F500 in state
- 92
Industry mix (Fortune 500 HQ in NY)
| Industry | F500 HQs | Revenue |
|---|---|---|
| Financial Services | 10 | $950B |
|
||
| Consumer Goods | 9 | $162B |
|
||
| Insurance | 4 | $225B |
|
||
| Telecommunications | 2 | $144B |
|
||
| Pharmaceuticals | 2 | $112B |
|
||
| Media / Entertainment | 2 | $69B |
|
||
Price history
-2.3% since first listed4 events — show timeline
- 2026-05-20 Price Changed $215,000 OneKey® MLS as Distributed by MLS Grid
- 2026-04-02 Relisted — OneKey® MLS as Distributed by MLS Grid
- 2026-01-28 Pending — OneKey® MLS as Distributed by MLS Grid
- 2025-12-01 Listed $220,000 OneKey® MLS as Distributed by MLS Grid
Cash-flow waterfall
monthlySold comps — $/sqft
last 12 mo · ≤1 miLoading sold comps…