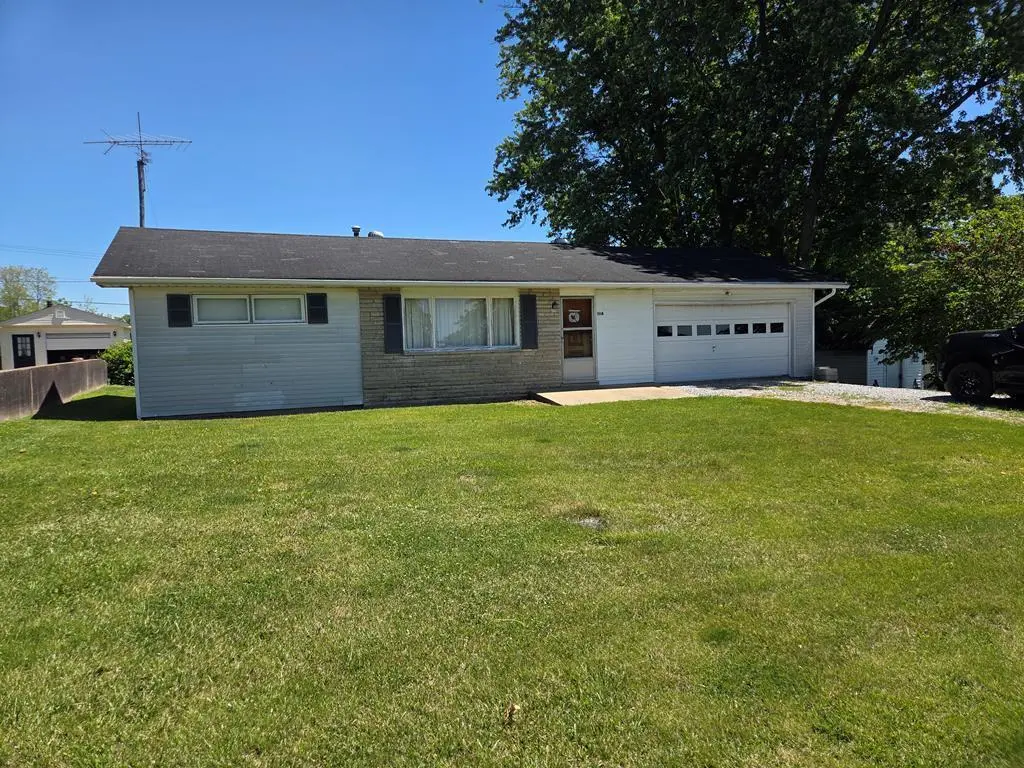
1514 Helena Rd · Flemingsburg, KY
Flood risk 1/10 · Minimal
- FEMA flood zone
- X (unshaded)
- Chance of flooding over 30 yrs
- 0.0%
- Est. flood insurance / yr
- $473 – $860
Fire risk 4/10 · Minor
- Est. fire insurance / yr
- $839 – $1,559
Heat risk 4/10 · Minor
- Hot days now (above 101°F)
- 7 days/yr
- Hot days in 30 yrs
- 19 days/yr
Wind risk 2/10 · Minimal
- Chance of severe wind over 30 yrs
- 2.0%
Air-quality risk 2/10 · Minimal
- Unhealthy air days now
- 0 days/yr
- Unhealthy air days in 30 yrs
- 1 days/yr
Risk factors via First Street. Map © Google.
Why this score? — see what drove the C grade
The composite is a weighted blend of 9 inputs, each scored 0–100. Each bar is that input's sub-score; the figure is the points it added to the 100-point composite (weight × sub-score).
- ARV discount +15.0/15.0
- Cash flow +14.8/30.0
- Appreciation +9.0/10.0
- DSCR +4.5/10.0
- Livability +3.4/5.0
- 1% rule +3.0/10.0
- Schools +2.8/10.0
- Rent growth +2.5/5.0
- Condition / age +2.5/5.0
$120,000
🖨 Deal sheet 📄 Offer letter ✓ Due diligence
Listing remarks
Welcome to this inviting two-bedroom, one-bath home, with a full unfinished basement, offering the perfect blend of comfort, convenience, and quiet country living. The large back yard is great for relaxing and the scenic views. Set just one mile from Flemingsburg, this property gives you quick access to all amenities while still providing the serenity of a rural setting.
Key facts
- 0.27 acre lot
- 2 garage spots
- Built 1967
Property features AI
Exterior
- Parking: Attached garage facing the front; Property has a garage
- Utilities: Public water; Septic tank
- Home design: Single-story house
- Construction: Vinyl siding; Block foundation; Composition roof; Built as a house
- Exterior features: Landscaped lot with few trees; Walk-out basement (full, unfinished)
Interior
- Kitchen: Microwave; Refrigerator; Range
- Bedrooms: Primary bedroom is on the first floor
- Flooring: Carpet
- Bathrooms: 1 full bathroom
- Heating & cooling: Forced air heating (propane); Central air conditioning
- Interior features: Primary bedroom on the first floor; Ceiling fan(s); Storm windows
- Laundry & utility: Washer hookup; Electric dryer hookup
Neighborhood map
What this means for you Summary
Snapshot
- This is a 2-bed/1.0-bath single-family listed at $120k.
Deal economics
- At list price, monthly cash flow is $34 ($402/yr) — positive.
- The deal already cash-flows at list — no discount required.
- To meet the 1% rule (rent ≥ 1% of price), the offer needs to be $96k (20.3% below list).
- Recommended offer: $96k (20.3% below list) — sets the bar for 1% rule.
- Cap rate 6.6% vs local median 2.7% in Flemingsburg — top-decile yield for the area; either an underpriced asset or a hidden risk that comps aren't pricing in. Stress-test before assuming the spread holds.
Location & tenants
- Location reads 67/100 on livability (#221 in KY) — a middle-class / working-renter tenant base. Strengths: crime A+, cost of living A+, housing A+; Watch: amenities F, commute F, employment F.
- Fleming County (rural): math 26% / reading 41% proficiency, ranked #83 of 165 in KY (top 50%) — families likely to look elsewhere, expect single-tenant / working-renter base with shorter leases.
- Zoned schools: Simons Middle School (math 26% / reading 43%, grade F, #99 of 217 statewide, top 47%, 325 students, 65% FRL); Fleming County High School (math 27% / reading 32%, grade F, #127 of 254 statewide, top 58%, 654 students, 54% FRL).
- Market conditions: 43 active listings in the ZIP; 2 units permitted in Fleming County in 2024 (0 in 5+ unit buildings).
Forward outlook
- In year one you build about $10k of equity ($830 loan paydown + $10k appreciation (8.0% local appreciation)).
- At projected returns (8.0% appreciation + 3.0% rent growth), your $34k cash investment doubles in ~3 years — after that, you're playing with house money.
- By year 4, paydown + projected appreciation supports a ~$36k cash-out refi (75% LTV) — recoverable capital for the next deal without selling this one.
Negotiation context
- It's been on market 35 days — a 3% lower offer ($116k) is reasonable based on typical stale-listing flexibility.
Questions for the listing agent
- It's been on market 35 days. Have you received any prior offers? Is the seller open to a 20% concession, seller financing, or rate buy-down credit?
- Built in 1967 — when were the roof, HVAC, electrical panel, plumbing, and water heater last replaced?
- Is there a deadline driving the sale (1031 exchange, divorce, estate, relocation)? That informs how much negotiation room exists.
- What's the average days-on-market for RENTAL listings here right now (not sales)? A rising rental-DOM trend means longer vacancies and softer asking-rent achievability than the comps imply.
- What's the recent tenant-quality profile in this submarket — average credit score on applications, eviction rate, late-payment / NSF rate, and stable-employment percentage? A property-management company in the area should have these aggregated.
- How much new for-sale + rental construction is in the pipeline within 1–3 miles? Heavy new supply typically softens prices + rents 12–24 months out; constrained supply supports both.
Investment metrics
- 1% rule
- 0.80% ✗
- Cap rate
- 6.63%
- Cash-on-cash
- 1.20%
- DSCR
- 1.05
- GRM
- 10.5
CMA / ARV
- ARV (median comp)
- $149,715
- List price
- $120,000
- Delta
- -19.85%
- Verdict
- UNDERPRICED
- Comps
- 6 within 2.0 mi
Projected returns pro-forma
8.02% appreciation · 3.0% rent growth · sell at horizon
- IRR
- 20.9%
- Equity multiple
- 2.54×
- Total profit
- $51,640
- Equity at exit
- $91,298
- IRR
- 19.3%
- Equity multiple
- 5.41×
- Total profit
- $148,138
- Equity at exit
- $181,349
Cash invested: $33,600 (down + closing). Projections, not guarantees.
Landlord ↔ Tenant lean methodology
- Overall (STATE)
- 83 Strongly Landlord-Friendly
- State Kentucky
- 83 Strongly Landlord-Friendly · R+16
- County
- — inherits STATE
- City
- — inherits STATE
ZIP-level market 41041
- Home prices YoY
- 3.6%
- Active inventory
- 43
- Price-to-rent
- 10.5×
Monthly cashflow live
- Estimated rent
- $957 medium interval (Pro) →
- Mortgage (P&I)
- −$629
- Tax from tax record
- −$43 /mo · $515/yr
- Insurance
- −$50
- HOA
- −$0
- Vacancy / Maint / Mgmt
- −$201
- Net cashflow
- $34
Break-even live
UW: 25.0% down · 7.5% · 30yr · 1.5% tax · 5.0% vac · 8.0% maint · 8.0% mgmt
Financing live
Cash to close
- Down payment
- $30,000
- Closing costs
- $3,600
- Reserves months
- —
- Total cash needed
- —
Loan-product check · same deal, 3 products live
Conventional
25% down · 7.5% · 30yr
- Down + closing
- —
- Monthly P&I
- —
- Monthly cashflow
- —
- DSCR
- —
- Eligible?
- —
Personal DTI + credit; lowest rate.
DSCR
20% down · 8.5% · 30yr
- Down + closing
- —
- Monthly P&I
- —
- Monthly cashflow
- —
- DSCR
- —
- Eligible?
- —
No personal income docs; deal must DSCR.
Hard money
10% down · 12.0% · 12mo
- Down + closing
- —
- Monthly P&I
- —
- Monthly cashflow
- —
- DSCR
- —
- Eligible?
- —
Short-term bridge; refi at stabilization.
Listing history 16 events
-
2026-06-18days on market $120,000 Active 35 DOM
-
2026-06-17days on market $120,000 Active 34 DOM
-
2026-06-16days on market $120,000 Active 33 DOM
-
2026-06-15days on market $120,000 Active 32 DOM
-
2026-06-14days on market $120,000 Active 30 DOM
-
2026-06-13days on market $120,000 Active 29 DOM
-
2026-06-10days on market $120,000 Active 27 DOM
-
2026-06-09days on market $120,000 Active 26 DOM
-
2026-06-08days on market $120,000 Active 25 DOM
-
2026-06-07days on market $120,000 Active 24 DOM
-
2026-06-03days on market $120,000 Active 20 DOM
-
2026-06-02days on market $120,000 Active 19 DOM
-
2026-06-01days on market $120,000 Active 18 DOM
-
2026-05-31days on market $120,000 Active 17 DOM
-
2026-05-31days on market $120,000 Active 16 DOM
-
2026-05-14$120,000 Active 373-char remark
ⓘ Source: listings_history table (triggers on properties + properties_extension) + one-shot
backfill from property_details.listing_events for pre-trigger history.
Tax reassessment forecast KY · Resets to sale price
- Current annual tax
- $515 · $43/mo
- Projected year-2 tax
- $1,032 · $86/mo
- Expected delta
- +$517/yr (+$43/mo · 100.5%)
ⓘ Screening estimate from a state-policy table — verify with the county assessor before closing.
Climate risk First Street
- Flood 1/10 Low FEMA zone X (unshaded) · 0% chance over 30 yrs
- Wildfire 4/10 Moderate
- Heat 4/10 Moderate 7 d/yr ≥101°F today · 19 d/yr by 30 yrs out
- Wind 2/10 Low 2% chance of damaging wind over 30 yrs
- Air quality 2/10 Low 0 unhealthy d/yr today · 1 by 30 yrs out
Nearby sold comps map
Loading sold comps map…
Walkable amenities ~0.75 mi
Loading nearby amenities…
Taxation est. · year 1
- Rental income
- $11,479
- − Mortgage interest
- −$6,722
- − Property taxes
- −$515
- − Insurance
- −$600
- − Repairs & maintenance
- −$918
- − Management
- −$918
- − Depreciation
- −$3,491
- Taxable loss
- −$1,685
- Est. tax savings @ 24.0%
- +$404
- After-tax cash flow
- $807/yr
For passive investors: Depreciation is non-cash, so a rental often shows a tax loss while cash-flowing — sheltering income. Rental losses are passive: they offset passive income freely, and up to $25,000/yr can offset ordinary (W-2) income if you actively participate and your MAGI is under $100k (phasing out to $0 by $150k); unused losses carry forward. On sale, claimed depreciation is recaptured at up to 25%, and gains may owe capital-gains tax (a 1031 exchange can defer both). Figures are a year-1 estimate at your 24.0% rate — not tax advice; consult a CPA.
Schools (NCES district)
- District
- Fleming County
- NCES district ID
- 2101920
- Math proficiency
- 26% ▼ -29.00%
- Reading proficiency
- 41% ▼ -17.00%
- Median HH income
- $34,964
- Composite
- 27.61/100
- National rank
- #6928
- State rank
- #83 of 165 in KY
Livability — Flemingsburg
- Score
- 67/100
- State rank
- #221
- US rank
- #10768
Category grades
Schools grade is shown separately in the Schools card above.
Census & demographics
- Population (ZIP)
- 7,564
Population outlook (Fleming County) Hauer SSP2
- Today (2025)
- 14,917 people
- By 2030
- 14,997 · +0.5%
- By 2040
- 15,033 · +0.8%
- By 2050
- 14,808 · -0.7%
- By 2075
- 14,037 · -5.9%
- By 2100
- 12,176 · -18.4%
Race, ethnicity, and origin ACS 2023
- Neighborhood character
- Predominantly White (94%)
- Race & ethnicity
- White 94% Hispanic / Latino 3% Two or more races 2% Black 1% Asian 1%
- Common ancestry
- Serbian 6% Slovak 2% Italian 1%
- Foreign-born
- 2% · China, Canada
- Languages at home
- 95% English-only · Spanish 3% Chinese 1% German/W. Germanic 1%
Political lean MEDSL · Fleming
- 2024 margin
- Solid R (+60.6) · D 19.1% · R 79.7% · Other 1.3%
- 2008→2024 swing
- -40.9pp toward R · 2008: -19.8pp · 2024: -60.6pp
- All cycles
- 2024: R+60.6 2020: R+57.5 2016: R+54.0 2012: R+32.3 2008: R+19.8
Not yet ingested
- Civics
- —
Market trends
- HPI YoY
- ▲ 8.02%
- Current HPI
- 230.7901
- Rent YoY
- —
- Metro
- —
- State GDP YoY
- ▲ 1.81%
- F500 in state
- 4
Industry mix (Fortune 500 HQ in KY)
| Industry | F500 HQs | Revenue |
|---|---|---|
| Healthcare | 1 | $118B |
|
||
| Food / Beverage | 1 | $7B |
|
||
Price history
1 event — show timeline
- 2026-05-14 Listed $120,000 ImagineMLS
Property tax history
+1.3%/yrLatest (2025): $515 · -1.3% YoY. Source: county tax records.
Cash-flow waterfall
monthlySold comps — $/sqft
last 12 mo · ≤1 miLoading sold comps…