128 W Fairview St · Bethlehem, PA
Flood risk 1/10 · Minimal
- FEMA flood zone
- X (unshaded)
- Chance of flooding over 30 yrs
- 0.0%
- Est. flood insurance / yr
- $473 – $860
Fire risk 2/10 · Minimal
- Est. fire insurance / yr
- $511 – $949
Heat risk 5/10 · Moderate
- Hot days now (above 99°F)
- 7 days/yr
- Hot days in 30 yrs
- 15 days/yr
Wind risk 4/10 · Minor
- Chance of severe wind over 30 yrs
- 15.0%
Air-quality risk 4/10 · Minor
- Unhealthy air days now
- 3 days/yr
- Unhealthy air days in 30 yrs
- 6 days/yr
Risk factors via First Street. Map © Google.
Why this score? — see what drove the D grade
The composite is a weighted blend of 9 inputs, each scored 0–100. Each bar is that input's sub-score; the figure is the points it added to the 100-point composite (weight × sub-score).
- Cash flow +15.6/30.0
- ARV discount +7.9/15.0
- DSCR +4.8/10.0
- Livability +4.1/5.0
- 1% rule +3.8/10.0
- Schools +3.5/10.0
- Rent growth +2.7/5.0
- Condition / age +2.5/5.0
- Appreciation +0.0/10.0
$250,000
🖨 Deal sheet (PDF) 📄 Offer letter ✓ Due diligence
Listing remarks
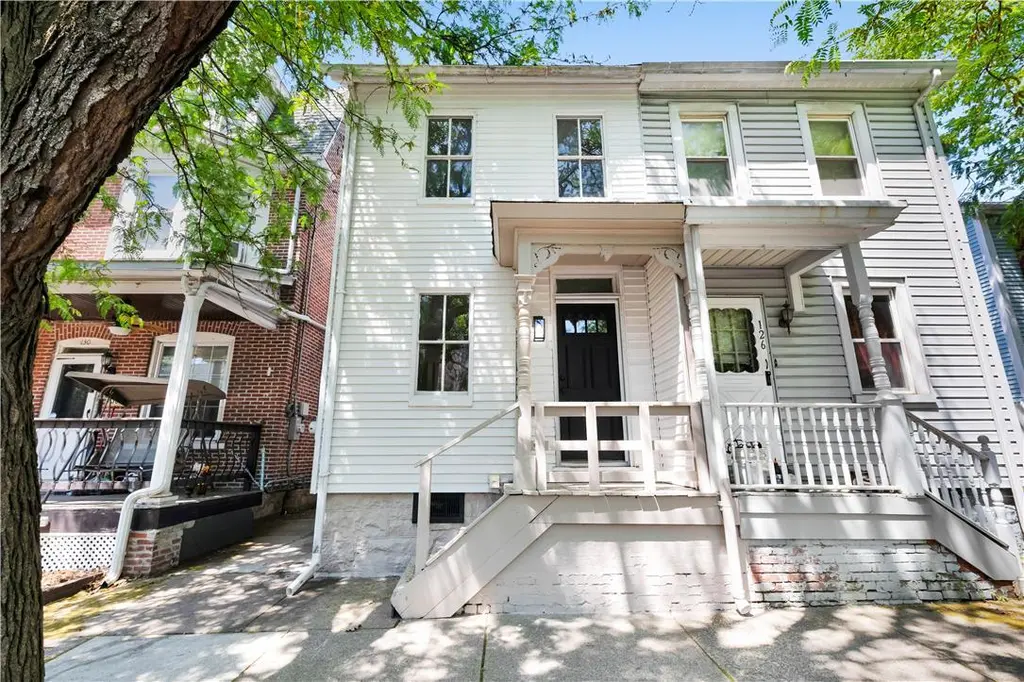
Conveniently located just blocks from Moravian University and within walking distance to the restaurants, shops, and festivals of historic downtown Bethlehem. This newly renovated twin offers a spacious first floor layout. The levels above include 2 bedrooms, a full bath, and a finished attic for clean storage. Updates include a new kitchen with timeless finishes, a new bath, and new flooring throughout. The rear deck and fenced yard offer plenty of space to garden, entertain, or just relax! Sale includes an ADDITIONAL LOT (N6SW3C 17 1 0204) previously used for off-street parking, extra yard, and garden area. See photos for lot lines.
Key facts
- New bath
- New kitchen
- Finished attic
Tags
Property features AI
Exterior
- Parking: 2-car garage; Off-street parking; On-street parking
- Utilities: Public water; Public sewer; Electric service
- Home design: 2-story home; Vinyl siding
- Construction: Asphalt/fiberglass roof; Built with vinyl siding; Slab foundation
- Exterior features: Deck; Yard fenced
Interior
- Kitchen: Gas oven; Gas range; Microwave; Dishwasher
- Bedrooms: Total of 6 rooms (includes bedrooms and living spaces)
- Flooring: Carpet; Luxury vinyl; Luxury vinyl plank
- Bathrooms: 1 full bathroom
- Heating & cooling: Electric baseboard heating
- Interior features: Dining area; Separate/formal dining room; Full basement
- Laundry & utility: Washer; Dryer; Electric water heater
Neighborhood map
What this means for you Summary
Snapshot
- This is a 3-bed/1.0-bath townhouse listed at $250k.
Deal economics
- At list price, monthly cash flow is $104 ($1k/yr) — positive.
- The deal already cash-flows at list — no discount required.
- To meet the 1% rule (rent ≥ 1% of price), the offer needs to be $221k (11.5% below list).
- Recommended offer: $221k (11.5% below list) — sets the bar for 1% rule.
- Cap rate 6.8% vs local median 4.3% in Bethlehem — top-decile yield for the area; either an underpriced asset or a hidden risk that comps aren't pricing in. Stress-test before assuming the spread holds.
Location & tenants
- Location reads 82/100 on livability (#138 in PA, #1,122 nationally) — a professional / high-income tenant draw. Strengths: amenities A+, cost of living A+, housing A+; Watch: commute F.
- Bethlehem Area SD (urban): math 31% / reading 49% proficiency, ranked #342 of 539 in PA (top 64%) — families likely to look elsewhere, expect single-tenant / working-renter base with shorter leases.
- Zoned schools: William Penn El Sch (math 34% / reading 54%, grade F, #815 of 1,518 statewide, top 56%, 239 students, 72% FRL); Northeast Ms (math 12% / reading 47%, grade F, #385 of 512 statewide, top 76%, 725 students, 75% FRL); Liberty Hs (math 36% / reading 10%, grade F, #382 of 437 statewide, top 87%, 2,640 students, 50% FRL) — zoned schools average 66% FRL vs 43% district-wide (23 pts higher); higher-poverty schools than district average — tighter screening recommended.
- Market conditions: Rents flat; 105 active listings in the ZIP; 40 comparable units currently listed for rent nearby; rentals at typical pace (median 16d on market — plan ~3-4 weeks tenant-placement turnaround); solid renter incomes; 567 units permitted in Northampton County in 2024 (151 in 5+ unit buildings).
- This rent runs 35% of the median local income ($75k/yr) — at the standard rent-burdened threshold; future hikes will face affordability resistance.
Forward outlook
- Local home prices are declining (-3.0%/yr); year-one equity from $2k of loan paydown is wiped out by about $8k of value loss. Plan a longer hold.
Negotiation context
- Only 7 days on market — expect competitive offers; lowballing is unlikely to land.
Risks & watch-outs
- Watch-outs: built in 1900 — expect roof / HVAC / electrical / plumbing capex.
- Climate carrying-cost: extreme-heat days projected 7→15/yr by 2055 (HVAC capex compounding) — expect insurance premiums to compound above CPI over the hold.
Questions for the listing agent
- Built in 1900 — when were the roof, HVAC, electrical panel, plumbing, and water heater last replaced?
- Is there a deadline driving the sale (1031 exchange, divorce, estate, relocation)? That informs how much negotiation room exists.
- Schools are B-rated — typically a magnet for longer-tenancy family renters. What's the average tenant stay here, and is there a school-zone premium baked into asking?
- The area grade is low — what's the realistic commute time and amenity access for the typical tenant pool here? Any planned neighborhood developments (good or bad) we should know about?
- What's the average days-on-market for RENTAL listings here right now (not sales)? A rising rental-DOM trend means longer vacancies and softer asking-rent achievability than the comps imply.
- What's the recent tenant-quality profile in this submarket — average credit score on applications, eviction rate, late-payment / NSF rate, and stable-employment percentage? A property-management company in the area should have these aggregated.
- How much new for-sale + rental construction is in the pipeline within 1–3 miles? Heavy new supply typically softens prices + rents 12–24 months out; constrained supply supports both.
Investment metrics
- 1% rule
- 0.88% ✗
- Cap rate
- 6.79%
- Cash-on-cash
- 1.77%
- DSCR
- 1.08
- GRM
- 9.4
CMA / ARV
- ARV (on-the-fly)
- $252,434
- Comps found
- 12
Show comp detail 12 sales within ~0.75 mi
| Address | Dist | Beds/Ba | Sqft | Sold | Price | $/sf | Match |
|---|---|---|---|---|---|---|---|
| 1136 N New St | 0.30mi | 3/1.0 | 1,296 (-7%) | 4mo | $232,500 | $179 | 72 |
| 1409 Lorain Ave | 0.35mi | 3/1.0 | 1,269 (-8%) | 3mo | $205,000 | $162 | 67 |
| 131 E Walnut St | 0.63mi | 3/1.0 | 1,372 (-1%) | 6mo | $200,000 | $146 | 64 |
| 47 W Goepp St | 0.19mi | 3/1.5 | 1,184 (-15%) | 4mo | $195,000 | $165 | 61 |
| 20 W Raspberry St | 0.38mi | 3/1.0 | 1,243 (-10%) | 5mo | $235,000 | $189 | 61 |
| 1417 Lorain Ave | 0.36mi | 3/1.5 | 1,220 (-12%) | 4mo | $280,000 | $230 | 58 |
| 1405 Lorain Ave | 0.35mi | 3/1.5 | 1,220 (-12%) | 4mo | $275,000 | $225 | 58 |
| 42 E Wall St | 0.66mi | 3/1.5 | 1,474 (+6%) | 2mo | $376,600 | $255 | 55 |
| 1507 High St | 0.63mi | 3/2.5 | 1,440 (+4%) | 4mo | $325,000 | $226 | 55 |
| 828 Center St | 0.43mi | 4/1.0 (+1) | 1,539 (+11%) | 6mo | $274,900 | $179 | 52 |
| 315 E North St | 0.75mi | 3/1.0 | 1,536 (+11%) | 2mo | $205,000 | $133 | 46 |
| 212 E North St | 0.62mi | 4/2.0 (+1) | 1,557 (+12%) | 3mo | $284,000 | $182 | 39 |
Match score weights: distance 35% · size 25% · config 20% · recency 20%. Top-matched comps best support the ARV.
Projected returns pro-forma
-3.0% appreciation · 0.85% rent growth · sell at horizon
- IRR
- -15.8%
- Equity multiple
- 0.45×
- Total profit
- $-38,621
- Equity at exit
- $37,276
- IRR
- -11.5%
- Equity multiple
- 0.38×
- Total profit
- $-43,625
- Equity at exit
- $21,615
Cash invested: $70,000 (down + closing). Projections, not guarantees.
Landlord ↔ Tenant lean methodology
- Overall (STATE)
- 62 Landlord-Friendly
- State Pennsylvania
- 62 Landlord-Friendly · EVEN
- County
- — inherits STATE
- City
- — inherits STATE
ZIP-level market 18018
- Rents YoY
- 0.8%
- Active inventory
- 105
- Price-to-rent
- 9.4×
Monthly cashflow live
- Estimated rent
- $2,212 high interval (Pro) →
- Mortgage (P&I)
- −$1,311
- Tax from tax record
- −$229 /mo · $2,743/yr
- Insurance
- −$104
- HOA
- −$0
- Vacancy / Maint / Mgmt
- −$464
- Net cashflow
- $104
Break-even live
Sensitivity live
| Price | -10% $245 | -5% $174 | +0% $104 | +5% $33 | +10% $-38 |
|---|---|---|---|---|---|
| Rent | -10% $-71 | -5% $16 | +0% $104 | +5% $191 | +10% $278 |
| Rate | -1.0pp $229 | -0.5pp $167 | base $104 | +0.5pp $39 | +1.0pp $-27 |
UW: 25.0% down · 7.5% · 30yr · 1.5% tax · 5.0% vac · 8.0% maint · 8.0% mgmt
Financing live
Cash to close
- Down payment
- $62,500
- Closing costs
- $7,500
- Reserves months
- —
- Total cash needed
- —
Loan-product check · same deal, 3 products live
Conventional
25% down · 7.5% · 30yr
- Down + closing
- —
- Monthly P&I
- —
- Monthly cashflow
- —
- DSCR
- —
- Eligible?
- —
Personal DTI + credit; lowest rate.
DSCR
20% down · 8.5% · 30yr
- Down + closing
- —
- Monthly P&I
- —
- Monthly cashflow
- —
- DSCR
- —
- Eligible?
- —
No personal income docs; deal must DSCR.
Hard money
10% down · 12.0% · 12mo
- Down + closing
- —
- Monthly P&I
- —
- Monthly cashflow
- —
- DSCR
- —
- Eligible?
- —
Short-term bridge; refi at stabilization.
Rent comps 40 comps
| Address | Beds | Baths | Sqft | Rent | $/sqft | DOM | Units | Dist |
|---|---|---|---|---|---|---|---|---|
| 124 W Union Blvd Unit 214 Bethlehem, PA | 2.0 | 2.0 | 1000 | $2,120 | $2.12 | 25d | 1 | 0.18mi |
| 47 W Goepp St Bethlehem, PA | 3.0 | 1.5 | 1184 | $1,995 | $1.68 | 4d | 1 | 0.20mi |
| 68 W Union Blvd Bethlehem, PA | 4.0 | 1.5 | 1804 | $2,295 | $1.27 | 16d | 1 | 0.22mi |
| 50 W Garrison St Unit 1 Bethlehem, PA | 2.0 | 1.0 | 900 | $1,395 | $1.55 | 4d | 1 | 0.28mi |
| 1136 N New St Bethlehem, PA | 3.0 | 1.0 | 1296 | $2,300 | $1.77 | 4d | 1 | 0.30mi |
| 56 W North St Bethlehem, PA | 2.0 | 2.0 | 1486 | $2,400 | $1.62 | 16d | 1 | 0.32mi |
| 1320 Chelsea Ave Bethlehem, PA | 3.0 | 2.0 | 1373 | $2,349 | $1.71 | 16d | 1 | 0.41mi |
| 1320 Chelsea Ave Bethlehem, PA | 3.0 | 2.0 | 1373 | $2,395 | $1.74 | 4d | 1 | 0.41mi |
| 69 E Goepp St Bethlehem, PA | 3.0 | 1.0 | 1100 | $2,150 | $1.95 | 4d | 1 | 0.41mi |
| 55 E Elizabeth Ave Unit 1 Bethlehem, PA | 2.0 | 2.0 | 1184 | $2,250 | $1.90 | 46d | 1 | 0.42mi |
| 122 E Goepp St Unit 1 Bethlehem, PA | 3.0 | 1.0 | 1137 | $1,895 | $1.67 | 4d | 1 | 0.47mi |
| 129 E Goepp St Bethlehem, PA | 3.0 | 2.0 | 1648 | $2,600 | $1.58 | 4d | 1 | 0.49mi |
| 1532 N New St Unit B Bethlehem, PA | 2.0 | 1.5 | 1100 | $1,845 | $1.68 | 4d | 1 | 0.53mi |
| 517 Schaffer St Bethlehem, PA | 2.0 | 1.0 | 1200 | $1,900 | $1.58 | 4d | 1 | 0.58mi |
| 34 E Washington Ave Bethlehem, PA | 2.0 | 1.0 | 1100 | $2,000 | $1.82 | 25d | 1 | 0.59mi |
| 30 E Market St Apt 1 Bethlehem, PA | 2.0 | 1.0 | 1200 | $1,950 | $1.62 | 45d | 1 | 0.60mi |
| 229 E Union Blvd Unit 1st Floor Bethlehem, PA | 2.0 | 1.0 | 1000 | $1,675 | $1.68 | 4d | 1 | 0.61mi |
| 229 E Union Blvd Unit 2nd Floor Bethlehem, PA | 2.0 | 1.0 | 982 | $1,595 | $1.62 | 4d | 1 | 0.61mi |
| 42 E Wall St Bethlehem, PA | 4.0 | 1.0 | 1474 | $2,550 | $1.73 | 25d | 1 | 0.66mi |
| 320 2nd Ave Bethlehem, PA | 3.0 | 1.0 | 1024 | $1,950 | $1.90 | 4d | 1 | 0.69mi |
| 326 E Frankford St Bethlehem, PA | 2.0 | 2.0 | 1250 | $2,300 | $1.84 | 45d | 1 | 0.71mi |
| 326 E Frankford St Bethlehem, PA | 2.0 | 2.0 | 1250 | $2,300 | $1.84 | 25d | 1 | 0.71mi |
| 746 Linden St Unit 2 Bethlehem, PA | 3.0 | 1.0 | 1008 | $1,975 | $1.96 | 45d | 1 | 0.71mi |
| 316 E Union Blvd Bethlehem, PA | 4.0 | 2.0 | 1460 | $2,145 | $1.47 | 45d | 1 | 0.73mi |
| 1214 Maple St Bethlehem, PA | 3.0 | 1.0 | 1462 | $2,000 | $1.37 | 45d | 1 | 0.78mi |
| 239 E Church St Bethlehem, PA | 3.0 | 2.5 | 1724 | $2,950 | $1.71 | 25d | 1 | 0.86mi |
| 417 Linden St Bethlehem, PA | 3.0 | 1.5 | 1699 | $2,450 | $1.44 | 4d | 1 | 0.88mi |
| 822 Elm St Bethlehem, PA | 3.0 | 1.5 | 1406 | $2,195 | $1.56 | 16d | 1 | 0.88mi |
| 802 Elm St Bethlehem, PA | 4.0 | 1.5 | 1520 | $2,800 | $1.84 | 23d | 1 | 0.89mi |
| 1210 Eaton Ave #201 Bethlehem, PA | 2.0 | 2.0 | 1350 | $2,350 | $1.74 | 45d | 1 | 0.91mi |
| 537 Goepp Cir Unit B Bethlehem, PA | 3.0 | 1.5 | 1225 | $1,895 | $1.55 | 45d | 1 | 0.91mi |
| 565 W Lehigh St Bethlehem, PA | 1.0–2.0 | 1.0–2.0 | 875 | $1,950 | $2.23 | 45d | 1 | 0.92mi |
| 1345 Martin Ct Bethlehem, PA | 1.0–2.0 | 1.0–2.0 | 1184 | $2,370 | $2.00 | 4d | 8 | 0.95mi |
| 409 E Washington Ave Bethlehem, PA | 4.0 | 1.5 | 1650 | $2,645 | $1.60 | 4d | 1 | 0.97mi |
| 11 W 2nd St Bethlehem, PA | 2.0 | 2.0 | 1620 | $2,550 | $1.57 | 25d | 4 | 1.01mi |
| 328 Carver Dr Unit A Bethlehem, PA | 2.0 | 2.0 | 1466 | $2,050 | $1.40 | 45d | 1 | 1.01mi |
| 650 E North St Bethlehem, PA | 2.0 | 1.0–2.0 | 935 | $2,350 | $2.51 | 16d | 7 | 1.13mi |
| 311 E 3rd St Bethlehem, PA | 2.0 | 2.0 | 1189 | $2,330 | $1.96 | 4d | 3 | 1.18mi |
| 754 E Washington Ave Bethlehem, PA | 3.0 | 2.0 | 1200 | $1,900 | $1.58 | 45d | 1 | 1.19mi |
| 1411 Greenview Dr Unit 17 Bethlehem, PA | 2.0 | 2.5 | 1400 | $2,500 | $1.79 | 25d | 1 | 1.23mi |
Listing history 1 events
-
2026-05-20$250,000 Active
ⓘ Source: listings_history table (triggers on properties + properties_extension) + one-shot
backfill from property_details.listing_events for pre-trigger history.
Tax reassessment forecast PA · Partial reset (capped growth)
- Current annual tax
- $2,743 · $229/mo
- Projected year-2 tax
- $3,346 · $279/mo
- Expected delta
- +$604/yr (+$50/mo · 22.0%)
ⓘ Screening estimate from a state-policy table — verify with the county assessor before closing.
Climate risk First Street
- Flood 1/10 Low FEMA zone X (unshaded) · 0% chance over 30 yrs
- Wildfire 2/10 Low
- Heat 5/10 Major 7 d/yr ≥99°F today · 15 d/yr by 30 yrs out
- Wind 4/10 Moderate 15% chance of damaging wind over 30 yrs
- Air quality 4/10 Moderate 3 unhealthy d/yr today · 6 by 30 yrs out
Nearby sold comps map
Loading sold comps map…
Walkable amenities ~0.75 mi
Loading nearby amenities…
Taxation est. · year 1
- Rental income
- $26,541
- − Mortgage interest
- −$14,004
- − Property taxes
- −$2,743
- − Insurance
- −$1,250
- − Repairs & maintenance
- −$2,123
- − Management
- −$2,123
- − Depreciation
- −$7,273
- Taxable loss
- −$2,975
- Est. tax savings @ 24.0%
- +$714
- After-tax cash flow
- $1,956/yr
For passive investors: Depreciation is non-cash, so a rental often shows a tax loss while cash-flowing — sheltering income. Rental losses are passive: they offset passive income freely, and up to $25,000/yr can offset ordinary (W-2) income if you actively participate and your MAGI is under $100k (phasing out to $0 by $150k); unused losses carry forward. On sale, claimed depreciation is recaptured at up to 25%, and gains may owe capital-gains tax (a 1031 exchange can defer both). Figures are a year-1 estimate at your 24.0% rate — not tax advice; consult a CPA.
Schools (NCES district)
- District
- Bethlehem Area SD
- NCES district ID
- 4203570
- Math proficiency
- 31% ▼ -2.00%
- Reading proficiency
- 49% ▼ -6.00%
- Median HH income
- $55,124
- Composite
- 34.92/100
- National rank
- #5068
- State rank
- #342 of 539 in PA
Livability — Bethlehem
- Score
- 82/100
- State rank
- #138
- US rank
- #1122
Category grades
Schools grade is shown separately in the Schools card above.
Census & demographics
- Census place
- Bethlehem, PA
- County
- Lehigh County · 333,019 people
- City population
- 129,661
- Metro
- Allentown-Bethlehem-Easton, PA-NJ
- Population (ZIP)
- 32,965
- Household income
- $75,417
- Rent vs Own
- Severe rent burden
- 1361.0
Population outlook (Northampton County) Hauer SSP2
- Today (2025)
- 312,227 people
- By 2030
- 314,769 · +0.8%
- By 2040
- 316,914 · +1.5%
- By 2050
- 318,037 · +1.9%
- By 2075
- 334,003 · +7.0%
- By 2100
- 344,696 · +10.4%
Race, ethnicity, and origin ACS 2023
- Neighborhood character
- Majority White (65%)
- Race & ethnicity
- White 65% Hispanic / Latino 24% Two or more races 10% Black 6% Asian 2%
- Hispanic origin (detail)
- Mexican 2% Puerto Rican 14% Dominican 3%
- Common ancestry
- Romanian 4% Italian 2% Polish 2%
- Foreign-born
- 9% · Canada, Jamaica, China
- Languages at home
- 81% English-only · Spanish 15% Other Indo-European 2%
Political lean MEDSL · Northampton
- 2024 margin
- Toss-up / Even · D 48.6% · R 50.4%
- 2008→2024 swing
- -14.1pp toward R · 2008: 12.3pp · 2024: -1.8pp
- All cycles
- 2024: R+1.8 2020: D+0.7 2016: R+3.8 2012: D+4.6 2008: D+12.3
Not yet ingested
- Civics
- —
Market trends
- HPI YoY
- ▼ -211.46%
- Current HPI
- 301.1699
- Rent YoY
- ▲ 0.85%
- Metro
- Allentown-Bethlehem-Easton, PA-NJ
- State GDP YoY
- ▲ 1.68%
- F500 in state
- 34
Industry mix (Fortune 500 HQ in PA)
| Industry | F500 HQs | Revenue |
|---|---|---|
| Healthcare | 2 | $309B |
|
||
| Insurance | 2 | $27B |
|
||
| Telecommunications / Media | 1 | $124B |
|
||
| Industrial Distribution | 1 | $22B |
|
||
| Financial Services | 1 | $20B |
|
||
| Chemicals / Materials | 1 | $18B |
|
||
Price history
1 event — show timeline
- 2026-05-20 Listed $250,000 GLVRMLS
Property tax history
+1.5%/yrLatest (2026): $2,743 · +3.5% YoY. Source: county tax records.
Cash-flow waterfall
monthlySold comps — $/sqft
last 12 mo · ≤1 miLoading sold comps…