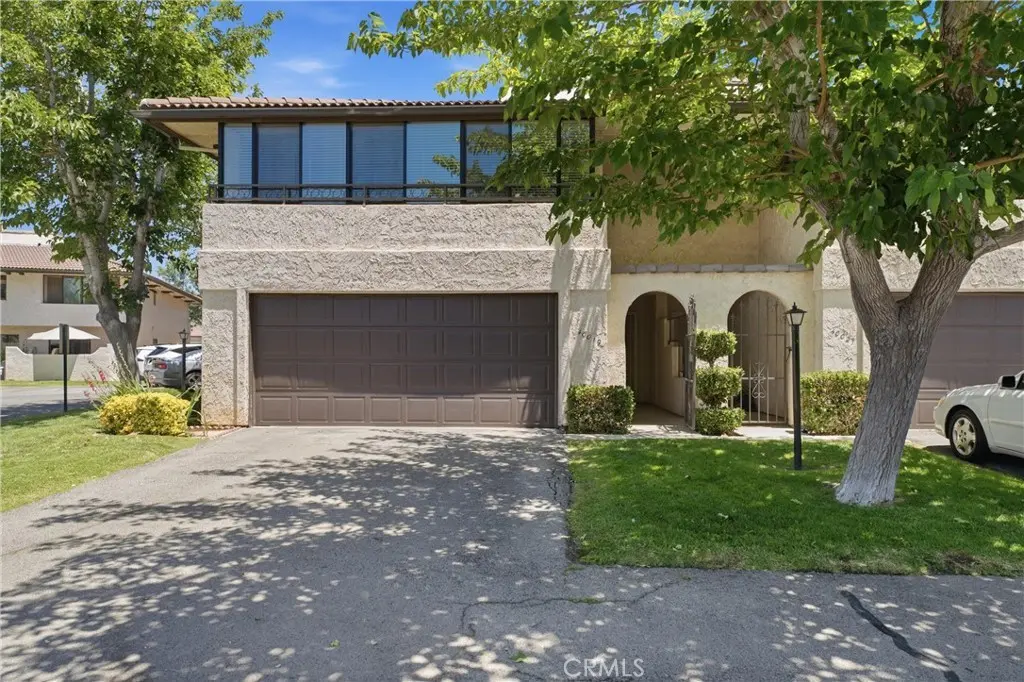
40019 Bluebird Ln · Palmdale, CA
Flood risk 1/10 · Minimal
- FEMA flood zone
- X (unshaded)
- Chance of flooding over 30 yrs
- 0.0%
- Est. flood insurance / yr
- $507 – $1,088
Fire risk 7/10 · Major
- Est. fire insurance / yr
- $659 – $1,223
Heat risk 6/10 · Moderate
- Hot days now (above 101°F)
- 4 days/yr
- Hot days in 30 yrs
- 11 days/yr
Wind risk 1/10 · Minimal
- Chance of severe wind over 30 yrs
- —
Air-quality risk 10/10 · Severe
- Unhealthy air days now
- 25 days/yr
- Unhealthy air days in 30 yrs
- 29 days/yr
Risk factors via First Street. Map © Google.
Why this score? — see what drove the D+ grade
The composite is a weighted blend of 9 inputs, each scored 0–100. Each bar is that input's sub-score; the figure is the points it added to the 100-point composite (weight × sub-score).
- Cash flow +18.2/30.0
- ARV discount +7.5/15.0
- DSCR +5.7/10.0
- 1% rule +5.6/10.0
- Rent growth +3.1/5.0
- Livability +2.8/5.0
- Schools +2.5/10.0
- Condition / age +2.5/5.0
- Appreciation +0.0/10.0
$390,000
🖨 Deal sheet 📄 Offer letter ✓ Due diligence
Listing remarks MLS
Beautiful and spacious condo located in the desirable Country Club community on a quiet tree-lined street. Designed for comfortable low-maintenance living, this home features a private patio with security screen door, gas and wood-burning fireplace, central vacuum system, solar tube, and abundant storage throughout. Updated kitchen counters and baths complement the newer wood laminate flooring and carpet. Newer oven, dishwasher, and garage door opener add convenience. Impressive alabaster lamp included. All bedrooms feature walk-in closets and balcony sunrooms. Oversized bathrooms offer generous storage, and upstairs baths include heat lamps. The HVAC system is 5 years old with newer ducting and ceiling fans add to the climate comfort. Monthly HOA fee of $425 includes water, exterior and roof maintenance, landscaping, pest control, and private security services. Washer, dryer, dining table, and refrigerator are available for purchase separately. Excellent opportunity to own a spacious condo with extensive HOA-covered amenities and maintenance.
Key facts
- Security screen door
- Private patio
- Solar tube
Tags
Property features AI
Finance
- Other: Common wall with one adjacent unit; Living area and lot info sourced from assessor; Paved road access
- HOA & community: Part of Antelope Valley HOA; Monthly association fee of $425; HOA provides front yard maintenance, grounds maintenance, pest control, and security; Community has 106 units; Street lighting
Exterior
- Parking: Attached garage; Two garage spaces; Front entry garage with two doors; Two total parking spaces
- Security: Community security (HOA amenity)
- Utilities: Public sewer; District/public water; Natural gas connected; Electricity connected; Sewer connected; Water connected
- Home design: House (attached property / condominium); Two stories; Entry level 1
- Construction: Stucco construction; Tile roof; Concrete slab foundation; Built year source: Assessor
- Exterior features: Patio; Landscaped yard; Rectangular lot shape; Lawn; Stucco and wrought-iron fencing; Has view
Interior
- Kitchen: Garbage disposal; Gas range; Gas oven; Dishwasher; Breakfast counter/bar; Tile countertops
- Bedrooms: No main-level bedrooms
- Flooring: Tile; Carpet; Laminate
- Bathrooms: One full bath; One three-quarter bath; One half bath; Shower in tub and separate shower
- Heating & cooling: Central cooling; Natural gas heating; Central furnace
- Interior features: Ceiling fan; Tile counters; Two levels; Front door entry
- Laundry & utility: Laundry inside
Neighborhood map
What this means for you Summary
Snapshot
- This is a 3-bed/3.0-bath condo listed at $390k.
Deal economics
- At list price, monthly cash flow is $351 ($4k/yr) — positive.
- The deal already cash-flows at list — no discount required.
- Meets the 1% rule at list price ($4k rent vs $390k).
- Cap rate 7.4% vs local median 4.5% in Palmdale — top-decile yield for the area; either an underpriced asset or a hidden risk that comps aren't pricing in. Stress-test before assuming the spread holds.
Location & tenants
- Location reads 55/100 on livability (#861 in CA) — a working-class tenant base; expect higher turnover. Strengths: housing A+; Watch: schools F, crime F, amenities F.
- Palmdale Elementary (suburban): math 20% / reading 31% proficiency, ranked #1,147 of 1,400 in CA (top 82%) — low school quality limits family demand, transient renter base, plan for 1-2y turnover; 69% free/reduced lunch — lower-income household profile, screen leases tightly.
- Market conditions: Rents rising (+2.3%/yr); 387 active listings in the ZIP; 6 comparable units currently listed for rent nearby; rentals leasing fast (median 1d on market — plan ~1-2 weeks tenant-placement turnaround); high-income renter base; 19,697 units permitted in Los Angeles County in 2024 (9,426 in 5+ unit buildings).
- This rent runs 41% of the median local income ($120k/yr) — at the standard rent-burdened threshold; future hikes will face affordability resistance.
Forward outlook
- Local home prices are declining (-3.0%/yr); year-one equity from $3k of loan paydown is wiped out by about $12k of value loss. Plan a longer hold.
- Los Angeles County population projected at +9% by 2050 — modest demand growth; plan on rents tracking national, not racing it.
Negotiation context
- Only 6 days on market — expect competitive offers; lowballing is unlikely to land.
- 3 sale attempts since 25y ago with the ask held roughly flat each time — persistent listings suggest the price (not the market) is what's stuck; bring a comps-based counter.
- Current owner paid $335k; 16% above their basis — modest negotiation headroom, anchor on the comps not their cost.
Risks & watch-outs
- Climate carrying-cost: major wildfire risk; extreme-heat days projected 4→11/yr by 2055 (HVAC capex compounding) — expect insurance premiums to compound above CPI over the hold.
Questions for the listing agent
- What does the HOA fee cover, when was the last increase, and are there any pending special assessments or reserve-fund shortfalls?
- Any open or pending special assessments — roof, HVAC, plumbing, elevator, façade? What's the per-unit balance and payoff schedule, and is the seller paying it off at close or rolling it to the buyer?
- Is there a deadline driving the sale (1031 exchange, divorce, estate, relocation)? That informs how much negotiation room exists.
- Schools are F-rated, which usually means shorter tenancies and higher turnover. Who's the typical renter profile here, and what's been the actual vacancy rate?
- Crime grade is F in this area — have there been break-ins, vandalism, or insurance claims at this property in the last 3 years? What carrier currently insures it and at what premium?
- The area grade is low — what's the realistic commute time and amenity access for the typical tenant pool here? Any planned neighborhood developments (good or bad) we should know about?
- What's the average days-on-market for RENTAL listings here right now (not sales)? A rising rental-DOM trend means longer vacancies and softer asking-rent achievability than the comps imply.
- What's the recent tenant-quality profile in this submarket — average credit score on applications, eviction rate, late-payment / NSF rate, and stable-employment percentage? A property-management company in the area should have these aggregated.
- How much new apartment / multifamily construction is in the pipeline within 1–3 miles? Heavy new supply (>2% of stock underway) typically softens rents 12–24 months out; light construction supports rent growth.
Investment metrics
- 1% rule
- 1.06% ✓
- Cap rate
- 7.37%
- Cash-on-cash
- 3.86%
- DSCR
- 1.17
- GRM
- 7.9
CMA / ARV
No comps found within radius.
Projected returns pro-forma
-3.0% appreciation · 2.29% rent growth · sell at horizon
- IRR
- -11.1%
- Equity multiple
- 0.60×
- Total profit
- $-43,578
- Equity at exit
- $58,150
- IRR
- -2.8%
- Equity multiple
- 0.81×
- Total profit
- $-20,218
- Equity at exit
- $33,720
Cash invested: $109,200 (down + closing). Projections, not guarantees.
Landlord ↔ Tenant lean methodology
- Overall (STATE)
- 18 Strongly Tenant-Friendly
- State California
- 18 Strongly Tenant-Friendly · D+13
- County
- — inherits STATE
- City
- — inherits STATE
ZIP-level market 93551
- Home prices YoY
- -30.3%
- Rents YoY
- 2.3%
- Active inventory
- 387
- Price-to-rent
- 7.9×
Monthly cashflow live
- Estimated rent
- $4,123 high interval (Pro) →
- Mortgage (P&I)
- −$2,045
- Tax from tax record
- −$274 /mo · $3,284/yr
- Insurance
- −$162
- HOA
- −$425
- Vacancy / Maint / Mgmt
- −$866
- Net cashflow
- $351
Break-even live
UW: 25.0% down · 7.5% · 30yr · 1.5% tax · 5.0% vac · 8.0% maint · 8.0% mgmt
Financing live
Cash to close
- Down payment
- $97,500
- Closing costs
- $11,700
- Reserves months
- —
- Total cash needed
- —
Loan-product check · same deal, 3 products live
Conventional
25% down · 7.5% · 30yr
- Down + closing
- —
- Monthly P&I
- —
- Monthly cashflow
- —
- DSCR
- —
- Eligible?
- —
Personal DTI + credit; lowest rate.
DSCR
20% down · 8.5% · 30yr
- Down + closing
- —
- Monthly P&I
- —
- Monthly cashflow
- —
- DSCR
- —
- Eligible?
- —
No personal income docs; deal must DSCR.
Hard money
10% down · 12.0% · 12mo
- Down + closing
- —
- Monthly P&I
- —
- Monthly cashflow
- —
- DSCR
- —
- Eligible?
- —
Short-term bridge; refi at stabilization.
Rent comps 6 comps
| Address | Beds | Baths | Sqft | Rent | $/sqft | DOM | Units | Dist |
|---|---|---|---|---|---|---|---|---|
| 40040 Bluebird Ln Palmdale, CA | 3.0 | 3.0 | 1966 | $4,500 | $2.29 | 1d | 1 | 0.03mi |
| 39883 Penina Way Palmdale, CA | 4.0 | 2.0 | 2005 | $3,695 | $1.84 | 4d | 1 | 0.26mi |
| 40016 11th St W Palmdale, CA | 4.0 | 2.0 | 2020 | $2,900 | $1.44 | 1d | 1 | 0.95mi |
| 39225 10th St W Unit A Palmdale, CA | 3.0 | 3.0 | 1280 | $2,695 | $2.11 | 1d | 1 | 1.32mi |
| 39225 10th St W Unit A Palmdale, CA | 3.0 | 2.5 | 1280 | $2,750 | $2.15 | 1d | 1 | 1.32mi |
| 1232 Kings Rd Palmdale, CA | 4.0 | 3.0 | 1685 | $3,250 | $1.93 | 1d | 1 | 1.35mi |
HOA detail condo
- Monthly dues
- $425 · $5,100/yr
- Likely covers
- watergaslandscapingroofsecurity
- Assessments
- None detected in remarks — confirm with the listing agent.
Listing history 6 events
-
2026-06-18days on market $390,000 Active 6 DOM
-
2026-06-17days on market $390,000 Active 5 DOM
-
2026-06-16days on market $390,000 Active 4 DOM
-
2026-06-15days on market $390,000 Active 3 DOM
-
2026-06-13remarks 699-char remark
-
2026-06-13$390,000 Active 1 DOM
ⓘ Source: listings_history table (triggers on properties + properties_extension) + one-shot
backfill from property_details.listing_events for pre-trigger history.
Tax reassessment forecast CA · Resets to sale price
- Current annual tax
- $3,284 · $274/mo
- Projected year-2 tax
- $3,284 · $274/mo
- Expected delta
- $0/yr ($0/mo · -0.0%)
ⓘ Screening estimate from a state-policy table — verify with the county assessor before closing.
Climate risk First Street
- Flood 1/10 Low FEMA zone X (unshaded) · 0% chance over 30 yrs
- Wildfire 7/10 Severe
- Heat 6/10 Major 4 d/yr ≥101°F today · 11 d/yr by 30 yrs out
- Wind 1/10 Low
- Air quality 10/10 Extreme 25 unhealthy d/yr today · 29 by 30 yrs out
Nearby sold comps map
Loading sold comps map…
Walkable amenities ~0.75 mi
Loading nearby amenities…
Taxation est. · year 1
- Rental income
- $49,478
- − Mortgage interest
- −$21,846
- − Property taxes
- −$3,284
- − Insurance
- −$1,950
- − Repairs & maintenance
- −$3,958
- − Management
- −$3,958
- − HOA
- −$5,100
- − Depreciation
- −$11,345
- Taxable loss
- −$1,964
- Est. tax savings @ 24.0%
- +$471
- After-tax cash flow
- $4,683/yr
For passive investors: Depreciation is non-cash, so a rental often shows a tax loss while cash-flowing — sheltering income. Rental losses are passive: they offset passive income freely, and up to $25,000/yr can offset ordinary (W-2) income if you actively participate and your MAGI is under $100k (phasing out to $0 by $150k); unused losses carry forward. On sale, claimed depreciation is recaptured at up to 25%, and gains may owe capital-gains tax (a 1031 exchange can defer both). Figures are a year-1 estimate at your 24.0% rate — not tax advice; consult a CPA.
Schools (NCES district)
- District
- Palmdale Elementary
- NCES district ID
- 0629580
- Math proficiency
- 20% ▲ 1.00%
- Reading proficiency
- 31% ▲ 1.00%
- Median HH income
- $48,652
- Composite
- 25.34/100
- National rank
- #12888
- State rank
- #1147 of 1400 in CA
Livability — Palmdale
- Score
- 55/100
- State rank
- #861
- US rank
- #23501
Category grades
Schools grade is shown separately in the Schools card above.
Census & demographics
- Census place
- Palmdale, CA
- County
- Los Angeles County · 9,444,647 people
- City population
- 177,644
- Metro
- Los Angeles-Long Beach-Anaheim, CA
- Population (ZIP)
- 54,360
- Household income
- $119,801
- Rent vs Own
- Severe rent burden
- 1168.0
Population outlook (Los Angeles County) Hauer SSP2
- Today (2025)
- 10,940,515 people
- By 2030
- 11,256,481 · +2.9%
- By 2040
- 11,729,929 · +7.2%
- By 2050
- 11,948,407 · +9.2%
- By 2075
- 11,818,114 · +8.0%
- By 2100
- 10,842,928 · -0.9%
Race, ethnicity, and origin ACS 2023
- Neighborhood character
- Diverse neighborhood (Simpson 0.68)
- Race & ethnicity
- Hispanic / Latino 43% White 33% Two or more races 17% Black 10% Asian 9%
- Hispanic origin (detail)
- Mexican 31%
- Common ancestry
- Russian 1% Lithuanian 1% Slovak 1%
- Foreign-born
- 22% · Canada, Vietnam, China
- Languages at home
- 61% English-only · Spanish 29% Other Indo-European 3% Tagalog/Filipino 3%
Political lean MEDSL · Los Angeles
- 2024 margin
- Solid D (+32.9) · D 64.8% · R 31.9% · Other 3.3%
- 2008→2024 swing
- -7.4pp toward R · 2008: 40.4pp · 2024: 32.9pp
- All cycles
- 2024: D+32.9 2020: D+44.2 2016: D+48.0 2012: D+40.0 2008: D+40.4
Not yet ingested
- Civics
- —
Market trends
- HPI YoY
- ▼ -142.22%
- Current HPI
- 327.1791
- Rent YoY
- ▲ 2.29%
- Metro
- Los Angeles-Long Beach-Anaheim, CA
- State GDP YoY
- ▲ 3.21%
- F500 in state
- 116
Industry mix (Fortune 500 HQ in CA)
| Industry | F500 HQs | Revenue |
|---|---|---|
| Technology | 27 | $1,492B |
|
||
| Financial Services | 3 | $174B |
|
||
| Retail | 3 | $44B |
|
||
| Insurance | 3 | $26B |
|
||
| Media / Entertainment | 2 | $115B |
|
||
| Pharmaceuticals / Biotech | 2 | $62B |
|
||
Price history
+231.9% since first listed7 events — show timeline
- 2026-06-12 Listed $390,000 CRMLS
- 2026-06-12 Listed $390,000 AVMLS
- 2006-01-31 Sold (Public Records) $335,000 Public Records
- 2001-10-31 Sold (Public Records) $147,000 Public Records
- 2001-10-31 Sold (MLS) $146,900 AVMLS
- 2001-09-06 Listed $146,900 AVMLS
- 1981-12-17 Sold (Public Records) $117,500 Public Records
Property tax history
-0.3%/yrLatest (2025): $3,284 · +7.6% YoY. Source: county tax records.
Cash-flow waterfall
monthlySold comps — $/sqft
last 12 mo · ≤1 miLoading sold comps…