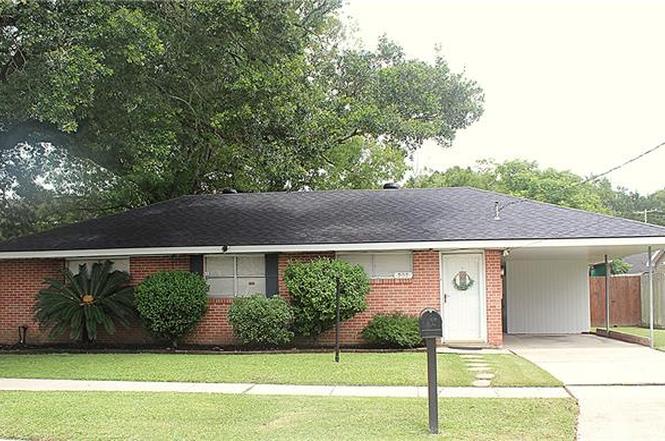
909 Barnes St · Bridge City, LA
Flood risk No data
- FEMA flood zone
- —
- Chance of flooding over 30 yrs
- —
- Est. flood insurance / yr
- —
Fire risk No data
- Est. fire insurance / yr
- —
Heat risk No data
- Hot days now (above threshold)
- —
- Hot days in 30 yrs
- —
Wind risk No data
- Chance of severe wind over 30 yrs
- —
Air-quality risk No data
- Unhealthy air days now
- —
- Unhealthy air days in 30 yrs
- —
Risk factors via First Street. Map © Google.
Why this score? — see what drove the C grade
The composite is a weighted blend of 9 inputs, each scored 0–100. Each bar is that input's sub-score; the figure is the points it added to the 100-point composite (weight × sub-score).
- Cash flow +24.6/30.0
- ARV discount +8.7/15.0
- DSCR +7.9/10.0
- 1% rule +5.3/10.0
- Livability +3.1/5.0
- Schools +2.5/10.0
- Condition / age +2.5/5.0
- Rent growth +2.3/5.0
- Appreciation +0.0/10.0
$159,000
🖨 Deal sheet 📄 Offer letter ✓ Due diligence
Listing remarks MLS
Cozy, move in ready home! This precious home has it all, great looks at an affordable price! Back yard is a dream, lovely shaded, covered patio to have your morning coffee, or summer evening meal. Beautiful, lush backyard. Updated kitchen and bathroom. Neutral colors throughout the home. Great storage, 2 bedrooms with double closets, large linen/pantry closet, and another large storage closet in hall. Shed had electricity, and great storage. Covered patio assures you will never get wet when entering your new home. House is near restaurants, groceries, and shopping. Few short blocks from the levee and five minutes from the Huey P Long. Hurry and see this great home!
Key facts
- Great storage
- Shed had electricity
- Back yard
Tags
Property features AI
Exterior
- Parking: Covered carport with three or more spaces
- Utilities: Public water; Public sewer
- Home design: Single-story home; Brick construction; Updated within the last 5 years; Slab foundation
- Construction: Asphalt shingle roof
- Exterior features: Fenced yard; Covered oversized patio or porch; Shed(s)
Interior
- Kitchen: Range; Refrigerator
- Bathrooms: One full bathroom
- Heating & cooling: Central heating; Central air conditioning; Attic fan
- Interior features: Ceiling fans; Pantry
- Laundry & utility: Washer; Dryer
Neighborhood map
What this means for you Summary
Snapshot
- This is a 3-bed/1.0-bath single-family listed at $159k.
Deal economics
- At list price, monthly cash flow is $327 ($4k/yr) — positive.
- The deal already cash-flows at list — no discount required.
- Meets the 1% rule at list price ($2k rent vs $159k).
Location & tenants
- Location reads 61/100 on livability (#225 in LA) — a middle-class / working-renter tenant base. Strengths: cost of living A+, housing A+; Watch: schools D+, crime F, amenities F.
- Jefferson Parish (suburban): math 24% / reading 34% proficiency, ranked #44 of 98 in LA (top 45%) — low school quality limits family demand, transient renter base, plan for 1-2y turnover; 70% free/reduced lunch — lower-income household profile, screen leases tightly.
- Market conditions: Rents soft (-0.8%/yr); 186 active listings in the ZIP; 7 comparable units currently listed for rent nearby; rentals at typical pace (median 24d on market — plan ~3-4 weeks tenant-placement turnaround); 43% of comp listings sitting > 30 days — soft ceiling on asking rent; 518 units permitted in Jefferson Parish in 2024 (43 in 5+ unit buildings).
- This rent runs 37% of the median local income ($54k/yr) — at the standard rent-burdened threshold; future hikes will face affordability resistance.
Forward outlook
- Local home prices are declining (-3.0%/yr); year-one equity from $1k of loan paydown is wiped out by about $5k of value loss. Plan a longer hold.
Negotiation context
- Only 2 days on market — expect competitive offers; lowballing is unlikely to land.
- 4 sale attempts since 15y ago with the ask held roughly flat each time — persistent listings suggest the price (not the market) is what's stuck; bring a comps-based counter.
- Current owner paid $42k; list at $159k implies a 280% gain — meaningful room to come down on a strong offer.
Questions for the listing agent
- Built in 1971 — when were the roof, HVAC, electrical panel, plumbing, and water heater last replaced?
- Is there a deadline driving the sale (1031 exchange, divorce, estate, relocation)? That informs how much negotiation room exists.
- Schools are D-rated, which usually means shorter tenancies and higher turnover. Who's the typical renter profile here, and what's been the actual vacancy rate?
- Crime grade is F in this area — have there been break-ins, vandalism, or insurance claims at this property in the last 3 years? What carrier currently insures it and at what premium?
- What's the average days-on-market for RENTAL listings here right now (not sales)? A rising rental-DOM trend means longer vacancies and softer asking-rent achievability than the comps imply.
- What's the recent tenant-quality profile in this submarket — average credit score on applications, eviction rate, late-payment / NSF rate, and stable-employment percentage? A property-management company in the area should have these aggregated.
- How much new for-sale + rental construction is in the pipeline within 1–3 miles? Heavy new supply typically softens prices + rents 12–24 months out; constrained supply supports both.
Investment metrics
- 1% rule
- 1.03% ✓
- Cap rate
- 8.76%
- Cash-on-cash
- 8.82%
- DSCR
- 1.39
- GRM
- 8.1
CMA / ARV
- ARV (on-the-fly)
- $163,280
- Comps found
- 11
Show comp detail 11 sales within ~0.75 mi
| Address | Dist | Beds/Ba | Sqft | Sold | Price | $/sf | Match |
|---|---|---|---|---|---|---|---|
| 953 Pato St | 0.09mi | 3/1.5 | 965 (-7%) | 3mo | $135,703 | $141 | 79 |
| 705 Hooter Rd | 0.17mi | 3/2.0 | 1,115 (+7%) | 9mo | $175,000 | $157 | 68 |
| 804 Lander St | 0.18mi | 3/1.5 | 1,160 (+12%) | 2mo | $212,000 | $183 | 68 |
| 761 Lander St | 0.28mi | 3/1.0 | 1,000 (-4%) | 23mo | $126,500 | $127 | 61 |
| 748 Oak Ave | 0.32mi | 3/1.0 | 1,117 (+7%) | 15mo | $185,000 | $166 | 60 |
| 1100 Oak Ave | 0.30mi | 2/1.0 (-1) | 981 (-6%) | 18mo | $178,000 | $181 | 57 |
| 1056 Oak Ave | 0.23mi | 2/1.0 (-1) | 1,107 (+6%) | 21mo | $179,000 | $162 | 56 |
| 672 Hooter Rd | 0.23mi | 3/1.0 | 1,140 (+10%) | 22mo | $84,000 | $74 | 55 |
| 636 Oak Ave | 0.49mi | 3/2.0 | 1,100 (+6%) | 12mo | $195,000 | $177 | 53 |
| 528 Oak Ave | 0.62mi | 2/1.0 (-1) | 1,171 (+13%) | 8mo | $175,000 | $149 | 39 |
| 212 7th St | 0.61mi | 2/1.0 (-1) | 1,183 (+14%) | 10mo | $135,000 | $114 | 35 |
Match score weights: distance 35% · size 25% · config 20% · recency 20%. Top-matched comps best support the ARV.
Projected returns pro-forma
-3.0% appreciation · 0.0% rent growth · sell at horizon
- IRR
- -6.1%
- Equity multiple
- 0.78×
- Total profit
- $-9,775
- Equity at exit
- $23,707
- IRR
- -0.2%
- Equity multiple
- 0.99×
- Total profit
- $-461
- Equity at exit
- $13,747
Cash invested: $44,520 (down + closing). Projections, not guarantees.
Landlord ↔ Tenant lean methodology
- Overall (STATE)
- 90 Strongly Landlord-Friendly
- State Louisiana
- 90 Strongly Landlord-Friendly · R+12
- County
- — inherits STATE
- City
- — inherits STATE
ZIP-level market 70094
- Rents YoY
- -0.8%
- Active inventory
- 186
- Price-to-rent
- 8.1×
Monthly cashflow live
- Estimated rent
- $1,640 high interval (Pro) →
- Mortgage (P&I)
- −$834
- Tax from tax record
- −$68 /mo · $818/yr
- Insurance
- −$66
- HOA
- −$0
- Vacancy / Maint / Mgmt
- −$344
- Net cashflow
- $327
Break-even live
UW: 25.0% down · 7.5% · 30yr · 1.5% tax · 5.0% vac · 8.0% maint · 8.0% mgmt
Financing live
Cash to close
- Down payment
- $39,750
- Closing costs
- $4,770
- Reserves months
- —
- Total cash needed
- —
Loan-product check · same deal, 3 products live
Conventional
25% down · 7.5% · 30yr
- Down + closing
- —
- Monthly P&I
- —
- Monthly cashflow
- —
- DSCR
- —
- Eligible?
- —
Personal DTI + credit; lowest rate.
DSCR
20% down · 8.5% · 30yr
- Down + closing
- —
- Monthly P&I
- —
- Monthly cashflow
- —
- DSCR
- —
- Eligible?
- —
No personal income docs; deal must DSCR.
Hard money
10% down · 12.0% · 12mo
- Down + closing
- —
- Monthly P&I
- —
- Monthly cashflow
- —
- DSCR
- —
- Eligible?
- —
Short-term bridge; refi at stabilization.
Rent comps 7 comps
| Address | Beds | Baths | Sqft | Rent | $/sqft | DOM | Units | Dist |
|---|---|---|---|---|---|---|---|---|
| 769 Lander St Westwego, LA | 3.0 | 1.0 | 1150 | $1,600 | $1.39 | 43d | 1 | 0.26mi |
| 1020 Mono Ct Westwego, LA | 3.0 | 2.0 | 1400 | $1,750 | $1.25 | 43d | 1 | 0.29mi |
| 759 Oak Ave Westwego, LA | 2.0 | 1.0 | 950 | $1,225 | $1.29 | 3d | 1 | 0.34mi |
| 305 5th St Bridge City, LA | 2.0 | 1.0 | 700 | $1,250 | $1.79 | 44d | 1 | 0.47mi |
| 309 5th St Bridge City, LA | 3.0 | 2.0 | 1160 | $1,550 | $1.34 | 23d | 1 | 0.47mi |
| 1433 Utah Beach Dr Bridge City, LA | 1.0–3.0 | 1.0–1.5 | 747 | $1,150 | $1.54 | 4d | 6 | 0.56mi |
| 237 Vinet Ave New Orleans, LA | 2.0 | 1.0 | 1195 | $1,800 | $1.51 | 4d | 1 | 1.45mi |
Listing history 3 events
-
2026-06-18days on market $159,000 Active 2 DOM
-
2026-06-16remarks 674-char remark
-
2026-06-16$159,000 Active 1 DOM
ⓘ Source: listings_history table (triggers on properties + properties_extension) + one-shot
backfill from property_details.listing_events for pre-trigger history.
Tax reassessment forecast LA · Resets to sale price
- Current annual tax
- $818 · $68/mo
- Projected year-2 tax
- $874 · $73/mo
- Expected delta
- +$57/yr (+$5/mo · 6.9%)
ⓘ Screening estimate from a state-policy table — verify with the county assessor before closing.
Nearby sold comps map
Loading sold comps map…
Walkable amenities ~0.75 mi
Loading nearby amenities…
Taxation est. · year 1
- Rental income
- $19,680
- − Mortgage interest
- −$8,906
- − Property taxes
- −$818
- − Insurance
- −$795
- − Repairs & maintenance
- −$1,574
- − Management
- −$1,574
- − Depreciation
- −$4,625
- Taxable income
- $1,387
- Est. tax owed @ 24.0%
- −$333
- After-tax cash flow
- $3,596/yr
For passive investors: Depreciation is non-cash, so a rental often shows a tax loss while cash-flowing — sheltering income. Rental losses are passive: they offset passive income freely, and up to $25,000/yr can offset ordinary (W-2) income if you actively participate and your MAGI is under $100k (phasing out to $0 by $150k); unused losses carry forward. On sale, claimed depreciation is recaptured at up to 25%, and gains may owe capital-gains tax (a 1031 exchange can defer both). Figures are a year-1 estimate at your 24.0% rate — not tax advice; consult a CPA.
Schools (NCES district)
- District
- Jefferson Parish
- NCES district ID
- 2200840
- Math proficiency
- 24% ▼ -36.00%
- Reading proficiency
- 34% ▼ -30.00%
- Median HH income
- $48,421
- Composite
- 25.19/100
- National rank
- #7511
- State rank
- #44 of 98 in LA
Livability — Bridge City
- Score
- 61/100
- State rank
- #225
- US rank
- #17357
Category grades
Schools grade is shown separately in the Schools card above.
Census & demographics
- Census place
- Bridge City, LA
- County
- Jefferson Parish · 426,999 people
- Metro
- New Orleans-Metairie, LA
- Population (ZIP)
- 32,130
- Household income
- $53,597
- Rent vs Own
- Severe rent burden
- 1457.0
Population outlook (Jefferson County) Hauer SSP2
- Today (2025)
- 451,696 people
- By 2030
- 455,451 · +0.8%
- By 2040
- 458,308 · +1.5%
- By 2050
- 461,031 · +2.1%
- By 2075
- 476,351 · +5.5%
- By 2100
- 499,377 · +10.6%
Race, ethnicity, and origin ACS 2023
- Neighborhood character
- Diverse neighborhood (Simpson 0.65)
- Race & ethnicity
- Black 46% White 36% Hispanic / Latino 13% Two or more races 6% Asian 2%
- Hispanic origin (detail)
- Mexican 2% Dominican 2%
- Common ancestry
- Lithuanian 9% Scottish 1%
- Foreign-born
- 8% · Canada, Vietnam
- Languages at home
- 86% English-only · Spanish 11% Vietnamese 2% French/Haitian/Cajun 1%
Political lean MEDSL · Jefferson
- 2024 margin
- R (+12.9) · D 42.5% · R 55.5% · Other 2.1%
- 2008→2024 swing
- +13.6pp toward D · 2008: -26.6pp · 2024: -12.9pp
- All cycles
- 2024: R+12.9 2020: R+11.1 2016: R+14.8 2012: R+18.4 2008: R+26.6
Not yet ingested
- Civics
- —
Market trends
- HPI YoY
- ▼ -111.56%
- Current HPI
- 102.9992
- Rent YoY
- ▼ -0.80%
- Metro
- New Orleans-Metairie, LA
- State GDP YoY
- ▲ 3.29%
- F500 in state
- 10
Industry mix (Fortune 500 HQ in LA)
| Industry | F500 HQs | Revenue |
|---|---|---|
| Telecommunications | 2 | $23B |
|
||
| Utilities | 1 | $12B |
|
||
| Wholesale / Distribution | 1 | $5B |
|
||
| Advertising | 1 | $2B |
|
||
Price history
+279.9% since first listed5 events — show timeline
- 2026-06-15 Listed $159,000 AcadianaMLS
- 2026-06-15 Listed $159,000 GSREIN
- 2011-04-15 Listed $95,000 GSREIN
- 2011-04-15 Listed $95,000 AcadianaMLS
- 1987-02-01 Sold (Public Records) $41,850 Public Records
Property tax history
+1.9%/yrLatest (2025): $818 · +0.3% YoY. Source: county tax records.
Cash-flow waterfall
monthlySold comps — $/sqft
last 12 mo · ≤1 miLoading sold comps…