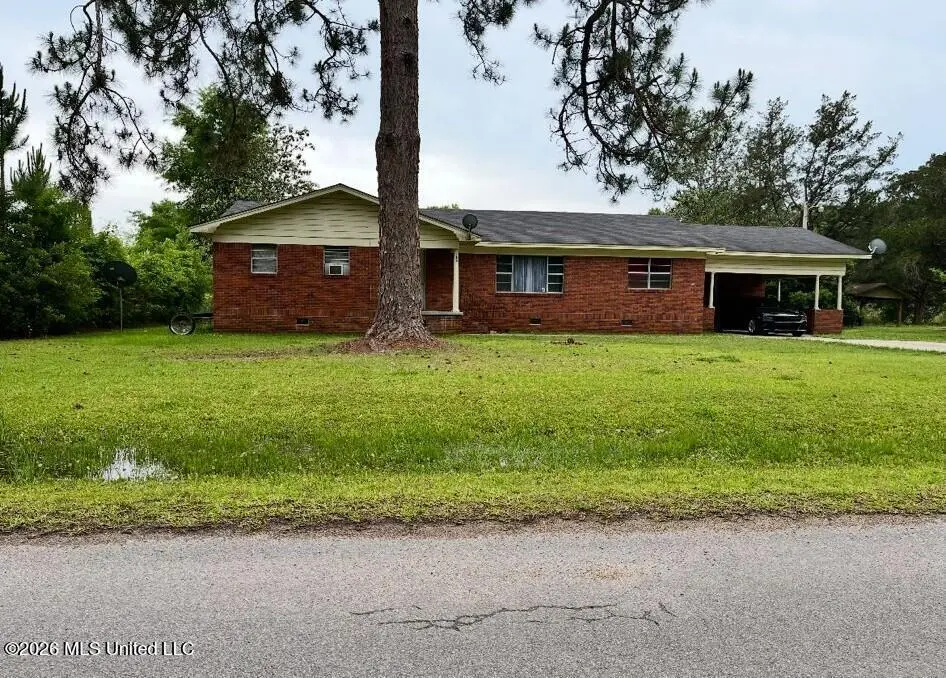
269 County Road 288 · Pachuta, MS
Flood risk No data
- FEMA flood zone
- —
- Chance of flooding over 30 yrs
- —
- Est. flood insurance / yr
- —
Fire risk No data
- Est. fire insurance / yr
- —
Heat risk No data
- Hot days now (above threshold)
- —
- Hot days in 30 yrs
- —
Wind risk No data
- Chance of severe wind over 30 yrs
- —
Air-quality risk No data
- Unhealthy air days now
- —
- Unhealthy air days in 30 yrs
- —
Risk factors via First Street. Map © Google.
Why this score? — see what drove the B- grade
The composite is a weighted blend of 9 inputs, each scored 0–100. Each bar is that input's sub-score; the figure is the points it added to the 100-point composite (weight × sub-score).
- Cash flow +29.7/30.0
- DSCR +10.0/10.0
- 1% rule +8.3/10.0
- ARV discount +7.5/15.0
- Appreciation +5.5/10.0
- Livability +3.0/5.0
- Rent growth +2.5/5.0
- Condition / age +2.2/5.0
- Schools +1.2/10.0
$75,000
🖨 Deal sheet 📄 Offer letter ✓ Due diligence
Listing remarks
Escape to the peaceful country lifestyle you've been dreaming of! This charming 2-bedroom, 1.5-bathroom home offers 1,158 sq. ft. of cozy, functional living space in the heart of Pachuta. This property combines rural tranquility with everyday comfort, featuring a wonderful layout and a serene setting. Enjoy peaceful mornings on the porch and plenty of outdoor potential. Don't miss the chance to own a slice of Mississippi countryside—schedule your private tour today!
Key facts
- Parking
- Built 1980
- Listed 2 days
Property features AI
Exterior
- Parking: Attached carport (1 space, total 1 parking)
- Utilities: Private water; Private sewer; Propane connected
- Home design: Single family residence (house); One level
- Construction: Vinyl, brick veneer and siding exterior; Brick/mortar foundation; Slab foundation; Built (year source: public records)
- Exterior features: Level lot; Wooded lot; Asphalt shingle roof
Interior
- Kitchen: Free-standing refrigerator; Oven
- Bathrooms: One full bathroom; One half bathroom (1.5 total)
- Heating & cooling: Central heating; Central air conditioning
- Interior features: Kitchen island; One room total
- Laundry & utility: Washer/Dryer included
Neighborhood map
What this means for you Summary
Snapshot
- This is a 2-bed/1.5-bath single-family listed at $75k. Condition is rated fair.
Deal economics
- At list price, monthly cash flow is $272 ($3k/yr) — positive.
- The deal already cash-flows at list — no discount required.
- Meets the 1% rule at list price ($1k rent vs $75k).
Location & tenants
- Location reads 59/100 on livability (#254 in MS) — a working-class tenant base; expect higher turnover. Strengths: cost of living A+, housing A-; Watch: schools F, amenities F, commute F.
- Quitman School District (rural): math 13% / reading 18% proficiency, ranked #106 of 130 in MS (top 82%) — low school quality limits family demand, transient renter base, plan for 1-2y turnover; 80% free/reduced lunch — lower-income household profile, screen leases tightly.
- Market conditions: 39 active listings in the ZIP.
Forward outlook
- In year one you build about $1k of equity ($519 loan paydown + $778 appreciation (1.0% local appreciation)).
- Clarke County population projected at -24% by 2050 — secular population decline; favor cash flow + early exit over multi-decade hold.
- At projected returns (1.0% appreciation + 3.0% rent growth), your $21k cash investment doubles in ~5 years — after that, you're playing with house money.
Negotiation context
- Only 3 days on market — expect competitive offers; lowballing is unlikely to land.
Questions for the listing agent
- Have any recent inspections been done? Can we get a copy of the seller's disclosures and any deferred-maintenance estimates?
- Is there a deadline driving the sale (1031 exchange, divorce, estate, relocation)? That informs how much negotiation room exists.
- Schools are F-rated, which usually means shorter tenancies and higher turnover. Who's the typical renter profile here, and what's been the actual vacancy rate?
- What's the average days-on-market for RENTAL listings here right now (not sales)? A rising rental-DOM trend means longer vacancies and softer asking-rent achievability than the comps imply.
- What's the recent tenant-quality profile in this submarket — average credit score on applications, eviction rate, late-payment / NSF rate, and stable-employment percentage? A property-management company in the area should have these aggregated.
- How much new for-sale + rental construction is in the pipeline within 1–3 miles? Heavy new supply typically softens prices + rents 12–24 months out; constrained supply supports both.
Investment metrics
- 1% rule
- 1.33% ✓
- Cap rate
- 10.65%
- Cash-on-cash
- 15.55%
- DSCR
- 1.69
- GRM
- 6.2
CMA / ARV
No comps found within radius.
Projected returns pro-forma
1.04% appreciation · 3.0% rent growth · sell at horizon
- IRR
- 17.6%
- Equity multiple
- 1.90×
- Total profit
- $18,884
- Equity at exit
- $25,750
- IRR
- 20.8%
- Equity multiple
- 3.53×
- Total profit
- $53,073
- Equity at exit
- $34,333
Cash invested: $21,000 (down + closing). Projections, not guarantees.
Landlord ↔ Tenant lean methodology
- Overall (STATE)
- 90 Strongly Landlord-Friendly
- State Mississippi
- 90 Strongly Landlord-Friendly · R+11
- County
- — inherits STATE
- City
- — inherits STATE
ZIP-level market 39347
- Home prices YoY
- 0.8%
- Active inventory
- 39
- Price-to-rent
- 6.2×
Monthly cashflow live
- Estimated rent
- $1,000 medium interval (Pro) →
- Mortgage (P&I)
- −$393
- Tax est. 1.5%
- −$94 /mo · $1,125/yr
- Insurance
- −$31
- HOA
- −$0
- Vacancy / Maint / Mgmt
- −$210
- Net cashflow
- $272
Break-even live
UW: 25.0% down · 7.5% · 30yr · 1.5% tax · 5.0% vac · 8.0% maint · 8.0% mgmt
Financing live
Cash to close
- Down payment
- $18,750
- Closing costs
- $2,250
- Reserves months
- —
- Total cash needed
- —
Loan-product check · same deal, 3 products live
Conventional
25% down · 7.5% · 30yr
- Down + closing
- —
- Monthly P&I
- —
- Monthly cashflow
- —
- DSCR
- —
- Eligible?
- —
Personal DTI + credit; lowest rate.
DSCR
20% down · 8.5% · 30yr
- Down + closing
- —
- Monthly P&I
- —
- Monthly cashflow
- —
- DSCR
- —
- Eligible?
- —
No personal income docs; deal must DSCR.
Hard money
10% down · 12.0% · 12mo
- Down + closing
- —
- Monthly P&I
- —
- Monthly cashflow
- —
- DSCR
- —
- Eligible?
- —
Short-term bridge; refi at stabilization.
Listing history 4 events
-
2026-06-19pricedays on market $75,000 Active 3 DOM
-
2026-06-18days on market $99,000 Active 2 DOM
-
2026-06-17remarks 470-char remark
-
2026-06-17$99,000 Active 1 DOM
ⓘ Source: listings_history table (triggers on properties + properties_extension) + one-shot
backfill from property_details.listing_events for pre-trigger history.
Nearby sold comps map
Loading sold comps map…
Walkable amenities ~0.75 mi
Loading nearby amenities…
Taxation est. · year 1
- Rental income
- $12,006
- − Mortgage interest
- −$4,201
- − Property taxes
- −$1,125
- − Insurance
- −$375
- − Repairs & maintenance
- −$960
- − Management
- −$960
- − Depreciation
- −$2,182
- Taxable income
- $2,202
- Est. tax owed @ 24.0%
- −$528
- After-tax cash flow
- $2,736/yr
For passive investors: Depreciation is non-cash, so a rental often shows a tax loss while cash-flowing — sheltering income. Rental losses are passive: they offset passive income freely, and up to $25,000/yr can offset ordinary (W-2) income if you actively participate and your MAGI is under $100k (phasing out to $0 by $150k); unused losses carry forward. On sale, claimed depreciation is recaptured at up to 25%, and gains may owe capital-gains tax (a 1031 exchange can defer both). Figures are a year-1 estimate at your 24.0% rate — not tax advice; consult a CPA.
Condition & rehab AI · 12 photos
This single-family home requires moderate renovations to improve its curb appeal and interior aesthetics, which would significantly increase its resale and rental value.
Repairs flagged
- Major Overgrown lawn — Needs trimming and landscaping
- Major Debris — Needs removal
- Moderate Worn wood paneling — Needs painting or replacement
- Moderate Outdated furniture — Needs replacement
- Moderate Basic appliances — Needs replacement
Value-add opportunities
- Both Landscaping and curb appeal — Enhances curb appeal and resale value
- Both Painting or replacing wood paneling — Improves interior aesthetics and resale value
- Both Replacing outdated furniture — Enhances interior aesthetics and resale value
- Both Upgrading basic appliances — Enhances functionality and resale value
Renovation cost estimate screening
| Repair item | Severity | Est. cost |
|---|---|---|
| Overgrown lawn · Needs trimming and landscaping | Major | $15,000–50,000 |
| Debris · Needs removal | Major | $15,000–50,000 |
| Worn wood paneling · Needs painting or replacement | Moderate | $3,000–15,000 |
| Outdated furniture · Needs replacement | Moderate | $3,000–15,000 |
| Basic appliances · Needs replacement | Moderate | $3,000–15,000 |
| Total estimated repair cost · 5 items | $39,000–145,000 |
Value-add ROI direction
- Both Landscaping and curb appeal — Enhances curb appeal and resale value ↑
- Both Painting or replacing wood paneling — Improves interior aesthetics and resale value ↑
- Both Replacing outdated furniture — Enhances interior aesthetics and resale value ↑
- Both Upgrading basic appliances — Enhances functionality and resale value ↑
ⓘ Cost ranges are severity-bucket heuristics (US national rule-of-thumb). Get contractor quotes + a written scope before underwriting a rehab budget.
Schools (NCES district)
- District
- Quitman School District
- NCES district ID
- 2803780
- Math proficiency
- 13% ▼ -18.00%
- Reading proficiency
- 18% ▼ -10.00%
- Median HH income
- $30,062
- Composite
- 12.26/100
- National rank
- #9646
- State rank
- #106 of 130 in MS
Livability — Pachuta
- Score
- 59/100
- State rank
- #254
- US rank
- #20329
Category grades
Schools grade is shown separately in the Schools card above.
Census & demographics
- Population (ZIP)
- 1,068
Population outlook (Clarke County) Hauer SSP2
- Today (2025)
- 14,792 people
- By 2030
- 14,085 · -4.8%
- By 2040
- 12,619 · -14.7%
- By 2050
- 11,225 · -24.1%
- By 2075
- 8,511 · -42.5%
- By 2100
- 6,820 · -53.9%
Race, ethnicity, and origin ACS 2023
- Neighborhood character
- Majority White (59%)
- Race & ethnicity
- White 59% Black 39% Two or more races 3%
- Common ancestry
- Lithuanian 3%
- Languages at home
- 99% English-only · Spanish 1%
Political lean MEDSL · Clarke
- 2024 margin
- Solid R (+35.2) · D 32.1% · R 67.3%
- 2008→2024 swing
- -10.1pp toward R · 2008: -25.1pp · 2024: -35.2pp
- All cycles
- 2024: R+35.2 2020: R+30.9 2016: R+32.8 2012: R+23.9 2008: R+25.1
Not yet ingested
- Civics
- —
Market trends
- HPI YoY
- ▲ 1.04%
- Current HPI
- 136.7456
- Rent YoY
- —
- Metro
- —
- State GDP YoY
- —
- F500 in state
- 0
Price history
1 event — show timeline
- 2026-06-16 Listed $99,000 MLSU
Cash-flow waterfall
monthlySold comps — $/sqft
last 12 mo · ≤1 miLoading sold comps…