 🏷️ Likely Rental
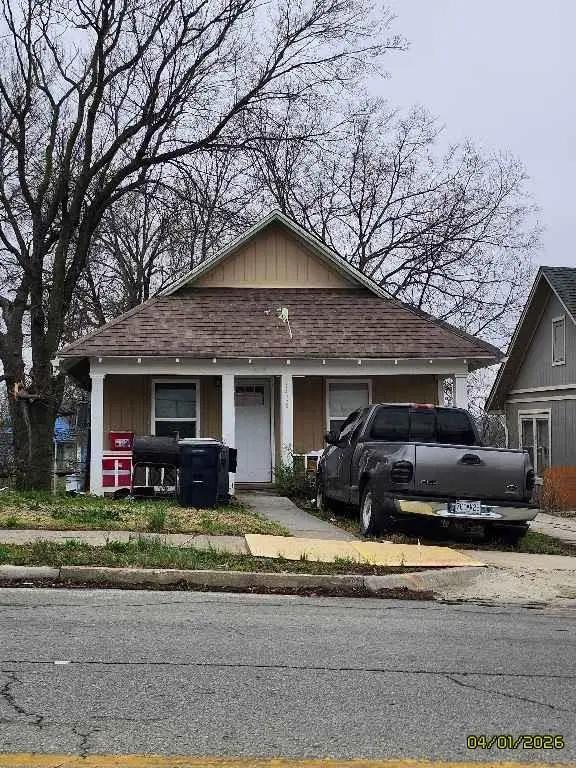
1418 Hardesty Ave · Kansas City, MO
Flood risk 1/10 · Minimal
- FEMA flood zone
- X (unshaded)
- Chance of flooding over 30 yrs
- 0.0%
- Est. flood insurance / yr
- $473 – $860
Fire risk 1/10 · Minimal
- Est. fire insurance / yr
- $1,054 – $1,958
Heat risk 4/10 · Minor
- Hot days now (above 106°F)
- 7 days/yr
- Hot days in 30 yrs
- 17 days/yr
Wind risk 2/10 · Minimal
- Chance of severe wind over 30 yrs
- —
Air-quality risk 3/10 · Minor
- Unhealthy air days now
- 2 days/yr
- Unhealthy air days in 30 yrs
- 3 days/yr
Risk factors via First Street. Map © Google.
Why this score? — see what drove the B+ grade
The composite is a weighted blend of 9 inputs, each scored 0–100. Each bar is that input's sub-score; the figure is the points it added to the 100-point composite (weight × sub-score).
- Cash flow +30.0/30.0
- ARV discount +15.0/15.0
- 1% rule +10.0/10.0
- DSCR +10.0/10.0
- Livability +3.9/5.0
- Rent growth +2.7/5.0
- Condition / age +2.5/5.0
- Schools +1.5/10.0
- Appreciation +1.1/10.0
$62,500
🖨 Deal sheet (PDF) 📄 Offer letter ✓ Due diligence
Listing remarks MLS
Charming Investment Opportunity in Kansas City Discover the potential of this inviting 3-bedroom, 2-bath home located just minutes from downtown Kansas City. Blending historic character with functional living space, this property is ideal for investors or buyers looking to add value. Inside, you’ll find a spacious layout with ample natural light and a fully finished basement, offering extra living or storage space. The home sits on a generous lot, providing room for outdoor enjoyment or future possibilities. Additional features include off-street parking and a large backyard area, enhancing convenience and tenant appeal. Whether you're looking to expand your rental portfolio or secure a property with upside potential, this home presents a strong opportunity in a growing market. Highlights: 3 Bedrooms / 2 Bathrooms Finished basement Spacious lot Off-street parking Convenient location near downtown
Key facts
- Finished basement
- Spacious lot
- Large backyard area
Tags
Neighborhood map
What this means for you Summary
Snapshot
- This is a 2-bed/2.0-bath single-family listed at $62k.
Deal economics
- At list price, monthly cash flow is $501 ($6k/yr) — positive.
- The deal already cash-flows at list — no discount required.
- Meets the 1% rule at list price ($1k rent vs $62k).
- Recommended offer: $59k (6.0% below list) — sets the bar for market timing.
- Cap rate 15.9% vs local median 3.9% in Kansas City — top-decile yield for the area; either an underpriced asset or a hidden risk that comps aren't pricing in. Stress-test before assuming the spread holds.
Location & tenants
- Location reads 78/100 on livability (#28 in MO, #2,671 nationally) — a middle-class / working-renter tenant base. Strengths: amenities A+, commute A+, cost of living A+; Watch: schools C-, crime F.
- Kansas City 33 (urban): math 12% / reading 24% proficiency, ranked #308 of 324 in MO (top 95%) — low school quality limits family demand, transient renter base, plan for 1-2y turnover; 75% free/reduced lunch — lower-income household profile, screen leases tightly.
- Market conditions: Rents flat; 108 active listings in the ZIP; 2 comparable units currently listed for rent nearby; lower-income renter base — watch delinquency; 4,002 units permitted in Jackson County in 2024 (2,271 in 5+ unit buildings).
- This rent runs 41% of the median local income ($33k/yr) — at the standard rent-burdened threshold; future hikes will face affordability resistance.
Forward outlook
- Local home prices are declining (-3.0%/yr); year-one equity from $432 of loan paydown is wiped out by about $2k of value loss. Plan a longer hold.
- Jackson County population projected at +4% by 2050 — modest demand growth; plan on rents tracking national, not racing it.
- At projected returns (-3.0% appreciation + 0.9% rent growth), your $18k cash investment doubles in ~4 years — after that, you're playing with house money.
Negotiation context
- It's been on market 70 days — a 6% lower offer ($59k) is reasonable based on typical stale-listing flexibility.
- 4 sale attempts since 10y ago; this cycle's ask has dropped $17k (22%) from the opening price — seller is motivated, your offer sets the floor, not the list.
Risks & watch-outs
- Watch-outs: built in 1909 — expect roof / HVAC / electrical / plumbing capex.
Questions for the listing agent
- It's been on market 70 days. Have you received any prior offers? Is the seller open to a 6% concession, seller financing, or rate buy-down credit?
- Built in 1909 — when were the roof, HVAC, electrical panel, plumbing, and water heater last replaced?
- Why hasn't it sold? Are there any deal-killer items the seller is aware of (foundation, flood, title, zoning, code violations)?
- Is there a deadline driving the sale (1031 exchange, divorce, estate, relocation)? That informs how much negotiation room exists.
- Crime grade is F in this area — have there been break-ins, vandalism, or insurance claims at this property in the last 3 years? What carrier currently insures it and at what premium?
- What's the average days-on-market for RENTAL listings here right now (not sales)? A rising rental-DOM trend means longer vacancies and softer asking-rent achievability than the comps imply.
- What's the recent tenant-quality profile in this submarket — average credit score on applications, eviction rate, late-payment / NSF rate, and stable-employment percentage? A property-management company in the area should have these aggregated.
- How much new for-sale + rental construction is in the pipeline within 1–3 miles? Heavy new supply typically softens prices + rents 12–24 months out; constrained supply supports both.
Investment metrics
- 1% rule
- 1.82% ✓
- Cap rate
- 15.92%
- Cash-on-cash
- 34.38%
- DSCR
- 2.53
- GRM
- 4.6
CMA / ARV
- ARV (median comp)
- $121,169
- List price
- $62,500
- Delta
- -48.42%
- Verdict
- UNDERPRICED
- Comps
- 20 within 1.0 mi
Show comp detail 12 sales within ~0.75 mi
| Address | Dist | Beds/Ba | Sqft | Sold | Price | $/sf | Match |
|---|---|---|---|---|---|---|---|
| 5832 Peery Ave | 0.44mi | 2/1.5 | 688 (-1%) | 17mo | $50,000 | $73 | 62 |
| 1249 Denver St | 0.15mi | 2/1.0 | 792 (+14%) | 3mo | $45,000 | $57 | 62 |
| 1215 Bellaire Ave | 0.37mi | 2/1.0 | 702 (+1%) | 18mo | $90,000 | $128 | 61 |
| 1830 Lister Ave | 0.59mi | 2/1.0 | 700 (+1%) | 12mo | $92,000 | $131 | 56 |
| 1610 Elmwood Ave | 0.56mi | 2/1.0 | 676 (-2%) | 16mo | $67,500 | $100 | 53 |
| 6012 E 16th St | 0.45mi | 2/1.0 | 792 (+14%) | 2mo | $110,000 | $139 | 49 |
| 701 Van Brunt Blvd | 0.67mi | 2/1.0 | 660 (-5%) | 12mo | $125,000 | $189 | 47 |
| 6024 E 11th St | 0.59mi | 3/2.0 (+1) | 768 (+11%) | 6mo | $98,950 | $129 | 44 |
| 2031 Lister Ave | 0.75mi | 2/1.0 | 720 (+4%) | 12mo | $75,000 | $104 | 44 |
| 6024 E 16th St | 0.48mi | 2/1.0 | 792 (+14%) | 9mo | $49,900 | $63 | 42 |
| 719 Van Brunt Blvd | 0.63mi | 3/1.0 (+1) | 730 (+6%) | 15mo | $89,000 | $122 | 40 |
| 4411 E 16th St | 0.62mi | 2/1.0 | 625 (-10%) | 20mo | $65,000 | $104 | 34 |
Match score weights: distance 35% · size 25% · config 20% · recency 20%. Top-matched comps best support the ARV.
Projected returns pro-forma
-3.0% appreciation · 0.94% rent growth · sell at horizon
- IRR
- 27.5%
- Equity multiple
- 2.11×
- Total profit
- $19,494
- Equity at exit
- $9,319
- IRR
- 33.8%
- Equity multiple
- 3.80×
- Total profit
- $48,992
- Equity at exit
- $5,404
Cash invested: $17,500 (down + closing). Projections, not guarantees.
Landlord ↔ Tenant lean methodology
- Overall (STATE)
- 81 Strongly Landlord-Friendly
- State Missouri
- 81 Strongly Landlord-Friendly · R+10
- County
- — inherits STATE
- City
- — inherits STATE
ZIP-level market 64127
- Home prices YoY
- -2.6%
- Rents YoY
- 0.9%
- Active inventory
- 108
- Price-to-rent
- 4.6×
Monthly cashflow live
- Estimated rent
- $1,135 medium interval (Pro) →
- Mortgage (P&I)
- −$328
- Tax from tax record
- −$42 /mo · $501/yr
- Insurance
- −$26
- HOA
- −$0
- Vacancy / Maint / Mgmt
- −$238
- Net cashflow
- $501
Break-even live
Sensitivity live
| Price | -10% $537 | -5% $519 | +0% $501 | +5% $484 | +10% $466 |
|---|---|---|---|---|---|
| Rent | -10% $412 | -5% $457 | +0% $501 | +5% $546 | +10% $591 |
| Rate | -1.0pp $533 | -0.5pp $517 | base $501 | +0.5pp $485 | +1.0pp $469 |
UW: 25.0% down · 7.5% · 30yr · 1.5% tax · 5.0% vac · 8.0% maint · 8.0% mgmt
Financing live
Cash to close
- Down payment
- $15,625
- Closing costs
- $1,875
- Reserves months
- —
- Total cash needed
- —
Loan-product check · same deal, 3 products live
Conventional
25% down · 7.5% · 30yr
- Down + closing
- —
- Monthly P&I
- —
- Monthly cashflow
- —
- DSCR
- —
- Eligible?
- —
Personal DTI + credit; lowest rate.
DSCR
20% down · 8.5% · 30yr
- Down + closing
- —
- Monthly P&I
- —
- Monthly cashflow
- —
- DSCR
- —
- Eligible?
- —
No personal income docs; deal must DSCR.
Hard money
10% down · 12.0% · 12mo
- Down + closing
- —
- Monthly P&I
- —
- Monthly cashflow
- —
- DSCR
- —
- Eligible?
- —
Short-term bridge; refi at stabilization.
Rent comps 2 comps
| Address | Beds | Baths | Sqft | Rent | $/sqft | DOM | Units | Dist |
|---|---|---|---|---|---|---|---|---|
| 1616 Hardesty Ave Unit 1-108 Kansas City, MO | 1.0 | 1.0 | 634 | $1,150 | $1.81 | 22d | 1 | 0.18mi |
| 611 Ewing Ave Unit B Kansas City, MO | 1.0 | 1.0 | 700 | $800 | $1.14 | 24d | 1 | 1.13mi |
Listing history 27 events
-
2026-06-18days on market $62,500 Active 70 DOM
-
2026-06-17pricedays on market $62,500 Active 69 DOM
-
2026-06-16days on market $72,500 Active 68 DOM
-
2026-06-15days on market $72,500 Active 67 DOM
-
2026-06-13days on market $72,500 Active 65 DOM
-
2026-06-09days on market $72,500 Active 61 DOM
-
2026-06-08days on market $72,500 Active 60 DOM
-
2026-06-07days on market $72,500 Active 59 DOM
-
2026-06-05days on market $72,500 Active 56 DOM
-
2026-06-03days on market $72,500 Active 55 DOM
-
2026-06-02days on market $72,500 Active 54 DOM
-
2026-06-01days on market $72,500 Active 53 DOM
-
2026-05-31days on market $72,500 Active 52 DOM
-
2026-05-13price $72,500 925-char remark
Show marketing remark (925 chars)
Charming Investment Opportunity in Kansas City Discover the potential of this inviting 3-bedroom, 2-bath home located just minutes from downtown Kansas City. Blending historic character with functional living space, this property is ideal for investors or buyers looking to add value. Inside, you’ll find a spacious layout with ample natural light and a fully finished basement, offering extra living or storage space. The home sits on a generous lot, providing room for outdoor enjoyment or future possibilities. Additional features include off-street parking and a large backyard area, enhancing convenience and tenant appeal. Whether you're looking to expand your rental portfolio or secure a property with upside potential, this home presents a strong opportunity in a growing market. Highlights: 3 Bedrooms / 2 Bathrooms Finished basement Spacious lot Off-street parking Convenient location near downtown
-
2026-05-13price $72,800 925-char remark
Show marketing remark (925 chars)
Charming Investment Opportunity in Kansas City Discover the potential of this inviting 3-bedroom, 2-bath home located just minutes from downtown Kansas City. Blending historic character with functional living space, this property is ideal for investors or buyers looking to add value. Inside, you’ll find a spacious layout with ample natural light and a fully finished basement, offering extra living or storage space. The home sits on a generous lot, providing room for outdoor enjoyment or future possibilities. Additional features include off-street parking and a large backyard area, enhancing convenience and tenant appeal. Whether you're looking to expand your rental portfolio or secure a property with upside potential, this home presents a strong opportunity in a growing market. Highlights: 3 Bedrooms / 2 Bathrooms Finished basement Spacious lot Off-street parking Convenient location near downtown
-
2026-04-09$79,900 Active 925-char remark
Show marketing remark (925 chars)
Charming Investment Opportunity in Kansas City Discover the potential of this inviting 3-bedroom, 2-bath home located just minutes from downtown Kansas City. Blending historic character with functional living space, this property is ideal for investors or buyers looking to add value. Inside, you’ll find a spacious layout with ample natural light and a fully finished basement, offering extra living or storage space. The home sits on a generous lot, providing room for outdoor enjoyment or future possibilities. Additional features include off-street parking and a large backyard area, enhancing convenience and tenant appeal. Whether you're looking to expand your rental portfolio or secure a property with upside potential, this home presents a strong opportunity in a growing market. Highlights: 3 Bedrooms / 2 Bathrooms Finished basement Spacious lot Off-street parking Convenient location near downtown
-
2025-11-30historical
-
2025-10-14price $100,000
-
2025-09-26$110,000 Active
-
2024-06-01historical $1,100
-
2024-05-16$1,100
-
2023-09-25soldstatus
-
2023-09-21soldstatus
-
2017-07-17soldstatus
-
2016-11-24historical
-
2016-01-16$27,000 Active
-
2003-07-02soldstatus
ⓘ Source: listings_history table (triggers on properties + properties_extension) + one-shot
backfill from property_details.listing_events for pre-trigger history.
Tax reassessment forecast MO · Resets to sale price
- Current annual tax
- $501 · $42/mo
- Projected year-2 tax
- $606 · $51/mo
- Expected delta
- +$105/yr (+$9/mo · 21.0%)
ⓘ Screening estimate from a state-policy table — verify with the county assessor before closing.
Climate risk First Street
- Flood 1/10 Low FEMA zone X (unshaded) · 0% chance over 30 yrs
- Wildfire 1/10 Low
- Heat 4/10 Moderate 7 d/yr ≥106°F today · 17 d/yr by 30 yrs out
- Wind 2/10 Low
- Air quality 3/10 Moderate 2 unhealthy d/yr today · 3 by 30 yrs out
Nearby sold comps map
Loading sold comps map…
Walkable amenities ~0.75 mi
Loading nearby amenities…
Taxation est. · year 1
- Rental income
- $13,624
- − Mortgage interest
- −$3,501
- − Property taxes
- −$501
- − Insurance
- −$312
- − Repairs & maintenance
- −$1,090
- − Management
- −$1,090
- − Depreciation
- −$1,818
- Taxable income
- $5,312
- Est. tax owed @ 24.0%
- −$1,275
- After-tax cash flow
- $4,742/yr
For passive investors: Depreciation is non-cash, so a rental often shows a tax loss while cash-flowing — sheltering income. Rental losses are passive: they offset passive income freely, and up to $25,000/yr can offset ordinary (W-2) income if you actively participate and your MAGI is under $100k (phasing out to $0 by $150k); unused losses carry forward. On sale, claimed depreciation is recaptured at up to 25%, and gains may owe capital-gains tax (a 1031 exchange can defer both). Figures are a year-1 estimate at your 24.0% rate — not tax advice; consult a CPA.
Schools (NCES district)
- District
- Kansas City 33
- NCES district ID
- 2916400
- Math proficiency
- 12% ▼ -8.00%
- Reading proficiency
- 24% ▬ 0.00%
- Median HH income
- $35,227
- Composite
- 14.8/100
- National rank
- #9387
- State rank
- #308 of 324 in MO
Livability — Kansas City
- Score
- 78/100
- State rank
- #28
- US rank
- #2671
Category grades
Schools grade is shown separately in the Schools card above.
Census & demographics
- Census place
- Kansas City, MO
- County
- Jackson County · 687,798 people
- City population
- 439,467
- Metro
- Kansas City, MO-KS
- Population (ZIP)
- 17,668
- Household income
- $33,111
- Rent vs Own
- Severe rent burden
- 1943.0
Population outlook (Jackson County) Hauer SSP2
- Today (2025)
- 719,589 people
- By 2030
- 731,456 · +1.6%
- By 2040
- 746,689 · +3.8%
- By 2050
- 749,289 · +4.1%
- By 2075
- 736,227 · +2.3%
- By 2100
- 668,210 · -7.1%
Race, ethnicity, and origin ACS 2023
- Neighborhood character
- Diverse neighborhood (Simpson 0.65)
- Race & ethnicity
- Black 42% Hispanic / Latino 40% Two or more races 13% White 12% Native American 1%
- Hispanic origin (detail)
- Mexican 28%
- Foreign-born
- 20% · Canada, Vietnam
- Languages at home
- 67% English-only · Spanish 29%
Political lean MEDSL · Jackson
- 2024 margin
- D (+19.3) · D 58.9% · R 39.5% · Other 1.6%
- 2008→2024 swing
- -6.1pp toward R · 2008: 25.4pp · 2024: 19.3pp
- All cycles
- 2024: D+19.3 2020: D+22.0 2016: D+16.6 2012: D+19.0 2008: D+25.4
Not yet ingested
- Civics
- —
Market trends
- HPI YoY
- ▼ -7.88%
- Current HPI
- 289.2468
- Rent YoY
- ▲ 0.94%
- Metro
- Kansas City, MO-KS
- State GDP YoY
- ▲ 1.84%
- F500 in state
- 20
Industry mix (Fortune 500 HQ in MO)
| Industry | F500 HQs | Revenue |
|---|---|---|
| Healthcare | 1 | $163B |
|
||
| Insurance | 1 | $21B |
|
||
| Industrial Technology | 1 | $17B |
|
||
| Retail | 1 | $16B |
|
||
| Industrial Distribution | 1 | $10B |
|
||
| Utilities | 1 | $9B |
|
||
Price history
+168.5% since first listed14 events — show timeline
- 2026-05-13 Price Changed $72,500 Heartland MLS as Distributed by MLS Grid
- 2026-05-13 Price Changed $72,800 Heartland MLS as Distributed by MLS Grid
- 2026-04-09 Listed $79,900 Heartland MLS as Distributed by MLS Grid
- 2025-11-30 Listing Removed — Heartland MLS as Distributed by MLS Grid
- 2025-10-14 Price Changed $100,000 Heartland MLS as Distributed by MLS Grid
- 2025-09-26 Listed $110,000 Heartland MLS as Distributed by MLS Grid
- 2024-06-01 Rental Removed $1,100 HMLS
- 2024-05-16 Listed for Rent $1,100 HMLS
- 2023-09-25 Sold (Public Records) — Public Records
- 2023-09-21 Sold (Public Records) — Public Records
- 2017-07-17 Sold (Public Records) — Public Records
- 2016-11-24 Listing Removed — Heartland MLS as Distributed by MLS Grid
- 2016-01-16 Listed $27,000 Heartland MLS as Distributed by MLS Grid
- 2003-07-02 Sold (Public Records) — Public Records
Property tax history
+4.5%/yrLatest (2025): $501 · +22.2% YoY. Source: county tax records.
Cash-flow waterfall
monthlySold comps — $/sqft
last 12 mo · ≤1 miLoading sold comps…