 Duplex
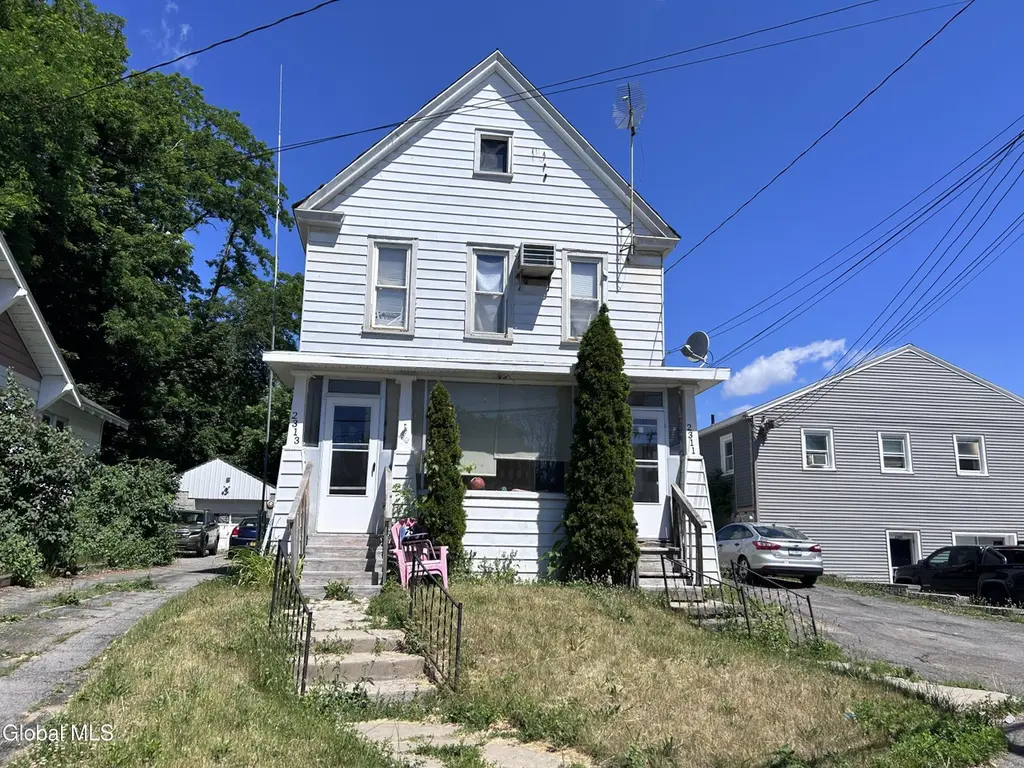
2311 Guilderland Ave · Schenectady, NY
Flood risk 1/10 · Minimal
- FEMA flood zone
- X (unshaded)
- Chance of flooding over 30 yrs
- 0.0%
- Est. flood insurance / yr
- $473 – $860
Fire risk 3/10 · Minor
- Est. fire insurance / yr
- $691 – $1,283
Heat risk 4/10 · Minor
- Hot days now (above 96°F)
- 7 days/yr
- Hot days in 30 yrs
- 16 days/yr
Wind risk 2/10 · Minimal
- Chance of severe wind over 30 yrs
- 4.0%
Air-quality risk 1/10 · Minimal
- Unhealthy air days now
- 0 days/yr
- Unhealthy air days in 30 yrs
- 0 days/yr
Risk factors via First Street. Map © Google.
Why this score? — see what drove the B+ grade
The composite is a weighted blend of 9 inputs, each scored 0–100. Each bar is that input's sub-score; the figure is the points it added to the 100-point composite (weight × sub-score).
- Cash flow +30.0/30.0
- ARV discount +15.0/15.0
- 1% rule +10.0/10.0
- DSCR +10.0/10.0
- Livability +3.9/5.0
- Schools +3.0/10.0
- Rent growth +2.5/5.0
- Condition / age +2.5/5.0
- Appreciation +0.0/10.0
$195,000
🖨 Deal sheet 📄 Offer letter ✓ Due diligence
Multi-family units
County records classify this as Multi-Family (2-4 Unit). Listing-text estimate: 2 units. confirmed
Listing remarks MLS
Owner Occupy or Investors take note of this money maker. 1 Unit Rented and 2nd Unit Vacant. Each unit rents for $850. Separate Utilities. Large Lot. Good Location on Border of Rotterdam. Great Opportunity Awaits!!! Multiple Offer Highest and Best Due Sunday 11/24 by 5pm.
Key facts
- 7,840 sq ft lot
- 4 parking spots
- Built 1920
Property features AI
Exterior
- Parking: Off-street parking; Driveway; Parking for 4 vehicles total
- Utilities: Public water; Public sewer
- Home design: Duplex; 2,090 living area; Lot dimensions approximately 48 x 162
- Construction: Vinyl siding; Slate roof
- Exterior features: Front porch; Rear porch; Other exterior features
Interior
- Bedrooms: Unit 1: 3 bedrooms; Unit 2: 3 bedrooms
- Bathrooms: 2 full bathrooms (one on the 1st level, one on the 2nd level); Unit 1: 1 full bath; Unit 2: 1 full bath
- Heating & cooling: Steam heating; Natural gas heating
- Interior features: Full basement
Neighborhood map
What this means for you Summary
Snapshot
- This is a 2 × 3-bed/1.0-bath units multifamily listed at $195k.
Deal economics
- At list price, monthly cash flow is $2k ($18k/yr) — positive. Per door: $771/mo.
- The deal already cash-flows at list — no discount required.
- Meets the 1% rule at list price ($4k rent vs $195k).
- Cap rate 15.8% vs local median 6.3% in Schenectady — top-decile yield for the area; either an underpriced asset or a hidden risk that comps aren't pricing in. Stress-test before assuming the spread holds.
Location & tenants
- Location reads 78/100 on livability (#167 in NY, #2,597 nationally) — a middle-class / working-renter tenant base. Strengths: commute A+, health & safety A+, cost of living A; Watch: employment D+, crime F.
- Schenectady City School District (urban): math 38% / reading 34% proficiency, ranked #556 of 590 in NY (top 94%) — families likely to look elsewhere, expect single-tenant / working-renter base with shorter leases; 65% free/reduced lunch — lower-income household profile, screen leases tightly.
- Zoned schools: Schenectady High School (math 75% / reading 90%, grade A, #446 of 1,100 statewide, top 41%, 2,743 students, 71% FRL).
- Zoned-school proficiency averages 82% at this address vs 36% district-wide (+46 pts) — the actual schools serving this property are materially stronger than the Schenectady City School District average implies; a family-tenant draw the district grade alone would hide.
- Market conditions: 181 active listings in the ZIP; 2 comparable units currently listed for rent nearby; solid renter incomes; 154 units permitted in Schenectady County in 2024 (54 in 5+ unit buildings).
- At $3,851/mo this rent would consume 56% of the median local household income ($83k/yr) (locally 629% of renters already pay >50% of income on rent) — very limited rent-growth headroom before tenants either downsize or default.
Forward outlook
- Local home prices are declining (-3.0%/yr); year-one equity from $1k of loan paydown is wiped out by about $6k of value loss. Plan a longer hold.
- Schenectady County population projected to shrink 4% by 2050 — rents likely to lag national; underwrite the cash flow, not the appreciation.
- At projected returns (-3.0% appreciation + 3.0% rent growth), your $55k cash investment doubles in ~4 years — after that, you're playing with house money.
Negotiation context
- Only 1 days on market — expect competitive offers; lowballing is unlikely to land.
- 6 sale attempts since 13y ago with the ask held roughly flat each time — persistent listings suggest the price (not the market) is what's stuck; bring a comps-based counter.
- Current owner paid $68k; list at $195k implies a 187% gain — meaningful room to come down on a strong offer.
Risks & watch-outs
- Watch-outs: built in 1920 — expect roof / HVAC / electrical / plumbing capex.
Questions for the listing agent
- Can we see the unit-by-unit rent roll, current vacancy, and any below-market leases? What's the average tenancy length?
- What capital expenditures (roof, boiler, parking lot, exteriors) have been made in the last 5 years, and what's planned in the next 2?
- Built in 1920 — when were the roof, HVAC, electrical panel, plumbing, and water heater last replaced?
- Is there a deadline driving the sale (1031 exchange, divorce, estate, relocation)? That informs how much negotiation room exists.
- Crime grade is F in this area — have there been break-ins, vandalism, or insurance claims at this property in the last 3 years? What carrier currently insures it and at what premium?
- What's the average days-on-market for RENTAL listings here right now (not sales)? A rising rental-DOM trend means longer vacancies and softer asking-rent achievability than the comps imply.
- What's the recent tenant-quality profile in this submarket — average credit score on applications, eviction rate, late-payment / NSF rate, and stable-employment percentage? A property-management company in the area should have these aggregated.
- How much new apartment / multifamily construction is in the pipeline within 1–3 miles? Heavy new supply (>2% of stock underway) typically softens rents 12–24 months out; light construction supports rent growth.
Investment metrics
- 1% rule
- 1.97% ✓
- Cap rate
- 15.78%
- Cash-on-cash
- 33.88%
- DSCR
- 2.51
- GRM
- 4.2
CMA / ARV
- ARV (on-the-fly)
- $267,520
- Comps found
- 12
Show comp detail 12 sales within ~0.75 mi
| Address | Dist | Beds/Ba | Sqft | Sold | Price | $/sf | Match |
|---|---|---|---|---|---|---|---|
| 2233 Guilderland Ave | 0.07mi | 3/2.5 (-1) | 2,108 (+1%) | 12mo | $245,000 | $116 | 78 |
| 2026 Wabash Ave | 0.33mi | 4/2.0 | 2,068 (-1%) | 8mo | $273,000 | $132 | 76 |
| 2119 Broadway | 0.40mi | 4/3.0 | 2,183 (+4%) | 5mo | $167,500 | $77 | 65 |
| 1087 Davis Ter | 0.70mi | 4/2.0 | 2,208 (+6%) | 1mo | $150,000 | $68 | 58 |
| 417 Shannon St | 0.42mi | 4/2.0 | 1,900 (-9%) | 9mo | $244,000 | $128 | 57 |
| 2336 Turner Ave | 0.54mi | 4/3.0 | 1,932 (-8%) | 7mo | $190,000 | $98 | 52 |
| 2332 Turner Ave | 0.54mi | 5/3.0 (+1) | 1,932 (-8%) | 1mo | $255,000 | $132 | 52 |
| 425 Cora St | 0.47mi | 4/3.0 | 2,288 (+10%) | 11mo | $292,000 | $128 | 50 |
| 935 Davis Ter | 0.71mi | 4/2.0 | 2,000 (-4%) | 12mo | $36,000 | $18 | 50 |
| 2820 Broadway | 0.43mi | 3/2.0 (-1) | 1,800 (-14%) | 7mo | $254,000 | $141 | 46 |
| 420 Marengo St | 0.59mi | 5/2.0 (+1) | 1,820 (-13%) | 6mo | $309,000 | $170 | 40 |
| 2057 Guilderland Ave | 0.28mi | 4/5.0 | 2,394 (+14%) | 13mo | $106,000 | $44 | 40 |
Match score weights: distance 35% · size 25% · config 20% · recency 20%. Top-matched comps best support the ARV.
Projected returns pro-forma
-3.0% appreciation · 3.0% rent growth · sell at horizon
- IRR
- 29.3%
- Equity multiple
- 2.22×
- Total profit
- $66,736
- Equity at exit
- $29,075
- IRR
- 36.6%
- Equity multiple
- 4.39×
- Total profit
- $185,156
- Equity at exit
- $16,860
Cash invested: $54,600 (down + closing). Projections, not guarantees.
Landlord ↔ Tenant lean methodology
- Overall (STATE)
- 15 Strongly Tenant-Friendly
- State New York
- 15 Strongly Tenant-Friendly · D+10
- County
- — inherits STATE
- City
- — inherits STATE
ZIP-level market 12306
- Home prices YoY
- -23.8%
- Active inventory
- 181
- Price-to-rent
- 8.4×
Monthly cashflow live
- Estimated rent
- $3,851 high interval (Pro) →
- Mortgage (P&I)
- −$1,023
- Tax from tax record
- −$397 /mo · $4,763/yr
- Insurance
- −$81
- HOA
- −$0
- Vacancy / Maint / Mgmt
- −$809
- Net cashflow
- $1,542
Break-even live
2-unit breakdown (identical units grouped — click to expand)
| Units | Beds | Baths | Est. rent |
|---|---|---|---|
| 2× units | 3 | 1 | $3,852 |
| #1 | 3 | 1 | $1,926 |
| #2 | 3 | 1 | $1,926 |
| Total (2 units) | $3,851 | ||
UW: 25.0% down · 7.5% · 30yr · 1.5% tax · 5.0% vac · 8.0% maint · 8.0% mgmt
Financing live
Cash to close
- Down payment
- $48,750
- Closing costs
- $5,850
- Reserves months
- —
- Total cash needed
- —
Loan-product check · same deal, 3 products live
Conventional
25% down · 7.5% · 30yr
- Down + closing
- —
- Monthly P&I
- —
- Monthly cashflow
- —
- DSCR
- —
- Eligible?
- —
Personal DTI + credit; lowest rate.
DSCR
20% down · 8.5% · 30yr
- Down + closing
- —
- Monthly P&I
- —
- Monthly cashflow
- —
- DSCR
- —
- Eligible?
- —
No personal income docs; deal must DSCR.
Hard money
10% down · 12.0% · 12mo
- Down + closing
- —
- Monthly P&I
- —
- Monthly cashflow
- —
- DSCR
- —
- Eligible?
- —
Short-term bridge; refi at stabilization.
Rent comps 2 comps
| Address | Beds | Baths | Sqft | Rent | $/sqft | DOM | Units | Dist |
|---|---|---|---|---|---|---|---|---|
| 909 Vischer Ave Schenectady, NY | 3.0 | 1.5 | 1512 | $1,995 | $1.32 | 14d | 1 | 0.18mi |
| 1346 10th Ave Schenectady, NY | 4.0 | 2.0 | 2350 | $2,499 | $1.06 | 14d | 1 | 0.91mi |
Listing history 2 events
-
2026-06-17remarks 116-char remark
-
2026-06-17$195,000 Active 1 DOM
ⓘ Source: listings_history table (triggers on properties + properties_extension) + one-shot
backfill from property_details.listing_events for pre-trigger history.
Tax reassessment forecast NY · Partial reset (capped growth)
- Current annual tax
- $4,763 · $397/mo
- Projected year-2 tax
- $4,763 · $397/mo
- Expected delta
- $0/yr ($0/mo · 0.0%)
ⓘ Screening estimate from a state-policy table — verify with the county assessor before closing.
Climate risk First Street
- Flood 1/10 Low FEMA zone X (unshaded) · 0% chance over 30 yrs
- Wildfire 3/10 Moderate
- Heat 4/10 Moderate 7 d/yr ≥96°F today · 16 d/yr by 30 yrs out
- Wind 2/10 Low 4% chance of damaging wind over 30 yrs
- Air quality 1/10 Low 0 unhealthy d/yr today · 0 by 30 yrs out
Nearby sold comps map
Loading sold comps map…
Walkable amenities ~0.75 mi
Loading nearby amenities…
Taxation est. · year 1
- Rental income
- $46,212
- − Mortgage interest
- −$10,923
- − Property taxes
- −$4,763
- − Insurance
- −$975
- − Repairs & maintenance
- −$3,697
- − Management
- −$3,697
- − Depreciation
- −$5,673
- Taxable income
- $16,485
- Est. tax owed @ 24.0%
- −$3,956
- After-tax cash flow
- $14,542/yr
For passive investors: Depreciation is non-cash, so a rental often shows a tax loss while cash-flowing — sheltering income. Rental losses are passive: they offset passive income freely, and up to $25,000/yr can offset ordinary (W-2) income if you actively participate and your MAGI is under $100k (phasing out to $0 by $150k); unused losses carry forward. On sale, claimed depreciation is recaptured at up to 25%, and gains may owe capital-gains tax (a 1031 exchange can defer both). Figures are a year-1 estimate at your 24.0% rate — not tax advice; consult a CPA.
Schools (NCES district)
- District
- Schenectady City School District
- NCES district ID
- 3626010
- Math proficiency
- 38% ▲ 12.00%
- Reading proficiency
- 34% ▲ 2.00%
- Median HH income
- $39,453
- Composite
- 30.2/100
- National rank
- #6309
- State rank
- #556 of 590 in NY
Livability — Schenectady
- Score
- 78/100
- State rank
- #167
- US rank
- #2597
Category grades
Schools grade is shown separately in the Schools card above.
Census & demographics
- Census place
- Schenectady, NY
- County
- Schenectady County · 141,369 people
- City population
- 141,369
- Metro
- Albany-Schenectady-Troy, NY
- Population (ZIP)
- 27,865
- Household income
- $83,202
- Rent vs Own
- Severe rent burden
- 629.0
Population outlook (Schenectady County) Hauer SSP2
- Today (2025)
- 155,046 people
- By 2030
- 154,322 · -0.5%
- By 2040
- 151,796 · -2.1%
- By 2050
- 148,621 · -4.1%
- By 2075
- 141,229 · -8.9%
- By 2100
- 126,014 · -18.7%
Race, ethnicity, and origin ACS 2023
- Neighborhood character
- Predominantly White (78%)
- Race & ethnicity
- White 78% Two or more races 8% Black 7% Hispanic / Latino 7% Asian 3%
- Hispanic origin (detail)
- Puerto Rican 4% Dominican 1%
- Common ancestry
- Romanian 7% Lithuanian 5% Iranian 3%
- Foreign-born
- 6% · Canada
- Languages at home
- 94% English-only · Spanish 3% Other Indo-European 1% Other Asian/Pacific 1%
Political lean MEDSL · Schenectady
- 2024 margin
- D (+10.8) · D 55.4% · R 44.6%
- 2008→2024 swing
- -1.8pp toward R · 2008: 12.7pp · 2024: 10.8pp
- All cycles
- 2024: D+10.8 2020: D+15.7 2016: D+5.8 2012: D+15.4 2008: D+12.7
Not yet ingested
- Civics
- —
Market trends
- HPI YoY
- ▼ -91.35%
- Current HPI
- 292.1229
- Rent YoY
- —
- Metro
- Albany-Schenectady-Troy, NY
- State GDP YoY
- ▲ 2.60%
- F500 in state
- 92
Industry mix (Fortune 500 HQ in NY)
| Industry | F500 HQs | Revenue |
|---|---|---|
| Financial Services | 10 | $950B |
|
||
| Consumer Goods | 9 | $162B |
|
||
| Insurance | 4 | $225B |
|
||
| Telecommunications | 2 | $144B |
|
||
| Pharmaceuticals | 2 | $112B |
|
||
| Media / Entertainment | 2 | $69B |
|
||
Price history
+214.5% since first listed18 events — show timeline
- 2026-06-16 Listed $195,000 Global MLS
- 2020-02-10 Sold (Public Records) $68,000 Public Records
- 2020-01-22 Sold (MLS) $68,000 Global MLS
- 2019-11-26 Pending — Global MLS
- 2019-11-19 Listed $62,900 Global MLS
- 2017-08-01 Listing Removed — Global MLS
- 2017-04-11 Price Changed $69,900 Global MLS
- 2017-02-02 Listed $75,000 Global MLS
- 2017-01-03 Listing Removed — OneKey® MLS as Distributed by MLS Grid
- 2016-10-06 Price Changed $85,000 OneKey® MLS as Distributed by MLS Grid
- 2016-07-15 Listed $95,100 OneKey® MLS as Distributed by MLS Grid
- 2015-10-21 Sold (Public Records) $40,000 Public Records
- 2015-10-01 Sold (MLS) $40,000 Global MLS
- 2015-06-01 Listing Removed — Global MLS
- 2015-04-20 Listed $49,900 Global MLS
- 2015-02-23 Listing Removed — Global MLS
- 2013-07-28 Listed $60,000 Global MLS
- 2005-02-08 Sold (Public Records) $62,000 Public Records
Property tax history
+1.0%/yrLatest (2025): $4,763 · +4.0% YoY. Source: county tax records.
Cash-flow waterfall
monthlySold comps — $/sqft
last 12 mo · ≤1 miLoading sold comps…