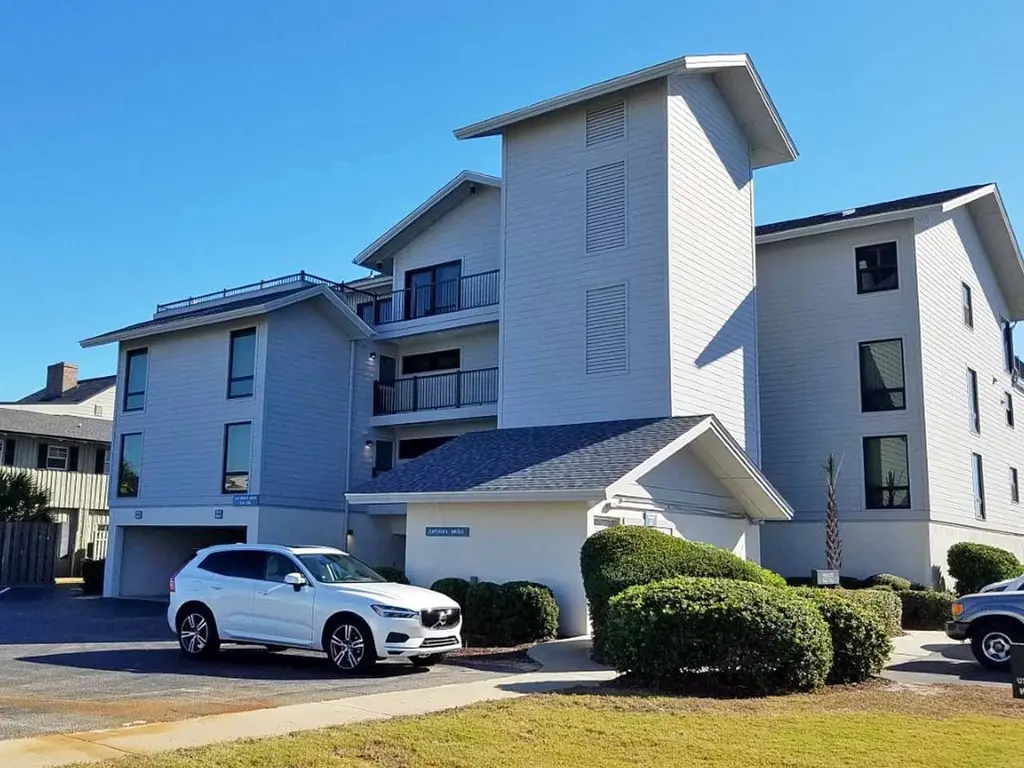
647 13c Inlet Point Int K Norris Dr · Litchfield Beach, SC
Flood risk 10/10 · Severe
- FEMA flood zone
- AE
- Chance of flooding over 30 yrs
- 0.99%
- Est. flood insurance / yr
- $1,737 – $8,500
Fire risk 2/10 · Minimal
- Est. fire insurance / yr
- $783 – $1,453
Heat risk 9/10 · Severe
- Hot days now (above 106°F)
- 7 days/yr
- Hot days in 30 yrs
- 18 days/yr
Wind risk 9/10 · Severe
- Chance of severe wind over 30 yrs
- 99.0%
Air-quality risk 2/10 · Minimal
- Unhealthy air days now
- 0 days/yr
- Unhealthy air days in 30 yrs
- 1 days/yr
Risk factors via First Street. Map © Google.
Why this score? — see what drove the B- grade
The composite is a weighted blend of 9 inputs, each scored 0–100. Each bar is that input's sub-score; the figure is the points it added to the 100-point composite (weight × sub-score).
- Cash flow +30.0/30.0
- 1% rule +10.0/10.0
- DSCR +10.0/10.0
- ARV discount +7.5/15.0
- Schools +2.7/10.0
- Rent growth +2.5/5.0
- Livability +2.5/5.0
- Condition / age +2.5/5.0
- Appreciation +0.0/10.0
$85,000
🖨 Deal sheet (PDF) 📄 Offer letter ✓ Due diligence
Listing remarks
Well maintained and updated, direct ocean front, 4 week interval in desired Inlet Point in The Litchfield Beach area of Pawleys Island, SC. This interval is Sunday to Sunday in the offseason and switches to Saturday to Saturday each year from Mid May to Mid September. Enjoy the sights and sounds of the beach and ocean from your 5 1/2 x 22 foot covered balcony. You can rarely find a condo view that has such a range from north the south. HVAC was just replaced in March 2026 and water heater was replaced in 2024. Great room with amazing ocean and beach views, sofa bed, and desk area. King bed in The Master Bedroom and tiled showed in the Master Bathroom, twin beds in the second bedroom, full
Key facts
- Covered balcony
- Direct ocean front
- 2 pools
Tags
Property features AI
Finance
- HOA & community: Homeowners association with monthly fee; Association fee covers management, common areas, insurance, internet, legal/accounting, grounds maintenance, pest control, pool(s), recreation facilities, sewer, security, trash, and water; Association amenities include beach rights, clubhouse, gated access, private membership, security, cable TV, and grounds maintenance; Community features: beach, private beach, clubhouse, pool, elevator, recreation area, short-term rentals allowed, cable/internet access
Exterior
- Parking: Assigned parking
- Security: Gated community; Security service; Smoke detector(s)
- Utilities: Public water; Sewer available; Electricity available; Cable available; Phone available; High speed internet available; Underground utilities; Trash collection
- Home design: Condominium in a gated community; Resale property
- Construction: HardiPlank-type siding; Raised foundation
- Exterior features: Balcony; Rear porch; Porch; Storage; Community outdoor pool; Community amenities include pool and recreation areas; Waterfront; Located in a flood zone
Interior
- Kitchen: Dishwasher; Disposal; Microwave; Range; Refrigerator; Breakfast bar; Solid surface counters
- Bedrooms: Bedroom on main level; Primary and other bedrooms located on the main level
- Flooring: Carpet; Luxury vinyl plank; Luxury vinyl; Tile
- Bathrooms: 2 full bathrooms; Separate shower in at least one bath
- Heating & cooling: Central heating (electric); Central air conditioning
- Interior features: Furnished; Main level primary suite; Separate shower; Window treatments; High speed internet; Entrance foyer; Tray ceiling(s); Kitchen/dining combo; Storm door(s); Solid surface counters; Breakfast bar; Bedroom on main level
- Laundry & utility: Washer hookup; Washer included; Dryer included
Neighborhood map
What this means for you Summary
Snapshot
- This is a 2-bed/2.0-bath condo listed at $85k.
Deal economics
- At list price, monthly cash flow is $251 ($3k/yr) — positive.
- The deal already cash-flows at list — no discount required.
- Meets the 1% rule at list price ($2k rent vs $85k).
- Recommended offer: $82k (3.0% below list) — sets the bar for market timing.
- Cap rate 15.9% vs local median 1.8% in Litchfield Beach — top-decile yield for the area; either an underpriced asset or a hidden risk that comps aren't pricing in. Stress-test before assuming the spread holds.
Location & tenants
- Location reads: area grade B — affects rentability + tenant quality, not the cash-flow math above.
- Georgetown 01 (town): math 26% / reading 38% proficiency, ranked #51 of 80 in SC (top 64%) — families likely to look elsewhere, expect single-tenant / working-renter base with shorter leases.
- Zoned schools: Waccamaw Elementary (math 67% / reading 62%, grade B, #56 of 597 statewide, top 10%, 519 students, 100% FRL); Waccamaw Intermediate (math 53% / reading 56%, grade B-, #24 of 229 statewide, top 11%, 420 students, 43% FRL); Waccamaw High (math 42% / reading 93%, grade B, #72 of 196 statewide, top 36%, 858 students, 35% FRL) — zoned schools at 59% FRL track the district average.
- Zoned-school proficiency averages 62% at this address vs 32% district-wide (+30 pts) — the actual schools serving this property are materially stronger than the Georgetown 01 average implies; a family-tenant draw the district grade alone would hide.
- Market conditions: 398 active listings in the ZIP; 5 comparable units currently listed for rent nearby; rentals at typical pace (median 25d on market — plan ~3-4 weeks tenant-placement turnaround); 323 units permitted in Georgetown County in 2024 (0 in 5+ unit buildings).
Forward outlook
- Local home prices are declining (-3.0%/yr); year-one equity from $588 of loan paydown is wiped out by about $3k of value loss. Plan a longer hold.
- At projected returns (-3.0% appreciation + 3.0% rent growth), your $24k cash investment doubles in ~9 years — after that, you're playing with house money.
Negotiation context
- It's been on market 31 days — a 3% lower offer ($82k) is reasonable based on typical stale-listing flexibility.
Risks & watch-outs
- Watch-outs: flood insurance adds $427/mo.
- Climate carrying-cost: in FEMA flood zone AE (mandatory federal flood insurance); severe wind risk, 99% chance of damaging wind over 30y; extreme-heat days projected 7→18/yr by 2055 (HVAC capex compounding) — expect insurance premiums to compound above CPI over the hold.
Questions for the listing agent
- It's been on market 31 days. Have you received any prior offers? Is the seller open to a 3% concession, seller financing, or rate buy-down credit?
- Built in 1978 — when were the roof, HVAC, electrical panel, plumbing, and water heater last replaced?
- What's the actual annual flood-insurance premium (NFIP or private), and is the property in a SFHA with mandatory coverage?
- What does the HOA fee cover, when was the last increase, and are there any pending special assessments or reserve-fund shortfalls?
- Any open or pending special assessments — roof, HVAC, plumbing, elevator, façade? What's the per-unit balance and payoff schedule, and is the seller paying it off at close or rolling it to the buyer?
- Is there a deadline driving the sale (1031 exchange, divorce, estate, relocation)? That informs how much negotiation room exists.
- What's the average days-on-market for RENTAL listings here right now (not sales)? A rising rental-DOM trend means longer vacancies and softer asking-rent achievability than the comps imply.
- What's the recent tenant-quality profile in this submarket — average credit score on applications, eviction rate, late-payment / NSF rate, and stable-employment percentage? A property-management company in the area should have these aggregated.
- How much new apartment / multifamily construction is in the pipeline within 1–3 miles? Heavy new supply (>2% of stock underway) typically softens rents 12–24 months out; light construction supports rent growth.
Investment metrics
- 1% rule
- 2.32% ✓
- Cap rate
- 15.86%
- Cash-on-cash
- 34.16%
- DSCR
- 2.52
- GRM
- 3.6
CMA / ARV
No comps found within radius.
Projected returns pro-forma
-3.0% appreciation · 3.0% rent growth · sell at horizon
- IRR
- 2.9%
- Equity multiple
- 1.11×
- Total profit
- $2,678
- Equity at exit
- $12,674
- IRR
- 12.9%
- Equity multiple
- 2.04×
- Total profit
- $24,825
- Equity at exit
- $7,349
Cash invested: $23,800 (down + closing). Projections, not guarantees.
Landlord ↔ Tenant lean methodology
- Overall (STATE)
- 90 Strongly Landlord-Friendly
- State South Carolina
- 90 Strongly Landlord-Friendly · R+6
- County
- — inherits STATE
- City
- — inherits STATE
ZIP-level market 29585
- Home prices YoY
- -29.0%
- Active inventory
- 398
- Price-to-rent
- 3.6×
Monthly cashflow live
- Estimated rent
- $1,971 high interval (Pro) →
- Mortgage (P&I)
- −$446
- Tax est. 1.5%
- −$106 /mo · $1,275/yr
- Insurance
- −$35
- Flood insurance flood zone
- −$427 /mo · $5,118/yr
- HOA
- −$292
- Vacancy / Maint / Mgmt
- −$414
- Net cashflow
- $251
Break-even live
Sensitivity live
| Price | -10% $310 | -5% $280 | +0% $251 | +5% $222 | +10% $192 |
|---|---|---|---|---|---|
| Rent | -10% $95 | -5% $173 | +0% $251 | +5% $329 | +10% $407 |
| Rate | -1.0pp $294 | -0.5pp $273 | base $251 | +0.5pp $229 | +1.0pp $206 |
UW: 25.0% down · 7.5% · 30yr · 1.5% tax · 5.0% vac · 8.0% maint · 8.0% mgmt
Financing live
Cash to close
- Down payment
- $21,250
- Closing costs
- $2,550
- Reserves months
- —
- Total cash needed
- —
Loan-product check · same deal, 3 products live
Conventional
25% down · 7.5% · 30yr
- Down + closing
- —
- Monthly P&I
- —
- Monthly cashflow
- —
- DSCR
- —
- Eligible?
- —
Personal DTI + credit; lowest rate.
DSCR
20% down · 8.5% · 30yr
- Down + closing
- —
- Monthly P&I
- —
- Monthly cashflow
- —
- DSCR
- —
- Eligible?
- —
No personal income docs; deal must DSCR.
Hard money
10% down · 12.0% · 12mo
- Down + closing
- —
- Monthly P&I
- —
- Monthly cashflow
- —
- DSCR
- —
- Eligible?
- —
Short-term bridge; refi at stabilization.
Rent comps 5 comps
| Address | Beds | Baths | Sqft | Rent | $/sqft | DOM | Units | Dist |
|---|---|---|---|---|---|---|---|---|
| 435 Salt Marsh Cir Unit 19F Pawleys Island, SC | 2.0 | 2.0 | 850 | $1,600 | $1.88 | 25d | 1 | 0.52mi |
| 84 Racquet Club Dr Unit WVC 14 Pawleys Island, SC | 3.0 | 2.0 | 1471 | $2,700 | $1.84 | 25d | 1 | 0.68mi |
| 105 Weatherboard Ct Pawleys Island, SC | 3.0 | 3.0 | 1480 | $2,500 | $1.69 | 25d | 1 | 0.76mi |
| 5 Ashcraft Cir Pawleys Island, SC | 2.0–3.0 | 2.0 | 1074 | $1,560 | $1.45 | 15d | 10 | 0.76mi |
| 736 Algonquin Dr Unit Pawleys Pavilion 736H Pawleys Island, SC | 3.0 | 2.0 | 1250 | $1,700 | $1.36 | 25d | 1 | 1.00mi |
HOA detail condo
- Monthly dues
- $292 · $3,504/yr
- Likely covers
- water
- Assessments
- None detected in remarks — confirm with the listing agent.
Listing history 11 events
-
2026-06-07statusdays on market $85,000 Pending 31 DOM
-
2026-06-03days on market $85,000 Active Under Contract 29 DOM
-
2026-06-02days on market $85,000 Active Under Contract 28 DOM
-
2026-06-01days on market $85,000 Active Under Contract 27 DOM
-
2026-05-31days on market $85,000 Active Under Contract 26 DOM
-
2026-05-30days on market $85,000 Active Under Contract 25 DOM
-
2026-05-14historical Active Under Contract
-
2026-05-05$85,000 Active
-
2023-11-17soldstatus $80,000
-
2023-05-18soldstatus $75,000
-
2022-05-17soldstatus $160,000
ⓘ Source: listings_history table (triggers on properties + properties_extension) + one-shot
backfill from property_details.listing_events for pre-trigger history.
Climate risk First Street
- Flood 10/10 Extreme FEMA zone AE · 99% chance over 30 yrs
- Wildfire 2/10 Low
- Heat 9/10 Extreme 7 d/yr ≥106°F today · 18 d/yr by 30 yrs out
- Wind 9/10 Extreme 99% chance of damaging wind over 30 yrs
- Air quality 2/10 Low 0 unhealthy d/yr today · 1 by 30 yrs out
Nearby sold comps map
Loading sold comps map…
Walkable amenities ~0.75 mi
Loading nearby amenities…
Taxation est. · year 1
- Rental income
- $23,649
- − Mortgage interest
- −$4,761
- − Property taxes
- −$1,275
- − Insurance
- −$5,544
- − Repairs & maintenance
- −$1,892
- − Management
- −$1,892
- − HOA
- −$3,504
- − Depreciation
- −$2,473
- Taxable income
- $2,308
- Est. tax owed @ 24.0%
- −$554
- After-tax cash flow
- $2,457/yr
For passive investors: Depreciation is non-cash, so a rental often shows a tax loss while cash-flowing — sheltering income. Rental losses are passive: they offset passive income freely, and up to $25,000/yr can offset ordinary (W-2) income if you actively participate and your MAGI is under $100k (phasing out to $0 by $150k); unused losses carry forward. On sale, claimed depreciation is recaptured at up to 25%, and gains may owe capital-gains tax (a 1031 exchange can defer both). Figures are a year-1 estimate at your 24.0% rate — not tax advice; consult a CPA.
Schools (NCES district)
- District
- Georgetown 01
- NCES district ID
- 4502280
- Math proficiency
- 26% ▼ -11.00%
- Reading proficiency
- 38% ▼ -5.00%
- Median HH income
- $43,045
- Composite
- 27.15/100
- National rank
- #7030
- State rank
- #51 of 80 in SC
Livability — Litchfield Beach
No livability data for this city. (Only ~50 U.S. cities are tracked.)
Census & demographics
- Census place
- Litchfield Beach, SC
- Population (ZIP)
- 17,346
Population outlook (Georgetown County) Hauer SSP2
- Today (2025)
- 63,275 people
- By 2030
- 63,630 · +0.6%
- By 2040
- 63,130 · -0.2%
- By 2050
- 61,904 · -2.2%
- By 2075
- 59,305 · -6.3%
- By 2100
- 53,852 · -14.9%
Race, ethnicity, and origin ACS 2023
- Neighborhood character
- Predominantly White (86%)
- Race & ethnicity
- White 86% Black 7% Two or more races 4% Hispanic / Latino 3%
- Common ancestry
- Slovak 4% Romanian 3% Italian 3%
- Foreign-born
- 2% · Canada
- Languages at home
- 98% English-only · Spanish 1%
Political lean MEDSL · Georgetown
- 2024 margin
- R (+19.5) · D 39.6% · R 59.1% · Other 1.2%
- 2008→2024 swing
- -14.2pp toward R · 2008: -5.2pp · 2024: -19.5pp
- All cycles
- 2024: R+19.5 2020: R+12.7 2016: R+13.0 2012: R+7.6 2008: R+5.2
Not yet ingested
- Civics
- —
Market trends
- HPI YoY
- ▼ -86.24%
- Current HPI
- 211.3537
- Rent YoY
- —
- Metro
- —
- State GDP YoY
- ▲ 4.51%
- F500 in state
- 2
Industry mix (Fortune 500 HQ in SC)
| Industry | F500 HQs | Revenue |
|---|---|---|
| Packaging | 1 | $7B |
|
||
Price history
-46.9% since first listed5 events — show timeline
- 2026-05-14 Contingent — CCAR
- 2026-05-05 Listed $85,000 CCAR
- 2023-11-17 Sold (Public Records) $80,000 Public Records
- 2023-05-18 Sold (Public Records) $75,000 Public Records
- 2022-05-17 Sold (Public Records) $160,000 Public Records
Property tax history
+3.6%/yrLatest (2025): $8,516 · +6.7% YoY. Source: county tax records.
Cash-flow waterfall
monthlySold comps — $/sqft
last 12 mo · ≤1 miLoading sold comps…