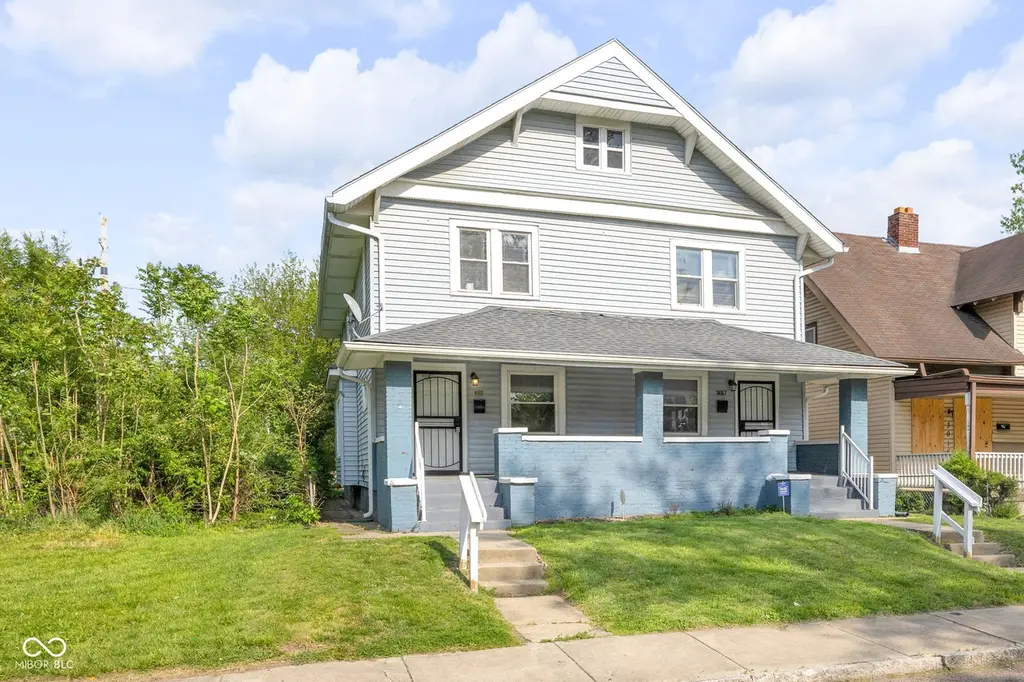
 Duplex
3017 Broadway St · Indianapolis city (balance), IN
Flood risk 9/10 · Severe
- FEMA flood zone
- X (unshaded)
- Chance of flooding over 30 yrs
- 0.99%
- Est. flood insurance / yr
- $473 – $860
Fire risk 1/10 · Minimal
- Est. fire insurance / yr
- $717 – $1,331
Heat risk 4/10 · Minor
- Hot days now (above 101°F)
- 7 days/yr
- Hot days in 30 yrs
- 19 days/yr
Wind risk 2/10 · Minimal
- Chance of severe wind over 30 yrs
- 0.0%
Air-quality risk 4/10 · Minor
- Unhealthy air days now
- 5 days/yr
- Unhealthy air days in 30 yrs
- 7 days/yr
Risk factors via First Street. Map © Google.
Why this score? — see what drove the D+ grade
The composite is a weighted blend of 9 inputs, each scored 0–100. Each bar is that input's sub-score; the figure is the points it added to the 100-point composite (weight × sub-score).
- Cash flow +14.0/30.0
- ARV discount +13.2/15.0
- DSCR +4.2/10.0
- 1% rule +4.1/10.0
- Rent growth +4.1/5.0
- Livability +2.5/5.0
- Condition / age +2.5/5.0
- Schools +1.4/10.0
- Appreciation +0.0/10.0
$295,000
🖨 Deal sheet (PDF) 📄 Offer letter ✓ Due diligence
Multi-family units
County records classify this as Multi-Family (2-4 Unit). Listing-text estimate: 2 units. confirmed
Listing remarks MLS
MAPLETON FALL-CREEK DUPLEX // This updated duplex offers a vacant side for your finishing touches as well as the other side with long-term tenant willing to continue a lease for another year! Make this part of your investment portfolio in Indy or be an owner-occupant!
Key facts
- Updated duplex
- Freshly painted
- Elevated ceilings
Tags
Property features AI
Finance
- Financial info: Two-unit building; Gross income reported: 30,819; Net operating income reported: 16,819; Expenses reported: 11,000; Owner pays insurance and taxes; One unit rent listed at $1,225 per month
Exterior
- Parking: Unpaved unit parking
- Utilities: Separate gas meter; Water connected; Sewer connected
- Home design: Duplex residential income property; Two stories
- Construction: Vinyl siding
- Exterior features: Shingle roof; Has a view
Interior
- Kitchen: Eat-in kitchen; Kitchen approx. 10x10 (for one unit)
- Bedrooms: 3-bedroom unit (one unit described; building is a duplex)
- Heating & cooling: Forced air heating; Central air conditioning; Separate meters
- Interior features: Updated/remodeled condition; Has unfinished basement
- Laundry & utility: Other laundry features
Neighborhood map
What this means for you Summary
Snapshot
- This is a 2 × 3-bed/2.0-bath units multifamily listed at $295k.
Deal economics
- At list price, monthly cash flow is $-18 ($-221/yr) — negative. Per door: $-9/mo.
- To cash-flow at today's rent, offer at most $292k (1.1% below list).
- To meet the 1% rule (rent ≥ 1% of price), the offer needs to be $268k (9.1% below list).
- Recommended offer: $268k (9.1% below list) — sets the bar for 1% rule.
- Cap rate 6.4% vs local median 4.4% in Indianapolis city (balance) — top-decile yield for the area; either an underpriced asset or a hidden risk that comps aren't pricing in. Stress-test before assuming the spread holds.
Location & tenants
- Location reads: area grade D — affects rentability + tenant quality, not the cash-flow math above.
- Indianapolis Public Schools (urban): math 14% / reading 20% proficiency, ranked #286 of 301 in IN (top 95%) — low school quality limits family demand, transient renter base, plan for 1-2y turnover; 77% free/reduced lunch — lower-income household profile, screen leases tightly.
- Zoned schools: Center For Inquiry School 27 (math 25% / reading 29%, grade F, #737 of 994 statewide, top 76%, 525 students, 51% FRL); H L Harshman Middle School (math 3% / reading 16%, grade F, #316 of 330 statewide, top 96%, 549 students, 84% FRL); Arsenal Technical High School (math 6% / reading 27%, grade F, #353 of 369 statewide, top 96%, 2,366 students, 74% FRL).
- Market conditions: Rents rising fast (+6.2%/yr); 317 active listings in the ZIP; 40 comparable units currently listed for rent nearby; rentals at typical pace (median 26d on market — plan ~3-4 weeks tenant-placement turnaround); 1,906 units permitted in Marion County in 2024 (621 in 5+ unit buildings).
- This rent runs 44% of the median local income ($72k/yr) — at the standard rent-burdened threshold; future hikes will face affordability resistance.
Forward outlook
- Local home prices are declining (-3.0%/yr); year-one equity from $2k of loan paydown is wiped out by about $9k of value loss. Plan a longer hold.
- Marion County population projected at +18% by 2050 — long-run rental-demand tailwind backs the buy-and-hold thesis.
Negotiation context
- It's been on market 16 days — a 2% lower offer ($291k) is reasonable based on typical stale-listing flexibility.
- 3 sale attempts since 6y ago with the ask held roughly flat each time — persistent listings suggest the price (not the market) is what's stuck; bring a comps-based counter.
Risks & watch-outs
- Watch-outs: flood insurance adds $56/mo; built in 1915 — expect roof / HVAC / electrical / plumbing capex.
- Climate carrying-cost: severe flood risk — expect insurance premiums to compound above CPI over the hold.
Questions for the listing agent
- What do current leases actually rent for vs. the listed asking? Can we see a recent rent roll and the last 12 months of T-12 income?
- Can we see the unit-by-unit rent roll, current vacancy, and any below-market leases? What's the average tenancy length?
- What capital expenditures (roof, boiler, parking lot, exteriors) have been made in the last 5 years, and what's planned in the next 2?
- Built in 1915 — when were the roof, HVAC, electrical panel, plumbing, and water heater last replaced?
- What's the actual annual flood-insurance premium (NFIP or private), and is the property in a SFHA with mandatory coverage?
- Is there a deadline driving the sale (1031 exchange, divorce, estate, relocation)? That informs how much negotiation room exists.
- The area grade is low — what's the realistic commute time and amenity access for the typical tenant pool here? Any planned neighborhood developments (good or bad) we should know about?
- What's the average days-on-market for RENTAL listings here right now (not sales)? A rising rental-DOM trend means longer vacancies and softer asking-rent achievability than the comps imply.
- What's the recent tenant-quality profile in this submarket — average credit score on applications, eviction rate, late-payment / NSF rate, and stable-employment percentage? A property-management company in the area should have these aggregated.
- How much new apartment / multifamily construction is in the pipeline within 1–3 miles? Heavy new supply (>2% of stock underway) typically softens rents 12–24 months out; light construction supports rent growth.
Investment metrics
- 1% rule
- 0.91% ✗
- Cap rate
- 6.44%
- Cash-on-cash
- 0.54%
- DSCR
- 1.02
- GRM
- 9.2
CMA / ARV
- ARV (median comp)
- $338,146
- List price
- $295,000
- Delta
- -12.76%
- Verdict
- UNDERPRICED
- Comps
- 20 within 1.0 mi
Show comp detail 1 sale within ~0.75 mi
| Address | Dist | Beds/Ba | Sqft | Sold | Price | $/sf | Match |
|---|---|---|---|---|---|---|---|
| 2625 Central Ave | 0.45mi | 4/4.0 (+1) | 1,570 (+0%) | 2mo | $445,000 | $283 | 59 |
Match score weights: distance 35% · size 25% · config 20% · recency 20%. Top-matched comps best support the ARV.
Projected returns pro-forma
-3.0% appreciation · 6.21% rent growth · sell at horizon
- IRR
- -13.0%
- Equity multiple
- 0.52×
- Total profit
- $-39,935
- Equity at exit
- $43,985
- IRR
- 0.5%
- Equity multiple
- 1.04×
- Total profit
- $3,316
- Equity at exit
- $25,506
Cash invested: $82,600 (down + closing). Projections, not guarantees.
Landlord ↔ Tenant lean methodology
- Overall (STATE)
- 90 Strongly Landlord-Friendly
- State Indiana
- 90 Strongly Landlord-Friendly · R+11
- County
- — inherits STATE
- City
- — inherits STATE
ZIP-level market 46205
- Rents YoY
- 6.2%
- Active inventory
- 317
- Price-to-rent
- 18.3×
Monthly cashflow live
- Estimated rent
- $2,682 high interval (Pro) →
- Mortgage (P&I)
- −$1,547
- Tax from tax record
- −$412 /mo · $4,941/yr
- Insurance
- −$123
- Flood insurance flood zone
- −$56 /mo · $666/yr
- HOA
- −$0
- Vacancy / Maint / Mgmt
- −$563
- Net cashflow
- $-18
Break-even live
Sensitivity live
| Price | -10% $149 | -5% $65 | +0% $-18 | +5% $-102 | +10% $-185 |
|---|---|---|---|---|---|
| Rent | -10% $-230 | -5% $-124 | +0% $-18 | +5% $88 | +10% $193 |
| Rate | -1.0pp $130 | -0.5pp $57 | base $-18 | +0.5pp $-95 | +1.0pp $-173 |
2-unit breakdown (identical units grouped — click to expand)
| Units | Beds | Baths | Est. rent |
|---|---|---|---|
| 2× units | 3 | 2 | $2,682 |
| #1 | 3 | 2 | $1,341 |
| #2 | 3 | 2 | $1,341 |
| Total (2 units) | $2,682 | ||
UW: 25.0% down · 7.5% · 30yr · 1.5% tax · 5.0% vac · 8.0% maint · 8.0% mgmt
Financing live
Cash to close
- Down payment
- $73,750
- Closing costs
- $8,850
- Reserves months
- —
- Total cash needed
- —
Loan-product check · same deal, 3 products live
Conventional
25% down · 7.5% · 30yr
- Down + closing
- —
- Monthly P&I
- —
- Monthly cashflow
- —
- DSCR
- —
- Eligible?
- —
Personal DTI + credit; lowest rate.
DSCR
20% down · 8.5% · 30yr
- Down + closing
- —
- Monthly P&I
- —
- Monthly cashflow
- —
- DSCR
- —
- Eligible?
- —
No personal income docs; deal must DSCR.
Hard money
10% down · 12.0% · 12mo
- Down + closing
- —
- Monthly P&I
- —
- Monthly cashflow
- —
- DSCR
- —
- Eligible?
- —
Short-term bridge; refi at stabilization.
Rent comps 40 comps
| Address | Beds | Baths | Sqft | Rent | $/sqft | DOM | Units | Dist |
|---|---|---|---|---|---|---|---|---|
| 2960 N Park Ave Indianapolis, IN | 3.0 | 1.5 | 1400 | $1,550 | $1.11 | 25d | 1 | 0.09mi |
| 2960 N Park Ave Indianapolis, IN | 3.0 | 1.5 | 1400 | $1,550 | $1.11 | 0d | 1 | 0.09mi |
| 2960 N Park Ave Indianapolis, IN | 3.0 | 2.0 | 1400 | $1,595 | $1.14 | 45d | 1 | 0.09mi |
| 2958 N Park Ave Unit 2958 Indianapolis, IN | 3.0 | 1.5 | 1350 | $1,450 | $1.07 | 5d | 1 | 0.10mi |
| 3106 N College Ave Indianapolis, IN | 3.0 | 1.5 | 1400 | $1,700 | $1.21 | 9d | 1 | 0.11mi |
| 3128 Broadway St Indianapolis, IN | 4.0 | 1.5 | 1999 | $2,200 | $1.10 | 25d | 1 | 0.14mi |
| 2950 Ruckle St Indianapolis, IN | 3.0 | 1.0 | 1450 | $1,300 | $0.90 | 45d | 1 | 0.16mi |
| 3141 N Park Ave Indianapolis, IN | 3.0 | 1.0 | 1390 | $1,000 | $0.72 | 45d | 1 | 0.17mi |
| 2920 Ruckle St Indianapolis, IN | 3.0 | 1.5 | 1272 | $1,700 | $1.34 | 9d | 1 | 0.20mi |
| 2920 Ruckle St Indianapolis, IN | 3.0 | 1.5 | 1272 | $1,700 | $1.34 | 0d | 1 | 0.20mi |
| 2830 N Park Ave Indianapolis, IN | 2.0 | 3.0 | 1500 | $1,600 | $1.07 | 45d | 1 | 0.22mi |
| 321 E 31st St Indianapolis, IN | 3.0 | 1.0 | 1390 | $1,400 | $1.01 | 45d | 1 | 0.29mi |
| 2950 Winthrop Ave Indianapolis, IN | 3.0 | 2.0 | 1224 | $1,449 | $1.18 | 45d | 1 | 0.32mi |
| 3110 Guilford Ave Indianapolis, IN | 3.0 | 1.5 | 1250 | $1,295 | $1.04 | 25d | 1 | 0.32mi |
| 3203 Sutherland Ave Unit 1310761P Indianapolis, IN | 2.0 | 1.0 | 1097 | $3,668 | $3.34 | 4d | 1 | 0.32mi |
| 2751 Guilford Ave Unit B Indianapolis, IN | 3.0 | 2.0 | 1250 | $1,750 | $1.40 | 16d | 1 | 0.36mi |
| 2751 Guilford Ave Unit A Indianapolis, IN | 3.0 | 2.0 | 1250 | $1,750 | $1.40 | 0d | 1 | 0.36mi |
| 2751 Guilford Ave Unit Aunit Indianapolis, IN | 3.0 | 2.0 | 1250 | $1,750 | $1.40 | 45d | 1 | 0.36mi |
| 3208 Guilford Ave Indianapolis, IN | 3.0 | 3.0 | 1800 | $1,700 | $0.94 | 14d | 1 | 0.37mi |
| 2709 N College Ave Indianapolis, IN | 3.0 | 2.0 | 1500 | $2,200 | $1.47 | 25d | 1 | 0.37mi |
| 2707 N College Ave Indianapolis, IN | 3.0 | 2.0 | 1500 | $2,200 | $1.47 | 19d | 1 | 0.38mi |
| 3139 Guilford Ave Indianapolis, IN | 3.0 | 1.0 | 1068 | $1,345 | $1.26 | 45d | 1 | 0.38mi |
| 2955 N Delaware St Indianapolis, IN | 3.0 | 1.5 | 1400 | $1,600 | $1.14 | 45d | 1 | 0.38mi |
| 514 E 33rd St Indianapolis, IN | 3.0 | 1.0 | 1208 | $1,200 | $0.99 | 25d | 1 | 0.38mi |
| 512 E 33rd St Indianapolis, IN | 3.0 | 1.0 | 1208 | $1,200 | $0.99 | 25d | 1 | 0.38mi |
| 3004 N Delaware St Indianapolis, IN | 3.0 | 1.5 | 1600 | $1,549 | $0.97 | 0d | 1 | 0.40mi |
| 2925 N Delaware St Indianapolis, IN | 3.0 | 1.5 | 1322 | $1,275 | $0.96 | 25d | 1 | 0.40mi |
| 2923 N Delaware St Indianapolis, IN | 3.0 | 1.5 | 1320 | $1,350 | $1.02 | 0d | 1 | 0.40mi |
| 2711 Guilford Ave Indianapolis, IN | 3.0 | 2.0 | 1250 | $1,695 | $1.36 | 25d | 1 | 0.42mi |
| 3365 Broadway St Indianapolis, IN | 3.0 | 2.0 | 1300 | $1,700 | $1.31 | 45d | 1 | 0.44mi |
| 3359 N College Ave Indianapolis, IN | 2.0 | 1.5 | 1450 | $1,795 | $1.24 | 12d | 1 | 0.45mi |
| 3359 N College Ave Unit 3359 Indianapolis, IN | 2.0 | 1.5 | 1082 | $1,895 | $1.75 | 25d | 1 | 0.45mi |
| 3370 N College Ave Indianapolis, IN | 3.0 | 1.0 | 1680 | $1,275 | $0.76 | 4d | 1 | 0.45mi |
| 2901 N Talbott St Indianapolis, IN | 3.0 | 1.5 | 1388 | $1,400 | $1.01 | 0d | 1 | 0.46mi |
| 2901 N Talbott St Indianapolis, IN | 3.0 | 1.5 | 1388 | $1,400 | $1.01 | 45d | 1 | 0.46mi |
| 728 E 34th St Indianapolis, IN | 3.0 | 1.0 | 1491 | $1,400 | $0.94 | 22d | 1 | 0.48mi |
| 728 E 34th St Indianapolis, IN | 3.0 | 1.0 | 1491 | $1,400 | $0.94 | 6d | 1 | 0.48mi |
| 2614 Guilford Ave Unit 2614 Indianapolis, IN | 3.0 | 1.0 | 1176 | $1,645 | $1.40 | 0d | 1 | 0.48mi |
| 2813 N Talbott St Indianapolis, IN | 3.0 | 2.0 | 1297 | $1,800 | $1.39 | 45d | 1 | 0.50mi |
| 2801 N Talbott St Unit A Indianapolis, IN | 3.0 | 2.0 | 1296 | $1,850 | $1.43 | 45d | 1 | 0.50mi |
Listing history 6 events
-
2026-05-11status Pending 576-char remark
-
2026-04-25$295,000 Active 576-char remark
-
2025-05-30historical
-
2025-04-26
-
2020-07-23$160,000 Active 268-char remark
Show marketing remark (268 chars)
MAPLETON FALL-CREEK DUPLEX // This updated duplex offers a vacant side for your finishing touches as well as the other side with long-term tenant willing to continue a lease for another year! Make this part of your investment portfolio in Indy or be an owner-occupant!
-
2020-07-22soldstatus $160,000 Sold 268-char remark
Show marketing remark (268 chars)
MAPLETON FALL-CREEK DUPLEX // This updated duplex offers a vacant side for your finishing touches as well as the other side with long-term tenant willing to continue a lease for another year! Make this part of your investment portfolio in Indy or be an owner-occupant!
ⓘ Source: listings_history table (triggers on properties + properties_extension) + one-shot
backfill from property_details.listing_events for pre-trigger history.
Tax reassessment forecast IN · Partial reset (capped growth)
- Current annual tax
- $4,941 · $412/mo
- Projected year-2 tax
- $4,941 · $412/mo
- Expected delta
- $0/yr ($0/mo · 0.0%)
ⓘ Screening estimate from a state-policy table — verify with the county assessor before closing.
Climate risk First Street
- Flood 9/10 Extreme FEMA zone X (unshaded) · 99% chance over 30 yrs
- Wildfire 1/10 Low
- Heat 4/10 Moderate 7 d/yr ≥101°F today · 19 d/yr by 30 yrs out
- Wind 2/10 Low 0% chance of damaging wind over 30 yrs
- Air quality 4/10 Moderate 5 unhealthy d/yr today · 7 by 30 yrs out
Nearby sold comps map
Loading sold comps map…
Walkable amenities ~0.75 mi
Loading nearby amenities…
Taxation est. · year 1
- Rental income
- $32,184
- − Mortgage interest
- −$16,525
- − Property taxes
- −$4,941
- − Insurance
- −$2,142
- − Repairs & maintenance
- −$2,575
- − Management
- −$2,575
- − Depreciation
- −$8,582
- Taxable loss
- −$5,154
- Est. tax savings @ 24.0%
- +$1,237
- After-tax cash flow
- $1,016/yr
For passive investors: Depreciation is non-cash, so a rental often shows a tax loss while cash-flowing — sheltering income. Rental losses are passive: they offset passive income freely, and up to $25,000/yr can offset ordinary (W-2) income if you actively participate and your MAGI is under $100k (phasing out to $0 by $150k); unused losses carry forward. On sale, claimed depreciation is recaptured at up to 25%, and gains may owe capital-gains tax (a 1031 exchange can defer both). Figures are a year-1 estimate at your 24.0% rate — not tax advice; consult a CPA.
Schools (NCES district)
- District
- Indianapolis Public Schools
- NCES district ID
- 1804770
- Math proficiency
- 14% ▼ -7.00%
- Reading proficiency
- 20% ▼ -3.00%
- Median HH income
- $32,034
- Composite
- 13.69/100
- National rank
- #9499
- State rank
- #286 of 301 in IN
Livability — Indianapolis city (balance)
No livability data for this city. (Only ~50 U.S. cities are tracked.)
Census & demographics
- Census place
- Indianapolis city (balance), IN
- County
- Marion County · 998,460 people
- City population
- 881,119
- Metro
- Indianapolis-Carmel-Anderson, IN
- Population (ZIP)
- 28,259
- Household income
- $72,417
- Rent vs Own
- Severe rent burden
- 1149.0
Population outlook (Marion County) Hauer SSP2
- Today (2025)
- 1,025,572 people
- By 2030
- 1,065,727 · +3.9%
- By 2040
- 1,141,577 · +11.3%
- By 2050
- 1,208,920 · +17.9%
- By 2075
- 1,367,288 · +33.3%
- By 2100
- 1,438,201 · +40.2%
Race, ethnicity, and origin ACS 2023
- Neighborhood character
- Diverse neighborhood (Simpson 0.64)
- Race & ethnicity
- White 50% Black 32% Two or more races 10% Hispanic / Latino 7% Asian 3%
- Hispanic origin (detail)
- Mexican 4%
- Common ancestry
- Italian 3% Slovak 2% Romanian 2%
- Foreign-born
- 5% · Canada
- Languages at home
- 89% English-only · Spanish 6% Other Indo-European 2% German/W. Germanic 1%
Political lean MEDSL · Marion
- 2024 margin
- Strong D (+27.7) · D 63.0% · R 35.3% · Other 1.7%
- 2008→2024 swing
- -0.7pp no change · 2008: 28.4pp · 2024: 27.7pp
- All cycles
- 2024: D+27.7 2020: D+29.1 2016: D+22.8 2012: D+22.2 2008: D+28.4
Not yet ingested
- Civics
- —
Market trends
- HPI YoY
- ▼ -322.77%
- Current HPI
- 380.5407
- Rent YoY
- ▲ 6.21%
- Metro
- Indianapolis-Carmel-Anderson, IN
- State GDP YoY
- ▲ 2.90%
- F500 in state
- 18
Industry mix (Fortune 500 HQ in IN)
| Industry | F500 HQs | Revenue |
|---|---|---|
| Industrial Machinery | 2 | $37B |
|
||
| Healthcare | 1 | $177B |
|
||
| Pharmaceuticals | 1 | $45B |
|
||
| Metals / Steel | 1 | $18B |
|
||
| Agriculture | 1 | $17B |
|
||
| Packaging | 1 | $12B |
|
||
Price history
+70.3% since first listed7 events — show timeline
- 2026-06-12 Sold (MLS) $272,530 MIBOR as Distributed by MLS Grid
- 2026-05-11 Pending — MIBOR as Distributed by MLS Grid
- 2026-04-25 Listed $295,000 MIBOR as Distributed by MLS Grid
- 2025-05-30 Rental Removed — RENTEC
- 2025-04-26 Listed for Rent — RENTEC
- 2020-07-23 Listed $160,000 MIBOR as Distributed by MLS Grid
- 2020-07-22 Sold (MLS) $160,000 MIBOR as Distributed by MLS Grid
Property tax history
+7.7%/yrLatest (2025): $4,941 · +2.6% YoY. Source: county tax records.
Cash-flow waterfall
monthlySold comps — $/sqft
last 12 mo · ≤1 miLoading sold comps…