705 Sandpiper Dr · Hartsville, SC
Flood risk 1/10 · Minimal
- FEMA flood zone
- X (unshaded)
- Chance of flooding over 30 yrs
- 0.0%
- Est. flood insurance / yr
- $507 – $1,088
Fire risk 5/10 · Moderate
- Est. fire insurance / yr
- $783 – $1,453
Heat risk 7/10 · Major
- Hot days now (above 108°F)
- 7 days/yr
- Hot days in 30 yrs
- 16 days/yr
Wind risk 8/10 · Major
- Chance of severe wind over 30 yrs
- 80.0%
Air-quality risk 2/10 · Minimal
- Unhealthy air days now
- 0 days/yr
- Unhealthy air days in 30 yrs
- 1 days/yr
Risk factors via First Street. Map © Google.
Why this score? — see what drove the D grade
The composite is a weighted blend of 9 inputs, each scored 0–100. Each bar is that input's sub-score; the figure is the points it added to the 100-point composite (weight × sub-score).
- Cash flow +15.0/30.0
- ARV discount +7.5/15.0
- 1% rule +5.0/10.0
- DSCR +5.0/10.0
- Livability +3.0/5.0
- Schools +2.7/10.0
- Rent growth +2.5/5.0
- Condition / age +2.5/5.0
- Appreciation +0.0/10.0
$33,900
🖨 Deal sheet (PDF) 📄 Offer letter ✓ Due diligence
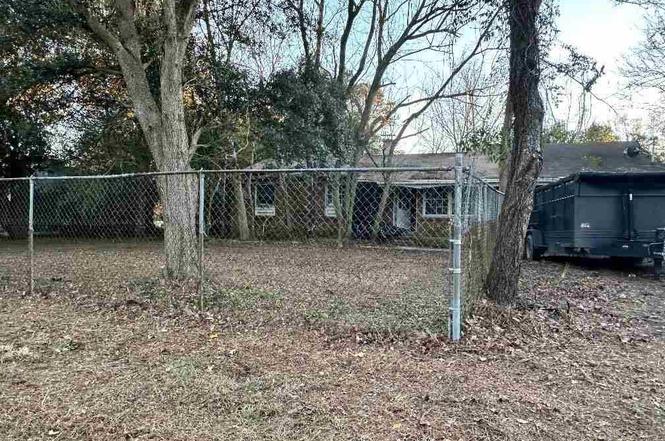
Listing remarks
Large lot in small community, close to amenities. Make this 3 bedroom one bath your own. Fenced lot and enclosed carport. Sold as is. Make your appointment today.
Key facts
- Enclosed carport
- Large lot
- Close to amenities
Tags
Property features AI
Exterior
- Utilities: Public water; Public sewer
- Home design: Single-family residence; Residential property
- Construction: Brick veneer construction; Built area above grade: 1,634
- Exterior features: Porch; Fenced yard; Shingle roof
Interior
- Bathrooms: 1 full bathroom
- Heating & cooling: Ceiling fan(s); Exhaust fan; Has heating and cooling
- Interior features: Crawl space basement
Neighborhood map
What this means for you Summary
Snapshot
- This is a 3-bed/1.0-bath other listed at $34k.
Deal economics
- At list price, monthly cash flow is $922 ($11k/yr) — positive.
- The deal already cash-flows at list — no discount required.
- Meets the 1% rule at list price ($1k rent vs $34k).
- Recommended offer: $30k (12.0% below list) — sets the bar for market timing.
- Cap rate 38.9% vs local median 3.7% in Hartsville — top-decile yield for the area; either an underpriced asset or a hidden risk that comps aren't pricing in. Stress-test before assuming the spread holds.
Location & tenants
- Location reads 60/100 on livability (#224 in SC) — a middle-class / working-renter tenant base. Strengths: cost of living A+, housing A+, health & safety B+; Watch: crime F, amenities F, commute F.
- Darlington 01 (town): math 27% / reading 37% proficiency, ranked #52 of 80 in SC (top 65%) — families likely to look elsewhere, expect single-tenant / working-renter base with shorter leases; 75% free/reduced lunch — lower-income household profile, screen leases tightly.
- Zoned schools: Bay Road Elementary (math 20%, 540 students, 100% FRL); Hartsville Middle (math 23% / reading 31%, grade F, #153 of 229 statewide, top 68%, 921 students, 100% FRL); Hartsville High (math 42% / reading 80%, grade C+, #105 of 196 statewide, top 54%, 1,133 students, 100% FRL) — zoned schools average 100% FRL vs 75% district-wide (25 pts higher); higher-poverty schools than district average — tighter screening recommended.
- Zoned-school proficiency averages 44% at this address vs 32% district-wide (+12 pts) — the actual schools serving this property are materially stronger than the Darlington 01 average implies; a family-tenant draw the district grade alone would hide.
- Market conditions: 155 active listings in the ZIP; 195 units permitted in Darlington County in 2024 (0 in 5+ unit buildings).
Forward outlook
- Local home prices are declining (-3.0%/yr); year-one equity from $234 of loan paydown is wiped out by about $1k of value loss. Plan a longer hold.
- Darlington County population projected at -18% by 2050 — secular population decline; favor cash flow + early exit over multi-decade hold.
- At projected returns (-3.0% appreciation + 3.0% rent growth), your $9k cash investment doubles in ~1 year — after that, you're playing with house money.
Negotiation context
- It's been on market 137 days — a 12% lower offer ($30k) is reasonable based on typical stale-listing flexibility.
- Current owner paid $29k; 19% above their basis — modest negotiation headroom, anchor on the comps not their cost.
Risks & watch-outs
- Climate carrying-cost: severe wind risk, 80% chance of damaging wind over 30y; moderate wildfire risk; extreme-heat days projected 7→16/yr by 2055 (HVAC capex compounding) — expect insurance premiums to compound above CPI over the hold.
Questions for the listing agent
- It's been on market 137 days. Have you received any prior offers? Is the seller open to a 12% concession, seller financing, or rate buy-down credit?
- Built in 1963 — when were the roof, HVAC, electrical panel, plumbing, and water heater last replaced?
- Why hasn't it sold? Are there any deal-killer items the seller is aware of (foundation, flood, title, zoning, code violations)?
- Is there a deadline driving the sale (1031 exchange, divorce, estate, relocation)? That informs how much negotiation room exists.
- Crime grade is F in this area — have there been break-ins, vandalism, or insurance claims at this property in the last 3 years? What carrier currently insures it and at what premium?
- The area grade is low — what's the realistic commute time and amenity access for the typical tenant pool here? Any planned neighborhood developments (good or bad) we should know about?
- What's the average days-on-market for RENTAL listings here right now (not sales)? A rising rental-DOM trend means longer vacancies and softer asking-rent achievability than the comps imply.
- What's the recent tenant-quality profile in this submarket — average credit score on applications, eviction rate, late-payment / NSF rate, and stable-employment percentage? A property-management company in the area should have these aggregated.
- How much new for-sale + rental construction is in the pipeline within 1–3 miles? Heavy new supply typically softens prices + rents 12–24 months out; constrained supply supports both.
Investment metrics
- 1% rule
- 4.22% ✓
- Cap rate
- 38.94%
- Cash-on-cash
- 116.58%
- DSCR
- 6.19
- GRM
- 2.0
CMA / ARV
No comps found within radius.
Projected returns pro-forma
-3.0% appreciation · 3.0% rent growth · sell at horizon
- IRR
- —
- Equity multiple
- 6.61×
- Total profit
- $53,245
- Equity at exit
- $5,055
- IRR
- —
- Equity multiple
- 13.85×
- Total profit
- $122,013
- Equity at exit
- $2,931
Cash invested: $9,492 (down + closing). Projections, not guarantees.
Landlord ↔ Tenant lean methodology
- Overall (STATE)
- 90 Strongly Landlord-Friendly
- State South Carolina
- 90 Strongly Landlord-Friendly · R+6
- County
- — inherits STATE
- City
- — inherits STATE
ZIP-level market 29550
- Home prices YoY
- -22.3%
- Active inventory
- 155
- Price-to-rent
- 2.0×
Monthly cashflow live
- Estimated rent
- $1,429 medium interval (Pro) →
- Mortgage (P&I)
- −$178
- Tax from tax record
- −$15 /mo · $180/yr
- Insurance
- −$14
- HOA
- −$0
- Lot rent
- −$0
- Vacancy / Maint / Mgmt
- −$300
- Net cashflow
- $922
Break-even live
Sensitivity live
| Price | -10% $941 | -5% $932 | +0% $922 | +5% $913 | +10% $903 |
|---|---|---|---|---|---|
| Rent | -10% $809 | -5% $866 | +0% $922 | +5% $979 | +10% $1,035 |
| Rate | -1.0pp $939 | -0.5pp $931 | base $922 | +0.5pp $913 | +1.0pp $904 |
UW: 25.0% down · 7.5% · 30yr · 1.5% tax · 5.0% vac · 8.0% maint · 8.0% mgmt
Financing live
Cash to close
- Down payment
- $8,475
- Closing costs
- $1,017
- Reserves months
- —
- Total cash needed
- —
Loan-product check · same deal, 3 products live
Conventional
25% down · 7.5% · 30yr
- Down + closing
- —
- Monthly P&I
- —
- Monthly cashflow
- —
- DSCR
- —
- Eligible?
- —
Personal DTI + credit; lowest rate.
DSCR
20% down · 8.5% · 30yr
- Down + closing
- —
- Monthly P&I
- —
- Monthly cashflow
- —
- DSCR
- —
- Eligible?
- —
No personal income docs; deal must DSCR.
Hard money
10% down · 12.0% · 12mo
- Down + closing
- —
- Monthly P&I
- —
- Monthly cashflow
- —
- DSCR
- —
- Eligible?
- —
Short-term bridge; refi at stabilization.
Listing history 23 events
-
2026-06-22days on market $33,900 Active 137 DOM
-
2026-06-19days on market $33,900 Active 135 DOM
-
2026-06-18days on market $33,900 Active 134 DOM
-
2026-06-17days on market $33,900 Active 133 DOM
-
2026-06-16days on market $33,900 Active 132 DOM
-
2026-06-15days on market $33,900 Active 131 DOM
-
2026-06-14days on market $33,900 Active 129 DOM
-
2026-06-13days on market $33,900 Active 128 DOM
-
2026-06-10days on market $33,900 Active 126 DOM
-
2026-06-09days on market $33,900 Active 125 DOM
-
2026-06-08days on market $33,900 Active 124 DOM
-
2026-06-07days on market $33,900 Active 123 DOM
-
2026-06-05days on market $33,900 Active 120 DOM
-
2026-06-03days on market $33,900 Active 119 DOM
-
2026-06-02days on market $33,900 Active 118 DOM
-
2026-06-01days on market $33,900 Active 117 DOM
-
2026-05-31days on market $33,900 Active 116 DOM
-
2026-05-30days on market $33,900 Active 115 DOM
-
2026-05-21price $33,900
-
2026-04-13price $37,500
-
2026-03-06price $39,900
-
2026-02-03$49,900 Active
-
2000-12-12soldstatus $28,530
ⓘ Source: listings_history table (triggers on properties + properties_extension) + one-shot
backfill from property_details.listing_events for pre-trigger history.
Tax reassessment forecast SC · Resets to sale price
- Current annual tax
- $180 · $15/mo
- Projected year-2 tax
- $193 · $16/mo
- Expected delta
- +$13/yr (+$1/mo · 7.3%)
ⓘ Screening estimate from a state-policy table — verify with the county assessor before closing.
Climate risk First Street
- Flood 1/10 Low FEMA zone X (unshaded) · 0% chance over 30 yrs
- Wildfire 5/10 Major
- Heat 7/10 Severe 7 d/yr ≥108°F today · 16 d/yr by 30 yrs out
- Wind 8/10 Severe 80% chance of damaging wind over 30 yrs
- Air quality 2/10 Low 0 unhealthy d/yr today · 1 by 30 yrs out
Nearby sold comps map
Loading sold comps map…
Walkable amenities ~0.75 mi
Loading nearby amenities…
Taxation est. · year 1
- Rental income
- $17,151
- − Mortgage interest
- −$1,899
- − Property taxes
- −$180
- − Insurance
- −$170
- − Repairs & maintenance
- −$1,372
- − Management
- −$1,372
- − Depreciation
- −$986
- Taxable income
- $11,172
- Est. tax owed @ 24.0%
- −$2,681
- After-tax cash flow
- $8,385/yr
For passive investors: Depreciation is non-cash, so a rental often shows a tax loss while cash-flowing — sheltering income. Rental losses are passive: they offset passive income freely, and up to $25,000/yr can offset ordinary (W-2) income if you actively participate and your MAGI is under $100k (phasing out to $0 by $150k); unused losses carry forward. On sale, claimed depreciation is recaptured at up to 25%, and gains may owe capital-gains tax (a 1031 exchange can defer both). Figures are a year-1 estimate at your 24.0% rate — not tax advice; consult a CPA.
Schools (NCES district)
- District
- Darlington 01
- NCES district ID
- 4501860
- Math proficiency
- 27% ▼ -13.00%
- Reading proficiency
- 37% ▼ -1.00%
- Median HH income
- $36,243
- Composite
- 26.51/100
- National rank
- #7202
- State rank
- #52 of 80 in SC
Livability — Hartsville
- Score
- 60/100
- State rank
- #224
- US rank
- #18685
Category grades
Schools grade is shown separately in the Schools card above.
Census & demographics
- City population
- 30,198
- Population (ZIP)
- 30,198
Population outlook (Darlington County) Hauer SSP2
- Today (2025)
- 64,981 people
- By 2030
- 62,846 · -3.3%
- By 2040
- 58,146 · -10.5%
- By 2050
- 53,541 · -17.6%
- By 2075
- 43,477 · -33.1%
- By 2100
- 34,013 · -47.7%
Race, ethnicity, and origin ACS 2023
- Neighborhood character
- Majority White (63%)
- Race & ethnicity
- White 63% Black 31% Two or more races 3% Hispanic / Latino 3%
- Common ancestry
- Slovak 3% Serbian 3% Romanian 1%
- Foreign-born
- 3% · Canada
- Languages at home
- 96% English-only · Spanish 3%
Political lean MEDSL · Darlington
- 2024 margin
- R (+13.3) · D 42.8% · R 56.1% · Other 1.1%
- 2008→2024 swing
- -13.2pp toward R · 2008: -0.1pp · 2024: -13.3pp
- All cycles
- 2024: R+13.3 2020: R+5.0 2016: R+3.7 2012: D+3.4 2008: R+0.1
Not yet ingested
- Civics
- —
Market trends
- HPI YoY
- ▼ -63.03%
- Current HPI
- 219.996
- Rent YoY
- —
- Metro
- —
- State GDP YoY
- ▲ 4.51%
- F500 in state
- 2
Industry mix (Fortune 500 HQ in SC)
| Industry | F500 HQs | Revenue |
|---|---|---|
| Packaging | 1 | $7B |
|
||
Price history
+18.8% since first listed5 events — show timeline
- 2026-05-21 Price Changed $33,900 RAGPD
- 2026-04-13 Price Changed $37,500 RAGPD
- 2026-03-06 Price Changed $39,900 RAGPD
- 2026-02-03 Listed $49,900 RAGPD
- 2000-12-12 Sold (Public Records) $28,530 Public Records
Property tax history
-4.3%/yrLatest (2025): $180 · +7.0% YoY. Source: county tax records.
Cash-flow waterfall
monthlySold comps — $/sqft
last 12 mo · ≤1 miLoading sold comps…