5503 River Rd · Hope Mills, NC
Flood risk 1/10 · Minimal
- FEMA flood zone
- X (unshaded)
- Chance of flooding over 30 yrs
- 0.0%
- Est. flood insurance / yr
- $507 – $1,088
Fire risk 5/10 · Moderate
- Est. fire insurance / yr
- $906 – $1,684
Heat risk 7/10 · Major
- Hot days now (above 106°F)
- 7 days/yr
- Hot days in 30 yrs
- 16 days/yr
Wind risk 7/10 · Major
- Chance of severe wind over 30 yrs
- 78.0%
Air-quality risk 1/10 · Minimal
- Unhealthy air days now
- 0 days/yr
- Unhealthy air days in 30 yrs
- 0 days/yr
Risk factors via First Street. Map © Google.
Why this score? — see what drove the B- grade
The composite is a weighted blend of 9 inputs, each scored 0–100. Each bar is that input's sub-score; the figure is the points it added to the 100-point composite (weight × sub-score).
- Cash flow +30.0/30.0
- DSCR +10.0/10.0
- 1% rule +9.3/10.0
- ARV discount +7.5/15.0
- Rent growth +3.6/5.0
- Livability +3.4/5.0
- Schools +3.1/10.0
- Condition / age +2.5/5.0
- Appreciation +0.0/10.0
$98,000
🖨 Deal sheet 📄 Offer letter ✓ Due diligence
Listing remarks
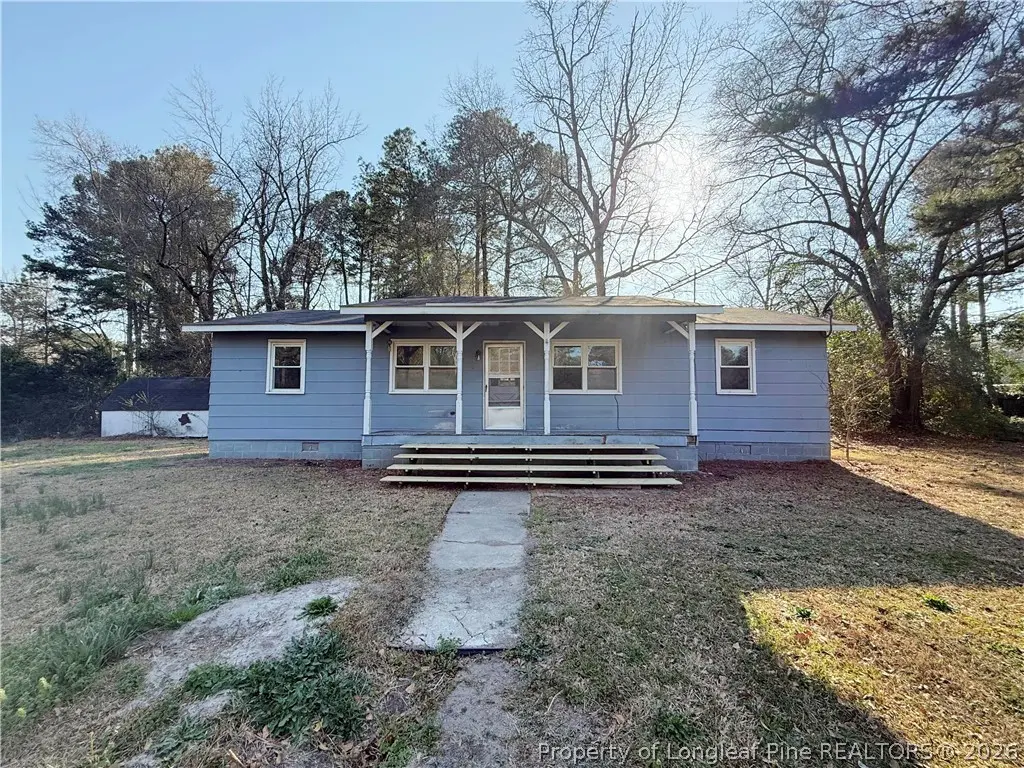
This three-bedroom, two-bathroom home presents an excellent investment opportunity with strong renovation potential. The property features a covered front porch and sits in a convenient location just minutes from Hope Mills Municipal Park and close to Hope Mills Lake, offering future residents access to recreational activities and natural beauty.
Key facts
- Covered front porch
- Natural beauty
- Built 1976
Tags
Property features AI
Exterior
- Parking: No garage
- Utilities: Public water; Public sewer
- Home design: Single-family residence; One-level home; 1 story
- Construction: Frame construction
- Exterior features: Located in the HOPE MILLS subdivision; Zoned R10 - Residential District
Interior
- Bedrooms: Total of 5 rooms (bedrooms not individually specified)
- Flooring: Other flooring
- Bathrooms: 2 full bathrooms
- Heating & cooling: Electric heating; Has heating
- Interior features: Crawl space basement; No fireplace; Other flooring
Neighborhood map
What this means for you Summary
Snapshot
- This is a 3-bed/2.0-bath manufactured listed at $98k.
Deal economics
- At list price, monthly cash flow is $482 ($6k/yr) — positive.
- The deal already cash-flows at list — no discount required.
- Meets the 1% rule at list price ($1k rent vs $98k).
- Recommended offer: $95k (3.0% below list) — sets the bar for market timing.
- Cap rate 12.2% vs local median 4.8% in Hope Mills — top-decile yield for the area; either an underpriced asset or a hidden risk that comps aren't pricing in. Stress-test before assuming the spread holds.
Location & tenants
- Location reads 67/100 on livability (#234 in NC) — a middle-class / working-renter tenant base. Strengths: cost of living A+, housing A+, health & safety B+; Watch: crime D-, amenities F, commute F.
- Cumberland County Schools (urban): math 32% / reading 41% proficiency, ranked #126 of 178 in NC (top 71%) — families likely to look elsewhere, expect single-tenant / working-renter base with shorter leases.
- Zoned schools: Hope Mills Middle (math 27% / reading 34%, grade F, #331 of 475 statewide, top 70%, 514 students, 99% FRL); South View High (math 60% / reading 43%, grade D+, #299 of 535 statewide, top 56%, 1,502 students, 66% FRL) — zoned schools average 83% FRL vs 55% district-wide (28 pts higher); higher-poverty schools than district average — tighter screening recommended.
- Market conditions: Rents rising fast (+4.3%/yr); 317 active listings in the ZIP; 13 comparable units currently listed for rent nearby; rentals at typical pace (median 21d on market — plan ~3-4 weeks tenant-placement turnaround); 1,125 units permitted in Cumberland County in 2024 (104 in 5+ unit buildings).
Forward outlook
- Local home prices are declining (-3.0%/yr); year-one equity from $678 of loan paydown is wiped out by about $3k of value loss. Plan a longer hold.
- At projected returns (-3.0% appreciation + 4.3% rent growth), your $27k cash investment doubles in ~6 years — after that, you're playing with house money.
Negotiation context
- It's been on market 38 days — a 3% lower offer ($95k) is reasonable based on typical stale-listing flexibility.
Risks & watch-outs
- Climate carrying-cost: major wind risk, 78% chance of damaging wind over 30y; moderate wildfire risk; extreme-heat days projected 7→16/yr by 2055 (HVAC capex compounding) — expect insurance premiums to compound above CPI over the hold.
Questions for the listing agent
- It's been on market 38 days. Have you received any prior offers? Is the seller open to a 3% concession, seller financing, or rate buy-down credit?
- Built in 1976 — when were the roof, HVAC, electrical panel, plumbing, and water heater last replaced?
- Is there a deadline driving the sale (1031 exchange, divorce, estate, relocation)? That informs how much negotiation room exists.
- Schools are D-rated, which usually means shorter tenancies and higher turnover. Who's the typical renter profile here, and what's been the actual vacancy rate?
- Crime grade is D in this area — have there been break-ins, vandalism, or insurance claims at this property in the last 3 years? What carrier currently insures it and at what premium?
- What's the average days-on-market for RENTAL listings here right now (not sales)? A rising rental-DOM trend means longer vacancies and softer asking-rent achievability than the comps imply.
- What's the recent tenant-quality profile in this submarket — average credit score on applications, eviction rate, late-payment / NSF rate, and stable-employment percentage? A property-management company in the area should have these aggregated.
- How much new for-sale + rental construction is in the pipeline within 1–3 miles? Heavy new supply typically softens prices + rents 12–24 months out; constrained supply supports both.
Investment metrics
- 1% rule
- 1.43% ✓
- Cap rate
- 12.20%
- Cash-on-cash
- 21.10%
- DSCR
- 1.94
- GRM
- 5.8
CMA / ARV
No comps found within radius.
Projected returns pro-forma
-3.0% appreciation · 4.28% rent growth · sell at horizon
- IRR
- 14.9%
- Equity multiple
- 1.61×
- Total profit
- $16,657
- Equity at exit
- $14,612
- IRR
- 24.5%
- Equity multiple
- 3.25×
- Total profit
- $61,699
- Equity at exit
- $8,473
Cash invested: $27,440 (down + closing). Projections, not guarantees.
Landlord ↔ Tenant lean methodology
- Overall (STATE)
- 85 Strongly Landlord-Friendly
- State North Carolina
- 85 Strongly Landlord-Friendly · R+3
- County
- — inherits STATE
- City
- — inherits STATE
ZIP-level market 28348
- Home prices YoY
- -14.0%
- Rents YoY
- 4.3%
- Active inventory
- 317
- Price-to-rent
- 5.8×
Monthly cashflow live
- Estimated rent
- $1,398 high interval (Pro) →
- Mortgage (P&I)
- −$514
- Tax from tax record
- −$68 /mo · $810/yr
- Insurance
- −$41
- HOA
- −$0
- Vacancy / Maint / Mgmt
- −$294
- Net cashflow
- $482
Break-even live
UW: 25.0% down · 7.5% · 30yr · 1.5% tax · 5.0% vac · 8.0% maint · 8.0% mgmt
Financing live
Cash to close
- Down payment
- $24,500
- Closing costs
- $2,940
- Reserves months
- —
- Total cash needed
- —
Loan-product check · same deal, 3 products live
Conventional
25% down · 7.5% · 30yr
- Down + closing
- —
- Monthly P&I
- —
- Monthly cashflow
- —
- DSCR
- —
- Eligible?
- —
Personal DTI + credit; lowest rate.
DSCR
20% down · 8.5% · 30yr
- Down + closing
- —
- Monthly P&I
- —
- Monthly cashflow
- —
- DSCR
- —
- Eligible?
- —
No personal income docs; deal must DSCR.
Hard money
10% down · 12.0% · 12mo
- Down + closing
- —
- Monthly P&I
- —
- Monthly cashflow
- —
- DSCR
- —
- Eligible?
- —
Short-term bridge; refi at stabilization.
Rent comps 13 comps
| Address | Beds | Baths | Sqft | Rent | $/sqft | DOM | Units | Dist |
|---|---|---|---|---|---|---|---|---|
| 4033 Professional Dr Unit 4033 Hope Mills, NC | 2.0 | 2.0 | 1050 | $1,095 | $1.04 | 23d | 1 | 0.22mi |
| 4079 Professional Dr Hope Mills, NC | 2.0 | 2.0 | 1050 | $1,095 | $1.04 | 23d | 1 | 0.26mi |
| 4065 Professional Dr Unit 4065 Hope Mills, NC | 2.0 | 2.0 | 1050 | $1,095 | $1.04 | 23d | 1 | 0.28mi |
| 4065 Professional Dr Hope Mills, NC | 2.0 | 2.0 | 1050 | $1,095 | $1.04 | 21d | 1 | 0.28mi |
| 3916 Middle St Hope Mills, NC | 2.0 | 1.0 | 905 | $1,115 | $1.23 | 13d | 1 | 0.33mi |
| 3717 Damien Dr Hope Mills, NC | 2.0 | 2.0 | 975 | $1,280 | $1.31 | 13d | 3 | 0.34mi |
| 5715 Walkabout Rd Hope Mills, NC | 3.0 | 2.0 | 1143 | $1,675 | $1.47 | 23d | 1 | 0.54mi |
| 5693A Archer Rd Hope Mills, NC | 2.0 | 1.5 | 874 | $1,100 | $1.26 | 13d | 1 | 0.60mi |
| 3332 Kenmont Ln Unit E Hope Mills, NC | 2.0 | 2.5 | 1100 | $1,150 | $1.05 | 23d | 1 | 0.83mi |
| 509 Meadowland Ct Hope Mills, NC | 2.0 | 2.0 | 1236 | $1,400 | $1.13 | 23d | 1 | 1.28mi |
| 1514 Aristo Pl Hope Mills, NC | 2.0 | 2.0 | 1000 | $1,050 | $1.05 | 13d | 1 | 1.32mi |
| 1055 Winnall LN Hope Mills, NC | 1.0–3.0 | 1.0–2.0 | 1132 | $2,000 | $1.77 | 13d | 20 | 1.36mi |
| 3636 Metric Dr Hope Mills, NC | 3.0 | 1.5 | 1100 | $1,400 | $1.27 | 13d | 1 | 1.40mi |
Listing history 16 events
-
2026-06-18days on market $98,000 Active 38 DOM
-
2026-06-17days on market $98,000 Active 37 DOM
-
2026-06-16days on market $98,000 Active 36 DOM
-
2026-06-15days on market $98,000 Active 35 DOM
-
2026-06-14pricedays on market $98,000 Active 33 DOM
-
2026-06-13days on market $100,000 Active 32 DOM
-
2026-06-10days on market $100,000 Active 30 DOM
-
2026-06-09days on market $100,000 Active 29 DOM
-
2026-06-08days on market $100,000 Active 28 DOM
-
2026-06-07days on market $100,000 Active 27 DOM
-
2026-06-03days on market $100,000 Active 23 DOM
-
2026-06-02days on market $100,000 Active 22 DOM
-
2026-06-01days on market $100,000 Active 21 DOM
-
2026-05-31days on market $100,000 Active 20 DOM
-
2026-05-30days on market $100,000 Active 19 DOM
-
2026-05-09$100,000 Active
ⓘ Source: listings_history table (triggers on properties + properties_extension) + one-shot
backfill from property_details.listing_events for pre-trigger history.
Tax reassessment forecast NC · Resets to sale price
- Current annual tax
- $810 · $68/mo
- Projected year-2 tax
- $810 · $68/mo
- Expected delta
- $0/yr ($0/mo · 0.0%)
ⓘ Screening estimate from a state-policy table — verify with the county assessor before closing.
Climate risk First Street
- Flood 1/10 Low FEMA zone X (unshaded) · 0% chance over 30 yrs
- Wildfire 5/10 Major
- Heat 7/10 Severe 7 d/yr ≥106°F today · 16 d/yr by 30 yrs out
- Wind 7/10 Severe 78% chance of damaging wind over 30 yrs
- Air quality 1/10 Low 0 unhealthy d/yr today · 0 by 30 yrs out
Nearby sold comps map
Loading sold comps map…
Walkable amenities ~0.75 mi
Loading nearby amenities…
Taxation est. · year 1
- Rental income
- $16,780
- − Mortgage interest
- −$5,490
- − Property taxes
- −$810
- − Insurance
- −$490
- − Repairs & maintenance
- −$1,342
- − Management
- −$1,342
- − Depreciation
- −$2,851
- Taxable income
- $4,455
- Est. tax owed @ 24.0%
- −$1,069
- After-tax cash flow
- $4,720/yr
For passive investors: Depreciation is non-cash, so a rental often shows a tax loss while cash-flowing — sheltering income. Rental losses are passive: they offset passive income freely, and up to $25,000/yr can offset ordinary (W-2) income if you actively participate and your MAGI is under $100k (phasing out to $0 by $150k); unused losses carry forward. On sale, claimed depreciation is recaptured at up to 25%, and gains may owe capital-gains tax (a 1031 exchange can defer both). Figures are a year-1 estimate at your 24.0% rate — not tax advice; consult a CPA.
Schools (NCES district)
- District
- Cumberland County Schools
- NCES district ID
- 3700011
- Math proficiency
- 32% ▼ -2.00%
- Reading proficiency
- 41% ▼ -1.00%
- Median HH income
- $44,168
- Composite
- 31.0/100
- National rank
- #6096
- State rank
- #126 of 178 in NC
Livability — Hope Mills
- Score
- 67/100
- State rank
- #234
- US rank
- #10761
Category grades
Schools grade is shown separately in the Schools card above.
Census & demographics
- Census place
- Hope Mills, NC
- County
- Cumberland County · 265,314 people
- City population
- 39,196
- Metro
- Fayetteville, NC
- Population (ZIP)
- 39,196
- Household income
- $66,129
- Rent vs Own
- Severe rent burden
- 746.0
Population outlook (Cumberland County) Hauer SSP2
- Today (2025)
- 330,855 people
- By 2030
- 333,523 · +0.8%
- By 2040
- 335,583 · +1.4%
- By 2050
- 335,325 · +1.4%
- By 2075
- 342,853 · +3.6%
- By 2100
- 340,698 · +3.0%
Race, ethnicity, and origin ACS 2023
- Neighborhood character
- Diverse neighborhood (Simpson 0.67)
- Race & ethnicity
- White 49% Black 27% Hispanic / Latino 13% Two or more races 11% Asian 2% Native American 2%
- Hispanic origin (detail)
- Mexican 4% Puerto Rican 5%
- Common ancestry
- Romanian 2% Lithuanian 1% Serbian 1%
- Foreign-born
- 5% · Canada, South Korea, Vietnam
- Languages at home
- 90% English-only · Spanish 8% Other Indo-European 1%
Political lean MEDSL · Cumberland
- 2024 margin
- D (+13.4) · D 56.1% · R 42.7% · Other 1.2%
- 2008→2024 swing
- -4.3pp toward R · 2008: 17.7pp · 2024: 13.4pp
- All cycles
- 2024: D+13.4 2020: D+16.6 2016: D+16.0 2012: D+19.7 2008: D+17.7
Not yet ingested
- Civics
- —
Market trends
- HPI YoY
- ▼ -37.14%
- Current HPI
- 228.3122
- Rent YoY
- ▲ 4.28%
- Metro
- Fayetteville, NC
- State GDP YoY
- ▲ 3.28%
- F500 in state
- 26
Industry mix (Fortune 500 HQ in NC)
| Industry | F500 HQs | Revenue |
|---|---|---|
| Financial Services | 2 | $213B |
|
||
| Retail | 2 | $95B |
|
||
| Industrial Conglomerate | 1 | $38B |
|
||
| Metals / Steel | 1 | $35B |
|
||
| Utilities | 1 | $30B |
|
||
| Industrial Machinery | 1 | $19B |
|
||
Price history
1 event — show timeline
- 2026-05-09 Listed $100,000 LPRMLS
Property tax history
+5.5%/yrLatest (2025): $810 · +38.4% YoY. Source: county tax records.
Cash-flow waterfall
monthlySold comps — $/sqft
last 12 mo · ≤1 miLoading sold comps…