31 SE 190th Ave · Fanning Springs, FL
Flood risk 3/10 · Minor
- FEMA flood zone
- AE
- Chance of flooding over 30 yrs
- 0.2%
- Est. flood insurance / yr
- $1,737 – $8,500
Fire risk 5/10 · Moderate
- Est. fire insurance / yr
- $947 – $1,759
Heat risk 8/10 · Major
- Hot days now (above 107°F)
- 7 days/yr
- Hot days in 30 yrs
- 22 days/yr
Wind risk 9/10 · Severe
- Chance of severe wind over 30 yrs
- 99.0%
Air-quality risk 2/10 · Minimal
- Unhealthy air days now
- 1 days/yr
- Unhealthy air days in 30 yrs
- 2 days/yr
Risk factors via First Street. Map © Google.
Why this score? — see what drove the B+ grade
The composite is a weighted blend of 9 inputs, each scored 0–100. Each bar is that input's sub-score; the figure is the points it added to the 100-point composite (weight × sub-score).
- Cash flow +30.0/30.0
- DSCR +10.0/10.0
- Appreciation +10.0/10.0
- 1% rule +7.5/10.0
- ARV discount +7.5/15.0
- Schools +4.2/10.0
- Livability +3.2/5.0
- Rent growth +2.5/5.0
- Condition / age +2.5/5.0
$115,000
🖨 Deal sheet (PDF) 📄 Offer letter ✓ Due diligence
Listing remarks
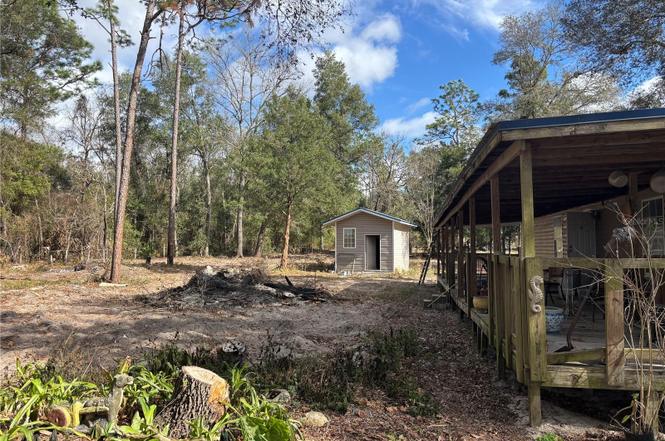
OVERSIZED FENCED CORNER LOT - This 1 acre gated lot offers all the open air natural beauty one could ever want with a 2 bed 2 bath 1200 sqft house, and 2 sheds included. Enjoy the best of both worlds - Serene country living with 25 miles distance to coastal pleasure. Horseshoe Beach is approximately 24 miles (30 minutes) away—one of Florida’s most peaceful Gulf towns, perfect for fishing, kayaking, and unforgettable sunset views over the Gulf of Mexico. This charming Old Town retreat is ideally located near North Florida’s most celebrated water destinations. Enjoy the area’s renowned rivers, springs, and coastal escapes right at your doorstep. Fanning Springs State P
Key facts
- Gated lot
- 1 acre lot
- Built 1984
Tags
Property features AI
Finance
- Other: Property type: Residential - Manufactured Home; Total living area approximately 1,012 sq ft (public records); Lot size approximately 1 acre; Zoning: A5; Direction faces: Southwest
- HOA & community: No HOA association indicated; Pets allowed
Exterior
- Parking: Open oversized parking
- Utilities: Well water; Septic tank; Electricity available; Private utilities; sewer connected
- Home design: Residential manufactured home (triple wide); One story; Southwest facing
- Construction: Metal siding, wood siding, and frame construction; Metal roof; Block foundation; Completed condition
- Exterior features: Cleared, oversized corner lot; Located in county (not city); Mature landscaping with trees and wooded areas; Public paved road access; Shed(s), storage, and workshop on site
Interior
- Kitchen: No appliances listed
- Bedrooms: 2 bedrooms
- Flooring: Vinyl flooring
- Bathrooms: 2 full bathrooms
- Heating & cooling: Central heating; Central air conditioning
- Interior features: High ceilings; Wood frame windows
- Laundry & utility: Dedicated laundry room
Neighborhood map
What this means for you Summary
Snapshot
- This is a 2-bed/2.0-bath manufactured listed at $115k.
Deal economics
- At list price, monthly cash flow is $35 ($419/yr) — positive.
- The deal already cash-flows at list — no discount required.
- Meets the 1% rule at list price ($1k rent vs $115k).
- Recommended offer: $101k (12.0% below list) — sets the bar for market timing.
- Cap rate 11.1% vs local median 3.7% in Fanning Springs — top-decile yield for the area; either an underpriced asset or a hidden risk that comps aren't pricing in. Stress-test before assuming the spread holds.
Location & tenants
- Location reads 63/100 on livability (#739 in FL) — a middle-class / working-renter tenant base. Strengths: crime A+, cost of living A+, housing A+; Watch: health & safety D, amenities F, commute F.
- Dixie (rural): math 52% / reading 50% proficiency, ranked #36 of 73 in FL (top 49%) — acceptable for families but not a draw, mixed tenant base, ~2y average lease; 85% free/reduced lunch — lower-income household profile, screen leases tightly.
- Zoned schools: Old Town Elementary School (math 73% / reading 58%, grade B+, #500 of 2,144 statewide, top 24%, 456 students, 80% FRL); Ruth Rains Middle School (math 48% / reading 49%, grade C-, #274 of 571 statewide, top 50%, 431 students, 76% FRL); Dixie County High School (math 31% / reading 42%, grade F, #351 of 667 statewide, top 54%, 714 students, 70% FRL).
- Market conditions: 262 active listings in the ZIP; 49 units permitted in Dixie County in 2024 (0 in 5+ unit buildings).
Forward outlook
- In year one you build about $12k of equity ($795 loan paydown + $12k appreciation (10.0% local appreciation)).
- Dixie County population projected at -16% by 2050 — secular population decline; favor cash flow + early exit over multi-decade hold.
- At projected returns (10.0% appreciation + 3.0% rent growth), your $32k cash investment doubles in ~3 years — after that, you're playing with house money.
- By year 3, paydown + projected appreciation supports a ~$31k cash-out refi (75% LTV) — recoverable capital for the next deal without selling this one.
Negotiation context
- It's been on market 163 days — a 12% lower offer ($101k) is reasonable based on typical stale-listing flexibility.
- Current owner paid $29k; list at $115k implies a 297% gain — meaningful room to come down on a strong offer.
Risks & watch-outs
- Watch-outs: flood insurance adds $427/mo.
- Climate carrying-cost: in FEMA flood zone AE (mandatory federal flood insurance); severe wind risk, 99% chance of damaging wind over 30y; moderate wildfire risk; extreme-heat days projected 7→22/yr by 2055 (HVAC capex compounding) — expect insurance premiums to compound above CPI over the hold.
Questions for the listing agent
- It's been on market 163 days. Have you received any prior offers? Is the seller open to a 12% concession, seller financing, or rate buy-down credit?
- What's the actual annual flood-insurance premium (NFIP or private), and is the property in a SFHA with mandatory coverage?
- Why hasn't it sold? Are there any deal-killer items the seller is aware of (foundation, flood, title, zoning, code violations)?
- Is there a deadline driving the sale (1031 exchange, divorce, estate, relocation)? That informs how much negotiation room exists.
- Schools are F-rated, which usually means shorter tenancies and higher turnover. Who's the typical renter profile here, and what's been the actual vacancy rate?
- What's the average days-on-market for RENTAL listings here right now (not sales)? A rising rental-DOM trend means longer vacancies and softer asking-rent achievability than the comps imply.
- What's the recent tenant-quality profile in this submarket — average credit score on applications, eviction rate, late-payment / NSF rate, and stable-employment percentage? A property-management company in the area should have these aggregated.
- How much new for-sale + rental construction is in the pipeline within 1–3 miles? Heavy new supply typically softens prices + rents 12–24 months out; constrained supply supports both.
Investment metrics
- 1% rule
- 1.25% ✓
- Cap rate
- 11.11%
- Cash-on-cash
- 17.20%
- DSCR
- 1.77
- GRM
- 6.7
CMA / ARV
- ARV (on-the-fly)
- $59,708
- Comps found
- 1
Show comp detail 1 sale within ~0.75 mi
| Address | Dist | Beds/Ba | Sqft | Sold | Price | $/sf | Match |
|---|---|---|---|---|---|---|---|
| 397 SE 902nd St | 0.68mi | 3/2.0 (+1) | 896 (-12%) | 5mo | $53,000 | $59 | 40 |
Match score weights: distance 35% · size 25% · config 20% · recency 20%. Top-matched comps best support the ARV.
Projected returns pro-forma
10.0% appreciation · 3.0% rent growth · sell at horizon
- IRR
- 25.3%
- Equity multiple
- 3.02×
- Total profit
- $65,067
- Equity at exit
- $103,601
- IRR
- 22.3%
- Equity multiple
- 6.91×
- Total profit
- $190,283
- Equity at exit
- $223,420
Cash invested: $32,200 (down + closing). Projections, not guarantees.
Landlord ↔ Tenant lean methodology
- Overall (STATE)
- 87 Strongly Landlord-Friendly
- State Florida
- 87 Strongly Landlord-Friendly · R+3
- County
- — inherits STATE
- City
- — inherits STATE
ZIP-level market 32680
- Home prices YoY
- 2.5%
- Active inventory
- 262
- Price-to-rent
- 6.7×
Monthly cashflow live
- Estimated rent
- $1,441 medium interval (Pro) →
- Mortgage (P&I)
- −$603
- Tax from tax record
- −$26 /mo · $310/yr
- Insurance
- −$48
- Flood insurance flood zone
- −$427 /mo · $5,118/yr
- HOA
- −$0
- Vacancy / Maint / Mgmt
- −$303
- Net cashflow
- $35
Break-even live
Sensitivity live
| Price | -10% $100 | -5% $67 | +0% $35 | +5% $2 | +10% $-30 |
|---|---|---|---|---|---|
| Rent | -10% $-79 | -5% $-22 | +0% $35 | +5% $92 | +10% $149 |
| Rate | -1.0pp $93 | -0.5pp $64 | base $35 | +0.5pp $5 | +1.0pp $-25 |
UW: 25.0% down · 7.5% · 30yr · 1.5% tax · 5.0% vac · 8.0% maint · 8.0% mgmt
Financing live
Cash to close
- Down payment
- $28,750
- Closing costs
- $3,450
- Reserves months
- —
- Total cash needed
- —
Loan-product check · same deal, 3 products live
Conventional
25% down · 7.5% · 30yr
- Down + closing
- —
- Monthly P&I
- —
- Monthly cashflow
- —
- DSCR
- —
- Eligible?
- —
Personal DTI + credit; lowest rate.
DSCR
20% down · 8.5% · 30yr
- Down + closing
- —
- Monthly P&I
- —
- Monthly cashflow
- —
- DSCR
- —
- Eligible?
- —
No personal income docs; deal must DSCR.
Hard money
10% down · 12.0% · 12mo
- Down + closing
- —
- Monthly P&I
- —
- Monthly cashflow
- —
- DSCR
- —
- Eligible?
- —
Short-term bridge; refi at stabilization.
Listing history 19 events
-
2026-06-21days on market $115,000 Active 163 DOM
-
2026-06-21days on market $115,000 Active 162 DOM
-
2026-06-18days on market $115,000 Active 160 DOM
-
2026-06-17days on market $115,000 Active 159 DOM
-
2026-06-16days on market $115,000 Active 158 DOM
-
2026-06-15days on market $115,000 Active 157 DOM
-
2026-06-13days on market $115,000 Active 155 DOM
-
2026-06-12days on market $115,000 Active 154 DOM
-
2026-06-09days on market $115,000 Active 151 DOM
-
2026-06-08days on market $115,000 Active 150 DOM
-
2026-06-07days on market $115,000 Active 149 DOM
-
2026-06-07days on market $115,000 Active 148 DOM
-
2026-06-04days on market $115,000 Active 145 DOM
-
2026-06-02days on market $115,000 Active 144 DOM
-
2026-06-01days on market $115,000 Active 143 DOM
-
2026-05-31days on market $115,000 Active 142 DOM
-
2026-05-31days on market $115,000 Active 141 DOM
-
2026-01-09$115,000 Active
-
2006-05-10soldstatus $29,000
ⓘ Source: listings_history table (triggers on properties + properties_extension) + one-shot
backfill from property_details.listing_events for pre-trigger history.
Tax reassessment forecast FL · Resets to sale price
- Current annual tax
- $310 · $26/mo
- Projected year-2 tax
- $954 · $80/mo
- Expected delta
- +$644/yr (+$54/mo · 207.9%)
ⓘ Screening estimate from a state-policy table — verify with the county assessor before closing.
Climate risk First Street
- Flood 3/10 Moderate FEMA zone AE · 20% chance over 30 yrs
- Wildfire 5/10 Major
- Heat 8/10 Severe 7 d/yr ≥107°F today · 22 d/yr by 30 yrs out
- Wind 9/10 Extreme 99% chance of damaging wind over 30 yrs
- Air quality 2/10 Low 1 unhealthy d/yr today · 2 by 30 yrs out
Nearby sold comps map
Loading sold comps map…
Walkable amenities ~0.75 mi
Loading nearby amenities…
Taxation est. · year 1
- Rental income
- $17,290
- − Mortgage interest
- −$6,442
- − Property taxes
- −$310
- − Insurance
- −$5,694
- − Repairs & maintenance
- −$1,383
- − Management
- −$1,383
- − Depreciation
- −$3,345
- Taxable loss
- −$1,267
- Est. tax savings @ 24.0%
- +$304
- After-tax cash flow
- $723/yr
For passive investors: Depreciation is non-cash, so a rental often shows a tax loss while cash-flowing — sheltering income. Rental losses are passive: they offset passive income freely, and up to $25,000/yr can offset ordinary (W-2) income if you actively participate and your MAGI is under $100k (phasing out to $0 by $150k); unused losses carry forward. On sale, claimed depreciation is recaptured at up to 25%, and gains may owe capital-gains tax (a 1031 exchange can defer both). Figures are a year-1 estimate at your 24.0% rate — not tax advice; consult a CPA.
Schools (NCES district)
- District
- Dixie
- NCES district ID
- 1200450
- Math proficiency
- 52% ▼ -3.00%
- Reading proficiency
- 50% ▼ -4.00%
- Median HH income
- $34,799
- Composite
- 42.18/100
- National rank
- #3290
- State rank
- #36 of 73 in FL
Livability — Fanning Springs
- Score
- 63/100
- State rank
- #739
- US rank
- #15960
Category grades
Schools grade is shown separately in the Schools card above.
Census & demographics
- Population (ZIP)
- 10,445
Population outlook (Dixie County) Hauer SSP2
- Today (2025)
- 15,122 people
- By 2030
- 14,521 · -4.0%
- By 2040
- 13,503 · -10.7%
- By 2050
- 12,671 · -16.2%
- By 2075
- 10,857 · -28.2%
- By 2100
- 8,344 · -44.8%
Race, ethnicity, and origin ACS 2023
- Neighborhood character
- Predominantly White (94%)
- Race & ethnicity
- White 94% Two or more races 4% Hispanic / Latino 3% Black 1%
- Common ancestry
- Romanian 2% Slovak 1% Italian 1%
- Foreign-born
- 3% · Canada
- Languages at home
- 99% English-only · Spanish 1%
Political lean MEDSL · Dixie
- 2024 margin
- Solid R (+70.4) · D 14.5% · R 84.9%
- 2008→2024 swing
- -25.4pp toward R · 2008: -45.0pp · 2024: -70.4pp
- All cycles
- 2024: R+70.4 2020: R+66.0 2016: R+63.2 2012: R+46.9 2008: R+45.0
Not yet ingested
- Civics
- —
Market trends
- HPI YoY
- ▲ 10.22%
- Current HPI
- 424.0037
- Rent YoY
- —
- Metro
- —
- State GDP YoY
- ▲ 3.28%
- F500 in state
- 36
Industry mix (Fortune 500 HQ in FL)
| Industry | F500 HQs | Revenue |
|---|---|---|
| Industrial Technology | 2 | $29B |
|
||
| Insurance | 2 | $17B |
|
||
| Retail | 1 | $60B |
|
||
| Technology Distribution | 1 | $58B |
|
||
| Homebuilding | 1 | $35B |
|
||
| Technology Manufacturing | 1 | $35B |
|
||
Price history
+296.6% since first listed2 events — show timeline
- 2026-01-09 Listed $115,000 Stellar MLS as Distributed by MLS Grid
- 2006-05-10 Sold (Public Records) $29,000 Public Records
Property tax history
+6.2%/yrLatest (2025): $310 · +0.0% YoY. Source: county tax records.
Cash-flow waterfall
monthlySold comps — $/sqft
last 12 mo · ≤1 miLoading sold comps…