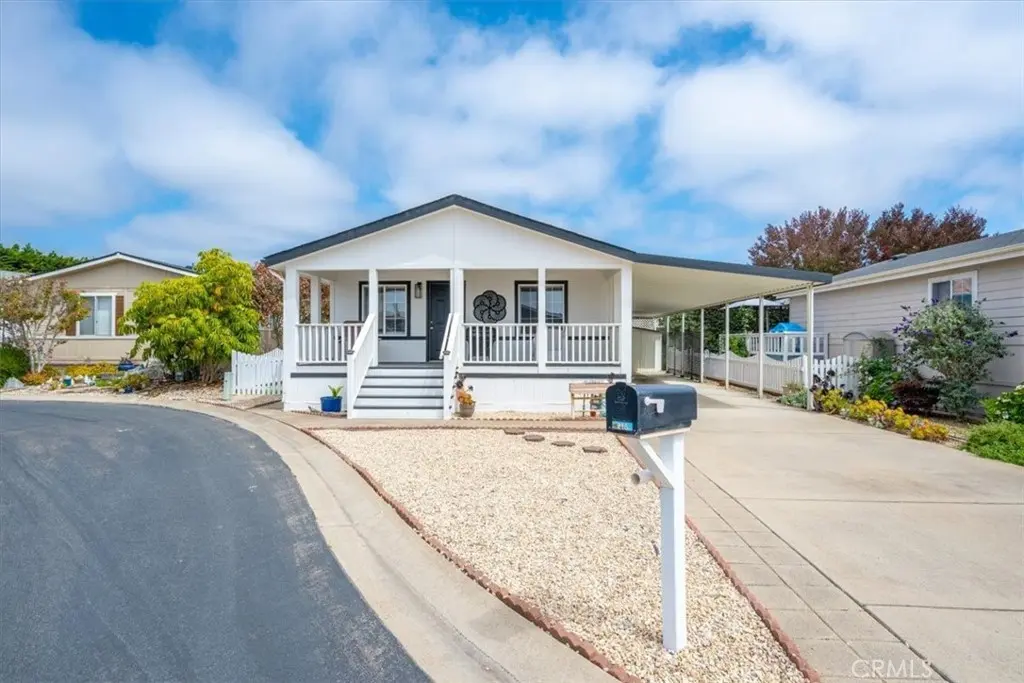
765 Mesa View Dr #216 · Callender, CA
Flood risk 1/10 · Minimal
- FEMA flood zone
- X (unshaded)
- Chance of flooding over 30 yrs
- 0.0%
- Est. flood insurance / yr
- $507 – $1,088
Fire risk 6/10 · Moderate
- Est. fire insurance / yr
- $659 – $1,223
Heat risk 4/10 · Minor
- Hot days now (above 79°F)
- 5 days/yr
- Hot days in 30 yrs
- 10 days/yr
Wind risk 1/10 · Minimal
- Chance of severe wind over 30 yrs
- —
Air-quality risk 6/10 · Moderate
- Unhealthy air days now
- 9 days/yr
- Unhealthy air days in 30 yrs
- 10 days/yr
Risk factors via First Street. Map © Google.
Why this score? — see what drove the B- grade
The composite is a weighted blend of 9 inputs, each scored 0–100. Each bar is that input's sub-score; the figure is the points it added to the 100-point composite (weight × sub-score).
- Cash flow +29.4/30.0
- ARV discount +10.5/15.0
- DSCR +10.0/10.0
- 1% rule +7.1/10.0
- Schools +4.5/10.0
- Livability +2.6/5.0
- Rent growth +2.5/5.0
- Condition / age +2.5/5.0
- Appreciation +0.0/10.0
$235,000
🖨 Deal sheet 📄 Offer letter ✓ Due diligence
Listing remarks MLS
Don't Wait! Start Enjoying Central Coast Living in This Beautiful, Well Maintained Home. It's Rare to Find A Home Like This One with a Cul-de-sac Location. It Sits On One of the Largest Fenced Lots in the Premier Mesa Dunes Mobile Home Estates. Home is Bright and Cheery with a Spacious, Open Floor Plan, Vaulted Ceilings, and a Den/Office that could be a Third Bedroom with it's Own Entrance. Features a Large Primary Bedroom with Soaking Tub, Dual Vanities, Separate Shower and Indoor Laundry Room. Living Room opens to Dining Room and Kitchen with Breakfast Bar. Outdoor Space is Great with a Low Maintenance Rock Yard which includes Fruit Trees in a Raised Flowerbed w/ Irrigation and a Garden Shed. Mesa Dunes Offers Ocean Views, Parks, 2 Clubhouses, 2 Pools, Spa, and Fitness Trails. Buyers Must Apply for Park Approval. New Lease Approximately $1230 to Be Verified with Park Management.
Key facts
- Cul-de-sac location
- Largest fenced lots
- Open floor plan
Tags
Property features AI
Finance
- Other: Directions: Highway 1 to 1/2 mile south of Halcyon; turn left into Mesa Dunes, right on Mesa Grande, left on Taos St., then left on Santa Fe; Paved road access via highway
- Financial info: Land lease of $1,236 monthly (park)
- HOA & community: Part of an association; Park name: Mesa Dunes Mobile Home Estates; Community features include gutters, curbs, street lighting, and a park; Manager approval required; Pets allowed (dogs and cats OK; breed restrictions and number limits apply)
Exterior
- Parking: Five parking spaces total; Three uncovered spaces; Two carport spaces (attached, oversized, side-by-side); Concrete driveway
- Security: Smoke detector
- Utilities: Shared well water; Community septic; Natural gas connected; Electricity connected; Cable available; Water connected
- Home design: Single-story home; Mobile home model Westwood (24' x 64'); Mobile home remains; Entry level: 1; Has view; Located on a cul-de-sac; landscaped yard with drip sprinklers and rock accents; front yard
- Construction: Wood construction; Shingle/asphalt roof; Wood skirt; Foundation with seismic tie-down and pier jacks; One story
- Exterior features: Covered front porch; Awning; Rain gutters; Satellite dish; Wood fencing; Has patio; Pool/spa via association (in-ground, heated); Shed
Interior
- Kitchen: Refrigerator; Gas range with range/stove hood; Dishwasher; Formica counters; Kitchen open to family room; Water heater unit (gas)
- Bedrooms: All bedrooms on main floor; Main floor primary bedroom; Office
- Flooring: Laminate flooring
- Bathrooms: Two full bathrooms; Bathtub and separate tub and shower; Shower in tub; Low-flow shower and low-flow toilet(s)
- Heating & cooling: Natural gas heating; Forced air
- Interior features: Ceiling fan; Open floor plan; Cathedral/vaulted ceilings; Formica counters; Double pane windows with blinds and screens; Smoke detector; Has spa (association, in-ground, heated)
- Laundry & utility: Laundry room inside (individual room); Washer included; Dryer included; 220V in laundry
Neighborhood map
What this means for you Summary
Snapshot
- This is a 2-bed/2.0-bath manufactured listed at $235k.
Deal economics
- At list price, monthly cash flow is $837 ($10k/yr) — positive.
- The deal already cash-flows at list — no discount required.
- Meets the 1% rule at list price ($3k rent vs $235k).
Location & tenants
- Location reads 52/100 on livability (#1,037 in CA) — a working-class tenant base; expect higher turnover. Strengths: crime A+, employment A+; Watch: schools D, amenities F, commute F.
- Lucia Mar Unified (town): math 42% / reading 56% proficiency, ranked #433 of 1,400 in CA (top 31%) — families likely to look elsewhere, expect single-tenant / working-renter base with shorter leases.
- Market conditions: 94 active listings in the ZIP; 1 comparable units currently listed for rent nearby; high-income renter base; 1,104 units permitted in San Luis Obispo County in 2024 (273 in 5+ unit buildings).
- This rent runs 31% of the median local income ($111k/yr) — at the standard rent-burdened threshold; future hikes will face affordability resistance.
Forward outlook
- Local home prices are declining (-3.0%/yr); year-one equity from $2k of loan paydown is wiped out by about $7k of value loss. Plan a longer hold.
- San Luis Obispo County population projected at +20% by 2050 — long-run rental-demand tailwind backs the buy-and-hold thesis.
- At projected returns (-3.0% appreciation + 3.0% rent growth), your $66k cash investment doubles in ~8 years — after that, you're playing with house money.
Negotiation context
- Only 10 days on market — expect competitive offers; lowballing is unlikely to land.
- 10 sale attempts since 19y ago with the ask held roughly flat each time — persistent listings suggest the price (not the market) is what's stuck; bring a comps-based counter.
- Current owner paid $196k; 20% above their basis — modest negotiation headroom, anchor on the comps not their cost.
Risks & watch-outs
- Climate carrying-cost: major wildfire risk — expect insurance premiums to compound above CPI over the hold.
Questions for the listing agent
- Is there a deadline driving the sale (1031 exchange, divorce, estate, relocation)? That informs how much negotiation room exists.
- Schools are D-rated, which usually means shorter tenancies and higher turnover. Who's the typical renter profile here, and what's been the actual vacancy rate?
- What's the average days-on-market for RENTAL listings here right now (not sales)? A rising rental-DOM trend means longer vacancies and softer asking-rent achievability than the comps imply.
- What's the recent tenant-quality profile in this submarket — average credit score on applications, eviction rate, late-payment / NSF rate, and stable-employment percentage? A property-management company in the area should have these aggregated.
- How much new for-sale + rental construction is in the pipeline within 1–3 miles? Heavy new supply typically softens prices + rents 12–24 months out; constrained supply supports both.
Investment metrics
- 1% rule
- 1.21% ✓
- Cap rate
- 10.57%
- Cash-on-cash
- 15.26%
- DSCR
- 1.68
- GRM
- 6.9
CMA / ARV
- ARV (on-the-fly)
- $251,712
- Comps found
- 12
Show comp detail 12 sales within ~0.75 mi
| Address | Dist | Beds/Ba | Sqft | Sold | Price | $/sf | Match |
|---|---|---|---|---|---|---|---|
| 765 Mesa View Dr #290 | 0.00mi | 3/2.0 (+1) | 1,320 (-4%) | 1mo | $270,000 | $205 | 88 |
| 765 Mesa View Dr #155 | 0.00mi | 2/2.0 | 1,296 (-5%) | 12mo | $100,000 | $77 | 82 |
| 765 Mesa View Dr #152 | 0.00mi | 3/2.0 (+1) | 1,288 (-6%) | 12mo | $245,000 | $190 | 76 |
| 765 Mesa View Dr #199 | 0.00mi | 3/2.0 (+1) | 1,248 (-9%) | 9mo | $175,000 | $140 | 73 |
| 765 Mesa View Dr #30 | 0.00mi | 2/2.0 | 1,200 (-12%) | 8mo | $234,900 | $196 | 73 |
| 765 Mesa View Dr #137 | 0.00mi | 3/2.0 (+1) | 1,550 (+13%) | 0mo | $290,000 | $187 | 72 |
| 765 Mesa View Dr #293 | 0.00mi | 3/2.0 (+1) | 1,248 (-9%) | 11mo | $230,000 | $184 | 72 |
| 765 Mesa View Dr #269 | 0.00mi | 3/2.0 (+1) | 1,512 (+10%) | 9mo | $179,000 | $118 | 70 |
| 765 Mesa View Dr #13 | 0.00mi | 3/2.0 (+1) | 1,534 (+12%) | 6mo | $350,000 | $228 | 70 |
| 765 Mesa View Dr #272 | 0.00mi | 3/2.0 (+1) | 1,248 (-9%) | 13mo | $145,000 | $116 | 69 |
| 765 Mesa View Dr #280 | 0.00mi | 3/2.0 (+1) | 1,512 (+10%) | 10mo | $219,900 | $145 | 69 |
| 765 Mesa View Dr #226 | 0.00mi | 3/2.0 (+1) | 1,225 (-10%) | 12mo | $215,000 | $176 | 68 |
Match score weights: distance 35% · size 25% · config 20% · recency 20%. Top-matched comps best support the ARV.
Projected returns pro-forma
-3.0% appreciation · 3.0% rent growth · sell at horizon
- IRR
- 5.9%
- Equity multiple
- 1.23×
- Total profit
- $15,127
- Equity at exit
- $35,039
- IRR
- 15.3%
- Equity multiple
- 2.24×
- Total profit
- $81,439
- Equity at exit
- $20,319
Cash invested: $65,800 (down + closing). Projections, not guarantees.
Landlord ↔ Tenant lean methodology
- Overall (STATE)
- 18 Strongly Tenant-Friendly
- State California
- 18 Strongly Tenant-Friendly · D+13
- County
- — inherits STATE
- City
- — inherits STATE
ZIP-level market 93420
- Active inventory
- 94
- Price-to-rent
- 6.9×
Monthly cashflow live
- Estimated rent
- $2,843 medium interval (Pro) →
- Mortgage (P&I)
- −$1,232
- Tax from tax record
- −$79 /mo · $951/yr
- Insurance
- −$98
- HOA
- −$0
- Vacancy / Maint / Mgmt
- −$597
- Net cashflow
- $837
Break-even live
UW: 25.0% down · 7.5% · 30yr · 1.5% tax · 5.0% vac · 8.0% maint · 8.0% mgmt
Financing live
Cash to close
- Down payment
- $58,750
- Closing costs
- $7,050
- Reserves months
- —
- Total cash needed
- —
Loan-product check · same deal, 3 products live
Conventional
25% down · 7.5% · 30yr
- Down + closing
- —
- Monthly P&I
- —
- Monthly cashflow
- —
- DSCR
- —
- Eligible?
- —
Personal DTI + credit; lowest rate.
DSCR
20% down · 8.5% · 30yr
- Down + closing
- —
- Monthly P&I
- —
- Monthly cashflow
- —
- DSCR
- —
- Eligible?
- —
No personal income docs; deal must DSCR.
Hard money
10% down · 12.0% · 12mo
- Down + closing
- —
- Monthly P&I
- —
- Monthly cashflow
- —
- DSCR
- —
- Eligible?
- —
Short-term bridge; refi at stabilization.
Rent comps 1 comps
| Address | Beds | Baths | Sqft | Rent | $/sqft | DOM | Units | Dist |
|---|---|---|---|---|---|---|---|---|
| 765 Mesa View Dr #57 Arroyo Grande, CA | 2.0 | 2.0 | 1440 | $2,775 | $1.93 | 43d | 1 | 0.03mi |
Listing history 9 events
-
2026-06-18days on market $235,000 Active 10 DOM
-
2026-06-17days on market $235,000 Active 9 DOM
-
2026-06-16days on market $235,000 Active 8 DOM
-
2026-06-15days on market $235,000 Active 7 DOM
-
2026-06-14days on market $235,000 Active 5 DOM
-
2026-06-13days on market $235,000 Active 4 DOM
-
2026-06-10days on market $235,000 Active 2 DOM
-
2026-06-09remarks 693-char remark
-
2026-06-09$235,000 Active 1 DOM
ⓘ Source: listings_history table (triggers on properties + properties_extension) + one-shot
backfill from property_details.listing_events for pre-trigger history.
Tax reassessment forecast CA · Resets to sale price
- Current annual tax
- $951 · $79/mo
- Projected year-2 tax
- $1,786 · $149/mo
- Expected delta
- +$835/yr (+$70/mo · 87.8%)
ⓘ Screening estimate from a state-policy table — verify with the county assessor before closing.
Climate risk First Street
- Flood 1/10 Low FEMA zone X (unshaded) · 0% chance over 30 yrs
- Wildfire 6/10 Major
- Heat 4/10 Moderate 5 d/yr ≥79°F today · 10 d/yr by 30 yrs out
- Wind 1/10 Low
- Air quality 6/10 Major 9 unhealthy d/yr today · 10 by 30 yrs out
Nearby sold comps map
Loading sold comps map…
Walkable amenities ~0.75 mi
Loading nearby amenities…
Taxation est. · year 1
- Rental income
- $34,121
- − Mortgage interest
- −$13,164
- − Property taxes
- −$951
- − Insurance
- −$1,175
- − Repairs & maintenance
- −$2,730
- − Management
- −$2,730
- − Depreciation
- −$6,836
- Taxable income
- $6,536
- Est. tax owed @ 24.0%
- −$1,569
- After-tax cash flow
- $8,473/yr
For passive investors: Depreciation is non-cash, so a rental often shows a tax loss while cash-flowing — sheltering income. Rental losses are passive: they offset passive income freely, and up to $25,000/yr can offset ordinary (W-2) income if you actively participate and your MAGI is under $100k (phasing out to $0 by $150k); unused losses carry forward. On sale, claimed depreciation is recaptured at up to 25%, and gains may owe capital-gains tax (a 1031 exchange can defer both). Figures are a year-1 estimate at your 24.0% rate — not tax advice; consult a CPA.
Schools (NCES district)
- District
- Lucia Mar Unified
- NCES district ID
- 0623080
- Math proficiency
- 42% ▲ 3.00%
- Reading proficiency
- 56% ▲ 2.00%
- Median HH income
- $62,681
- Composite
- 45.19/100
- National rank
- #5782
- State rank
- #433 of 1400 in CA
Livability — Callender
- Score
- 52/100
- State rank
- #1037
- US rank
- #25071
Category grades
Schools grade is shown separately in the Schools card above.
Census & demographics
- County
- San Luis Obispo County · 224,651 people
- Metro
- San Luis Obispo-Paso Robles, CA
- Population (ZIP)
- 31,345
- Household income
- $110,553
- Rent vs Own
- Severe rent burden
- 882.0
Population outlook (San Luis Obispo County) Hauer SSP2
- Today (2025)
- 306,977 people
- By 2030
- 320,378 · +4.4%
- By 2040
- 343,933 · +12.0%
- By 2050
- 366,853 · +19.5%
- By 2075
- 428,329 · +39.5%
- By 2100
- 460,687 · +50.1%
Race, ethnicity, and origin ACS 2023
- Neighborhood character
- Predominantly White (71%)
- Race & ethnicity
- White 71% Two or more races 18% Hispanic / Latino 17% Asian 3%
- Hispanic origin (detail)
- Mexican 14%
- Common ancestry
- Italian 4% Slovak 4% Lithuanian 3%
- Foreign-born
- 6% · Canada, China, South Korea
- Languages at home
- 91% English-only · Spanish 5% Chinese 1% Other Asian/Pacific 1%
Political lean MEDSL · San Luis Obispo
- 2024 margin
- D (+10.9) · D 53.9% · R 43.1% · Other 3.0%
- 2008→2024 swing
- +5.5pp toward D · 2008: 5.4pp · 2024: 10.9pp
- All cycles
- 2024: D+10.9 2020: D+13.1 2016: D+8.3 2012: D+1.0 2008: D+5.4
Not yet ingested
- Civics
- —
Market trends
- HPI YoY
- ▼ -798.57%
- Current HPI
- 348.2038
- Rent YoY
- —
- Metro
- San Luis Obispo-Paso Robles, CA
- State GDP YoY
- ▲ 3.21%
- F500 in state
- 116
Industry mix (Fortune 500 HQ in CA)
| Industry | F500 HQs | Revenue |
|---|---|---|
| Technology | 27 | $1,492B |
|
||
| Financial Services | 3 | $174B |
|
||
| Retail | 3 | $44B |
|
||
| Insurance | 3 | $26B |
|
||
| Media / Entertainment | 2 | $115B |
|
||
| Pharmaceuticals / Biotech | 2 | $62B |
|
||
Price history
+147.4% since first listed23 events — show timeline
- 2026-06-08 Listed $235,000 CRMLS
- 2021-12-13 Sold (MLS) $196,000 CRMLS
- 2021-12-13 Pending — CRMLS
- 2021-11-16 Contingent — CRMLS
- 2021-10-28 Listed $209,000 CRMLS
- 2020-10-19 Relisted — CRMLS
- 2020-10-19 Listing Removed — CRMLS
- 2020-04-24 Listed $170,000 CRMLS
- 2020-04-24 Listing Removed — CRMLS
- 2020-04-07 Relisted — CRMLS
- 2020-04-07 Delisted — CRMLS
- 2020-03-23 Delisted — CRMLS
- 2019-12-02 Listed $170,000 CRMLS
- 2017-03-25 Listing Removed — NSBCRMLS
- 2014-03-13 Listing Removed — CRMLS
- 2014-03-01 Pending — CRMLS
- 2014-01-28 Price Changed $105,000 CRMLS
- 2014-01-03 Listed $99,000 CRMLS
- 2014-01-03 Listed $105,000 NSBCRMLS
- 2008-01-18 Sold (MLS) $90,000 CRMLS
- 2008-01-18 Sold (MLS) $90,000 NSBCRMLS
- 2007-12-12 Listed $95,000 CRMLS
- 2007-12-12 Listed $95,000 NSBCRMLS
Property tax history
+3.3%/yrLatest (2025): $951 · +3.5% YoY. Source: county tax records.
Cash-flow waterfall
monthlySold comps — $/sqft
last 12 mo · ≤1 miLoading sold comps…