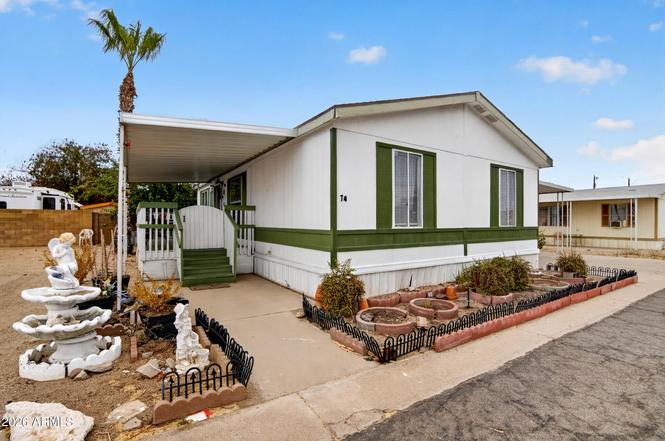
7302 W Peoria Ave #74 · Peoria, AZ
Flood risk No data
- FEMA flood zone
- —
- Chance of flooding over 30 yrs
- —
- Est. flood insurance / yr
- —
Fire risk No data
- Est. fire insurance / yr
- —
Heat risk No data
- Hot days now (above threshold)
- —
- Hot days in 30 yrs
- —
Wind risk No data
- Chance of severe wind over 30 yrs
- —
Air-quality risk No data
- Unhealthy air days now
- —
- Unhealthy air days in 30 yrs
- —
Risk factors via First Street. Map © Google.
Why this score? — see what drove the B+ grade
The composite is a weighted blend of 9 inputs, each scored 0–100. Each bar is that input's sub-score; the figure is the points it added to the 100-point composite (weight × sub-score).
- Cash flow +30.0/30.0
- ARV discount +15.0/15.0
- 1% rule +10.0/10.0
- DSCR +10.0/10.0
- Livability +3.8/5.0
- Schools +3.5/10.0
- Rent growth +2.7/5.0
- Condition / age +2.5/5.0
- Appreciation +0.0/10.0
$54,999
🖨 Deal sheet 📄 Offer letter ✓ Due diligence
Listing remarks
Welcome to McCoy Mobile Home Park -- a welcoming all-ages community. This light-filled 3-bedroom, 2-bath home offers an open floor plan with vaulted ceilings and a bright living area. The functional kitchen features ample cabinetry and gas cooking. Durable laminate and wood-style floors flow throughout, and the full bath includes a tiled vanity. Enjoy outdoor living on the expansive covered front deck--ideal for morning coffee or evening relaxation. Additional highlights include a double carport, built-in storage shed, and low-maintenance desert landscaping. Conveniently located near shopping, dining, and freeway access, this home blends comfort and convenience
Key facts
- Functional kitchen
- Open floor plan
- Double carport
Tags
Property features AI
Finance
- Other: Lot and building area reported by owner
- HOA & community: Land lease of $775 per month; Association fees include other items (see remarks); Near bus stop
Exterior
- Parking: 1 covered parking space; 1 open parking space; 1 carport space
- Utilities: Private sewer; Private water company
- Home design: Manufactured/Mobile home; Leasehold ownership
- Construction: Wood frame construction; Painted exterior; Composition roof
- Exterior features: Storage; Gravel/stone front yard; Gravel/stone backyard; No fencing
Interior
- Kitchen: Non-laminate counters; Refrigerator; Dishwasher
- Bedrooms: Up to 3 bedrooms
- Flooring: Laminate flooring
- Bathrooms: 2 full bathrooms
- Heating & cooling: Natural gas heating; Central air conditioning
- Interior features: High-speed internet; Eat-in kitchen; Full bathroom in primary bedroom
Neighborhood map
What this means for you Summary
Snapshot
- This is a 3-bed/2.0-bath manufactured listed at $55k.
Deal economics
- At list price, monthly cash flow is $1k ($13k/yr) — positive.
- The deal already cash-flows at list — no discount required.
- Meets the 1% rule at list price ($2k rent vs $55k).
- Cap rate 30.0% vs local median 3.3% in Peoria — top-decile yield for the area; either an underpriced asset or a hidden risk that comps aren't pricing in. Stress-test before assuming the spread holds.
Location & tenants
- Location reads 76/100 on livability (#14 in AZ, #3,603 nationally) — a middle-class / working-renter tenant base. Strengths: housing A+, commute A, employment A; Watch: cost of living C-, amenities D, health & safety F.
- Peoria Unified School District (4237) (suburban): math 36% / reading 42% proficiency, ranked #64 of 249 in AZ (top 26%) — families likely to look elsewhere, expect single-tenant / working-renter base with shorter leases.
- Zoned schools: Peoria Elementary School (math 21% / reading 29%, grade F, #638 of 1,109 statewide, top 58%, 554 students, 68% FRL); Peoria High School (math 18% / reading 22%, grade F, #225 of 381 statewide, top 60%, 1,566 students, 54% FRL) — zoned schools average 61% FRL vs 35% district-wide (26 pts higher); higher-poverty schools than district average — tighter screening recommended.
- Zoned-school proficiency averages 22% at this address vs 39% district-wide (-16 pts) — the specific schools serving this property underperform the Peoria Unified School District (4237) average; the district grade overstates school quality for this exact location.
- Market conditions: Rents flat; 333 active listings in the ZIP; 31 comparable units currently listed for rent nearby; rentals at typical pace (median 25d on market — plan ~3-4 weeks tenant-placement turnaround); 36,011 units permitted in Maricopa County in 2024 (12,801 in 5+ unit buildings).
- This rent runs 33% of the median local income ($67k/yr) — at the standard rent-burdened threshold; future hikes will face affordability resistance.
Forward outlook
- Local home prices are declining (-3.0%/yr); year-one equity from $380 of loan paydown is wiped out by about $2k of value loss. Plan a longer hold.
- Maricopa County population projected at +38% by 2050 — long-run rental-demand tailwind backs the buy-and-hold thesis.
- At projected returns (-3.0% appreciation + 0.6% rent growth), your $15k cash investment doubles in ~2 years — after that, you're playing with house money.
Negotiation context
- Only 1 days on market — expect competitive offers; lowballing is unlikely to land.
- 3 sale attempts with the ask held roughly flat each time — persistent listings suggest the price (not the market) is what's stuck; bring a comps-based counter.
Questions for the listing agent
- Is there a deadline driving the sale (1031 exchange, divorce, estate, relocation)? That informs how much negotiation room exists.
- Schools are B-rated — typically a magnet for longer-tenancy family renters. What's the average tenant stay here, and is there a school-zone premium baked into asking?
- What's the average days-on-market for RENTAL listings here right now (not sales)? A rising rental-DOM trend means longer vacancies and softer asking-rent achievability than the comps imply.
- What's the recent tenant-quality profile in this submarket — average credit score on applications, eviction rate, late-payment / NSF rate, and stable-employment percentage? A property-management company in the area should have these aggregated.
- How much new for-sale + rental construction is in the pipeline within 1–3 miles? Heavy new supply typically softens prices + rents 12–24 months out; constrained supply supports both.
Investment metrics
- 1% rule
- 3.38% ✓
- Cap rate
- 30.02%
- Cash-on-cash
- 84.75%
- DSCR
- 4.77
- GRM
- 2.5
CMA / ARV
- ARV (on-the-fly)
- $66,528
- Comps found
- 12
Show comp detail 12 sales within ~0.75 mi
| Address | Dist | Beds/Ba | Sqft | Sold | Price | $/sf | Match |
|---|---|---|---|---|---|---|---|
| 7302 W Peoria Ave #65 | 0.08mi | 3/2.0 | 1,056 (0%) | 3mo | $66,500 | $63 | 94 |
| 6960 W Peoria Ave #181 | 0.53mi | 2/2.0 (-1) | 1,056 (0%) | 2mo | $77,000 | $73 | 69 |
| 7810 W Peoria Ave #30 | 0.58mi | 2/2.0 (-1) | 1,056 (0%) | 11mo | $106,000 | $100 | 59 |
| 7810 W Peoria Ave #153 | 0.58mi | 2/2.0 (-1) | 1,056 (0%) | 12mo | $105,000 | $99 | 58 |
| 6960 W Peoria Ave #44 | 0.45mi | 2/2.0 (-1) | 952 (-10%) | 1mo | $25,000 | $26 | 57 |
| 6960 W Peoria Ave #166 | 0.45mi | 2/2.0 (-1) | 1,152 (+9%) | 4mo | $72,000 | $63 | 56 |
| 7810 W Peoria Ave #128 | 0.67mi | 3/2.0 | 980 (-7%) | 2mo | $40,000 | $41 | 55 |
| 6960 W Peoria Ave #49 | 0.53mi | 2/2.0 (-1) | 980 (-7%) | 6mo | $21,000 | $21 | 53 |
| 6960 W Peoria Ave #171 | 0.45mi | 2/2.0 (-1) | 924 (-12%) | 7mo | $45,000 | $49 | 47 |
| 7810 W Peoria Ave #33 | 0.58mi | 3/2.0 | 952 (-10%) | 12mo | $85,000 | $89 | 47 |
| 6960 W Peoria Ave #59 | 0.48mi | 2/2.0 (-1) | 1,188 (+12%) | 7mo | $74,000 | $62 | 46 |
| 10955 N 79th Ave #60 | 0.69mi | 2/2.0 (-1) | 972 (-8%) | 4mo | $65,000 | $67 | 46 |
Match score weights: distance 35% · size 25% · config 20% · recency 20%. Top-matched comps best support the ARV.
Projected returns pro-forma
-3.0% appreciation · 0.62% rent growth · sell at horizon
- IRR
- 82.5%
- Equity multiple
- 4.64×
- Total profit
- $56,043
- Equity at exit
- $8,201
- IRR
- 85.2%
- Equity multiple
- 8.86×
- Total profit
- $121,113
- Equity at exit
- $4,755
Cash invested: $15,400 (down + closing). Projections, not guarantees.
Landlord ↔ Tenant lean methodology
- Overall (STATE)
- 87 Strongly Landlord-Friendly
- State Arizona
- 87 Strongly Landlord-Friendly · R+3
- County
- — inherits STATE
- City
- — inherits STATE
ZIP-level market 85345
- Home prices YoY
- -19.8%
- Rents YoY
- 0.6%
- Active inventory
- 333
- Price-to-rent
- 2.5×
Monthly cashflow live
- Estimated rent
- $1,858 high interval (Pro) →
- Mortgage (P&I)
- −$288
- Tax est. 1.5%
- −$69 /mo · $825/yr
- Insurance
- −$23
- HOA
- −$0
- Vacancy / Maint / Mgmt
- −$390
- Net cashflow
- $1,088
Break-even live
UW: 25.0% down · 7.5% · 30yr · 1.5% tax · 5.0% vac · 8.0% maint · 8.0% mgmt
Financing live
Cash to close
- Down payment
- $13,750
- Closing costs
- $1,650
- Reserves months
- —
- Total cash needed
- —
Loan-product check · same deal, 3 products live
Conventional
25% down · 7.5% · 30yr
- Down + closing
- —
- Monthly P&I
- —
- Monthly cashflow
- —
- DSCR
- —
- Eligible?
- —
Personal DTI + credit; lowest rate.
DSCR
20% down · 8.5% · 30yr
- Down + closing
- —
- Monthly P&I
- —
- Monthly cashflow
- —
- DSCR
- —
- Eligible?
- —
No personal income docs; deal must DSCR.
Hard money
10% down · 12.0% · 12mo
- Down + closing
- —
- Monthly P&I
- —
- Monthly cashflow
- —
- DSCR
- —
- Eligible?
- —
Short-term bridge; refi at stabilization.
Rent comps 31 comps
| Address | Beds | Baths | Sqft | Rent | $/sqft | DOM | Units | Dist |
|---|---|---|---|---|---|---|---|---|
| 6960 W Peoria Ave #90 Peoria, AZ | 2.0 | 1.0 | 704 | $1,320 | $1.88 | 24d | 1 | 0.44mi |
| 11600 N 75th Ave Peoria, AZ | 2.0 | 2.0 | 814 | $1,325 | $1.63 | 2d | 4 | 0.54mi |
| 9914 N 73rd Ave Peoria, AZ | 3.0 | 1.5 | 1312 | $1,716 | $1.31 | 44d | 1 | 0.58mi |
| 6826 W Cholla St Peoria, AZ | 4.0 | 2.0 | 1440 | $1,869 | $1.30 | 44d | 1 | 0.66mi |
| 11807 N 76th Ave Peoria, AZ | 3.0 | 2.0 | 1228 | $1,995 | $1.62 | 44d | 1 | 0.69mi |
| 9903 N 77th Ave Peoria, AZ | 3.0 | 2.0 | 1446 | $1,895 | $1.31 | 4d | 1 | 0.76mi |
| 11851 N 76th Dr Peoria, AZ | 3.0 | 2.0 | 1266 | $1,899 | $1.50 | 5d | 1 | 0.77mi |
| 7102 W Palo Verde Ave Peoria, AZ | 3.0 | 2.0 | 1360 | $2,000 | $1.47 | 44d | 1 | 0.79mi |
| 7914 W Mescal St Peoria, AZ | 3.0 | 2.0 | 1296 | $1,700 | $1.31 | 4d | 1 | 0.81mi |
| 7027 W Palo Verde Ave Peoria, AZ | 3.0 | 2.0 | 1500 | $1,999 | $1.33 | 44d | 1 | 0.85mi |
| 7102 W Carol Ave Peoria, AZ | 3.0 | 2.0 | 1288 | $1,970 | $1.53 | 5d | 1 | 0.89mi |
| 6605 W Mescal St Glendale, AZ | 3.0 | 2.0 | 1369 | $1,895 | $1.38 | 5d | 1 | 0.91mi |
| 10013 N 66th Ln Glendale, AZ | 3.0 | 2.0 | 1063 | $1,999 | $1.88 | 24d | 1 | 0.95mi |
| 11014 N 81st Ave Peoria, AZ | 3.0 | 3.0 | 1133 | $1,699 | $1.50 | 5d | 1 | 1.02mi |
| 7040 W Olive Ave #12 Peoria, AZ | 2.0 | 2.0 | 900 | $1,445 | $1.61 | 24d | 1 | 1.11mi |
| 7951 W Whitney Dr Peoria, AZ | 2.0–4.0 | 2.0–2.5 | 1411 | $2,540 | $1.80 | 1d | 30 | 1.14mi |
| 9350 N 67th Ave Unit B2 Glendale, AZ | 2.0 | 2.0 | 970 | $1,250 | $1.29 | 44d | 1 | 1.16mi |
| 9350 N 67th Ave Unit B1 Glendale, AZ | 2.0 | 1.0 | 842 | $1,070 | $1.27 | 24d | 1 | 1.16mi |
| 9350 N 67th Ave Glendale, AZ | 2.0 | 2.0 | 970 | $1,429 | $1.47 | 44d | 1 | 1.17mi |
| 9350 N 67th Ave Glendale, AZ | 2.0 | 2.0 | 970 | $1,385 | $1.43 | 13d | 1 | 1.17mi |
| 7040 W Olive Ave Peoria, AZ | 2.0 | 2.0 | 953 | $1,465 | $1.54 | 5d | 1 | 1.19mi |
| 6325 W Cheryl Dr Glendale, AZ | 2.0 | 2.0 | 1092 | $2,100 | $1.92 | 24d | 1 | 1.21mi |
| 9121 N 68th Ave Peoria, AZ | 2.0 | 2.0 | 1126 | $1,699 | $1.51 | 44d | 1 | 1.22mi |
| 11110 N 82nd Ln Peoria, AZ | 3.0 | 2.0 | 1350 | $1,899 | $1.41 | 24d | 1 | 1.23mi |
| 9160 N 67th Ave Unit 212 Peoria, AZ | 2.0 | 2.0 | 992 | $1,680 | $1.69 | 24d | 1 | 1.25mi |
| 8280 W Madison St Peoria, AZ | 2.0 | 2.0 | 800 | $1,400 | $1.75 | 44d | 1 | 1.27mi |
| 9160 N 67th Ave Peoria, AZ | 2.0 | 2.0 | 1100 | $2,065 | $1.88 | 44d | 6 | 1.27mi |
| 8311 W Edwards St Peoria, AZ | 3.0 | 2.0 | 1242 | $2,100 | $1.69 | 24d | 1 | 1.30mi |
| 8165 W Whitney Dr Peoria, AZ | 1.0–2.0 | 1.0–2.0 | 911 | $2,223 | $2.44 | 1d | 229 | 1.32mi |
| 6421 W Carol Ave Glendale, AZ | 3.0 | 2.0 | 1243 | $1,799 | $1.45 | 18d | 1 | 1.34mi |
| 9592 N 82nd Ave Peoria, AZ | 3.0 | 2.5 | 1401 | $1,775 | $1.27 | 15d | 1 | 1.40mi |
Listing history 2 events
-
2026-06-18remarks 669-char remark
-
2026-06-18$54,999 Active 1 DOM
ⓘ Source: listings_history table (triggers on properties + properties_extension) + one-shot
backfill from property_details.listing_events for pre-trigger history.
Nearby sold comps map
Loading sold comps map…
Walkable amenities ~0.75 mi
Loading nearby amenities…
Taxation est. · year 1
- Rental income
- $22,295
- − Mortgage interest
- −$3,081
- − Property taxes
- −$825
- − Insurance
- −$275
- − Repairs & maintenance
- −$1,784
- − Management
- −$1,784
- − Depreciation
- −$1,600
- Taxable income
- $12,947
- Est. tax owed @ 24.0%
- −$3,107
- After-tax cash flow
- $9,945/yr
For passive investors: Depreciation is non-cash, so a rental often shows a tax loss while cash-flowing — sheltering income. Rental losses are passive: they offset passive income freely, and up to $25,000/yr can offset ordinary (W-2) income if you actively participate and your MAGI is under $100k (phasing out to $0 by $150k); unused losses carry forward. On sale, claimed depreciation is recaptured at up to 25%, and gains may owe capital-gains tax (a 1031 exchange can defer both). Figures are a year-1 estimate at your 24.0% rate — not tax advice; consult a CPA.
Schools (NCES district)
- District
- Peoria Unified School District (4237)
- NCES district ID
- 0406250
- Math proficiency
- 36% ▼ -14.00%
- Reading proficiency
- 42% ▼ -8.00%
- Median HH income
- $60,171
- Composite
- 34.62/100
- National rank
- #5152
- State rank
- #64 of 249 in AZ
Livability — Peoria
- Score
- 76/100
- State rank
- #14
- US rank
- #3603
Category grades
Schools grade is shown separately in the Schools card above.
Census & demographics
- Census place
- Peoria, AZ
- County
- Maricopa County · 4,537,380 people
- City population
- 206,687
- Metro
- Phoenix-Mesa-Chandler, AZ
- Population (ZIP)
- 60,918
- Household income
- $67,380
- Rent vs Own
- Severe rent burden
- 1879.0
Population outlook (Maricopa County) Hauer SSP2
- Today (2025)
- 4,979,203 people
- By 2030
- 5,378,229 · +8.0%
- By 2040
- 6,156,598 · +23.6%
- By 2050
- 6,872,376 · +38.0%
- By 2075
- 8,401,270 · +68.7%
- By 2100
- 9,247,439 · +85.7%
Race, ethnicity, and origin ACS 2023
- Neighborhood character
- Diverse neighborhood (Simpson 0.62)
- Race & ethnicity
- White 51% Hispanic / Latino 34% Two or more races 14% Black 5% Asian 4% Native American 2%
- Hispanic origin (detail)
- Mexican 29%
- Common ancestry
- Romanian 2% Italian 2% Slovak 1%
- Foreign-born
- 13% · Canada, Vietnam
- Languages at home
- 76% English-only · Spanish 18% Other Indo-European 1% Vietnamese 1%
Political lean MEDSL · Maricopa
- 2024 margin
- Toss-up / Even · D 47.7% · R 51.2% · Other 1.1%
- 2008→2024 swing
- +7.1pp toward D · 2008: -10.6pp · 2024: -3.5pp
- All cycles
- 2024: R+3.5 2020: D+2.2 2016: R+3.5 2012: R+12.0 2008: R+10.6
Not yet ingested
- Civics
- —
Market trends
- HPI YoY
- ▼ -80.77%
- Current HPI
- 328.1069
- Rent YoY
- ▲ 0.62%
- Metro
- Phoenix-Mesa-Chandler, AZ
- State GDP YoY
- ▲ 4.54%
- F500 in state
- 20
Industry mix (Fortune 500 HQ in AZ)
| Industry | F500 HQs | Revenue |
|---|---|---|
| Technology | 2 | $13B |
|
||
| Mining / Metals | 1 | $23B |
|
||
| Environmental Services | 1 | $16B |
|
||
| Metals / Steel | 1 | $14B |
|
||
| Technology Distribution | 1 | $9B |
|
||
| Homebuilding | 1 | $8B |
|
||
Price history
-15.4% since first listed6 events — show timeline
- 2026-06-08 Listed $54,999 ARMLS
- 2026-02-02 Listing Removed — ARMLS
- 2026-01-02 Price Changed $60,000 ARMLS
- 2025-12-11 Listed $65,000 ARMLS
- 2025-10-14 Listing Removed — ARMLS
- 2025-07-24 Listed $65,000 ARMLS
Cash-flow waterfall
monthlySold comps — $/sqft
last 12 mo · ≤1 miLoading sold comps…