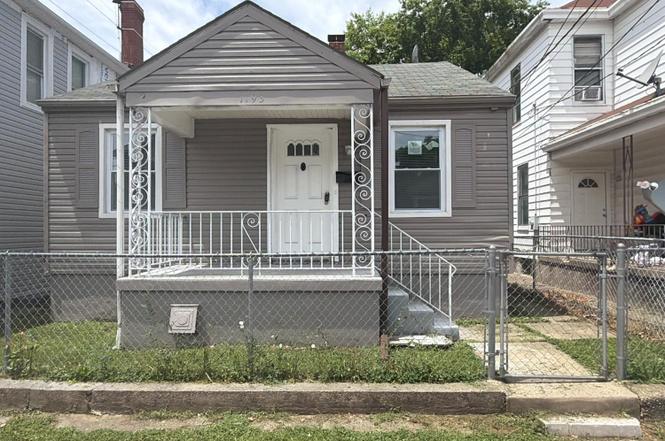
1193 Shuler Ave · Hamilton, OH
Flood risk 1/10 · Minimal
- FEMA flood zone
- X (unshaded)
- Chance of flooding over 30 yrs
- 0.0%
- Est. flood insurance / yr
- $473 – $860
Fire risk 1/10 · Minimal
- Est. fire insurance / yr
- $713 – $1,323
Heat risk 5/10 · Moderate
- Hot days now (above 104°F)
- 7 days/yr
- Hot days in 30 yrs
- 19 days/yr
Wind risk 2/10 · Minimal
- Chance of severe wind over 30 yrs
- 1.0%
Air-quality risk 3/10 · Minor
- Unhealthy air days now
- 2 days/yr
- Unhealthy air days in 30 yrs
- 3 days/yr
Risk factors via First Street. Map © Google.
Why this score? — see what drove the C grade
The composite is a weighted blend of 9 inputs, each scored 0–100. Each bar is that input's sub-score; the figure is the points it added to the 100-point composite (weight × sub-score).
- Cash flow +25.9/30.0
- DSCR +8.7/10.0
- 1% rule +6.1/10.0
- ARV discount +4.7/15.0
- Livability +3.7/5.0
- Schools +3.6/10.0
- Rent growth +3.2/5.0
- Condition / age +2.5/5.0
- Appreciation +0.0/10.0
$109,900
🖨 Deal sheet 📄 Offer letter ✓ Due diligence
Listing remarks MLS
2 Bedroom 1 full bath ranch.. Full basement with 1/2 Bath... Fenced in backyard.. 1 car detached garage with alley access..
Key facts
- Move in ready
- Conveniently located
- 3,920 sq ft lot
Tags
Property features AI
Finance
- Other: Lot size approx. 0.09 acres
- HOA & community: No HOA
Exterior
- Parking: Detached garage; Driveway and on-street parking
- Utilities: Public water; Public sewer; Natural gas service
- Home design: Craftsman/Bungalow style single-family home; One level; Poured foundation
- Construction: Vinyl siding; Shingle roof
- Exterior features: Vinyl windows; Residential zoning; Lot dimensions about 30 x 125
Interior
- Kitchen: Kitchen approx. 10 x 12
- Bedrooms: Two bedrooms — primary bedroom approx. 11 x 12 (level 1); second bedroom approx. 9 x 10 (level 1)
- Bathrooms: One full bathroom on level 1
- Heating & cooling: Forced air heating (gas); Central air conditioning; Gas water heater
- Interior features: Six total rooms; Partially finished basement
Neighborhood map
What this means for you Summary
Snapshot
- This is a 2-bed/1.0-bath single-family listed at $110k.
Deal economics
- At list price, monthly cash flow is $271 ($3k/yr) — positive.
- The deal already cash-flows at list — no discount required.
- Meets the 1% rule at list price ($1k rent vs $110k).
- Cap rate 9.3% vs local median 4.6% in Hamilton — top-decile yield for the area; either an underpriced asset or a hidden risk that comps aren't pricing in. Stress-test before assuming the spread holds.
Location & tenants
- Location reads 73/100 on livability (#332 in OH) — a middle-class / working-renter tenant base. Strengths: cost of living A+, housing A+, schools B; Watch: crime C-, amenities C-, employment D.
- Hamilton City (suburban): math 42% / reading 45% proficiency, ranked #517 of 656 in OH (top 79%) — families likely to look elsewhere, expect single-tenant / working-renter base with shorter leases; 63% free/reduced lunch — lower-income household profile, screen leases tightly.
- Market conditions: Rents rising (+3.0%/yr); 196 active listings in the ZIP; 7 comparable units currently listed for rent nearby; rentals at typical pace (median 24d on market — plan ~3-4 weeks tenant-placement turnaround); 43% of comp listings sitting > 30 days — soft ceiling on asking rent; solid renter incomes; 1,163 units permitted in Butler County in 2024 (356 in 5+ unit buildings).
- This rent is only 16% of the median local income ($92k/yr) — well below the 30% rent-burden line; pricing power to push rent on renewal without tenant pushback.
Forward outlook
- Local home prices are declining (-3.0%/yr); year-one equity from $760 of loan paydown is wiped out by about $3k of value loss. Plan a longer hold.
Negotiation context
- Only 1 days on market — expect competitive offers; lowballing is unlikely to land.
- 3 sale attempts since 29y ago with the ask held roughly flat each time — persistent listings suggest the price (not the market) is what's stuck; bring a comps-based counter.
- Current owner paid $16k; list at $110k implies a 600% gain — meaningful room to come down on a strong offer.
Risks & watch-outs
- Watch-outs: built in 1942 — expect roof / HVAC / electrical / plumbing capex.
- Climate carrying-cost: extreme-heat days projected 7→19/yr by 2055 (HVAC capex compounding) — expect insurance premiums to compound above CPI over the hold.
Questions for the listing agent
- Built in 1942 — when were the roof, HVAC, electrical panel, plumbing, and water heater last replaced?
- Is there a deadline driving the sale (1031 exchange, divorce, estate, relocation)? That informs how much negotiation room exists.
- Schools are B-rated — typically a magnet for longer-tenancy family renters. What's the average tenant stay here, and is there a school-zone premium baked into asking?
- What's the average days-on-market for RENTAL listings here right now (not sales)? A rising rental-DOM trend means longer vacancies and softer asking-rent achievability than the comps imply.
- What's the recent tenant-quality profile in this submarket — average credit score on applications, eviction rate, late-payment / NSF rate, and stable-employment percentage? A property-management company in the area should have these aggregated.
- How much new for-sale + rental construction is in the pipeline within 1–3 miles? Heavy new supply typically softens prices + rents 12–24 months out; constrained supply supports both.
Investment metrics
- 1% rule
- 1.11% ✓
- Cap rate
- 9.25%
- Cash-on-cash
- 10.56%
- DSCR
- 1.47
- GRM
- 7.5
CMA / ARV
- ARV (on-the-fly)
- $103,488
- Comps found
- 12
Show comp detail 12 sales within ~0.75 mi
| Address | Dist | Beds/Ba | Sqft | Sold | Price | $/sf | Match |
|---|---|---|---|---|---|---|---|
| 1720 Howell Ave | 0.20mi | 2/1.0 | 644 (-4%) | 6mo | $120,000 | $186 | 79 |
| 1226 Clearview Pl | 0.21mi | 2/1.0 | 720 (+7%) | 7mo | $158,500 | $220 | 72 |
| 946 Corliss Ave | 0.27mi | 2/1.0 | 720 (+7%) | 6mo | $139,000 | $193 | 71 |
| 1110 Shuler Ave | 0.08mi | 2/1.0 | 768 (+14%) | 6mo | $124,900 | $163 | 67 |
| 1746 Shuler Ave | 0.38mi | 2/1.0 | 720 (+7%) | 5mo | $67,500 | $94 | 66 |
| 1555 S Twelfth St | 0.48mi | 2/1.0 | 708 (+5%) | 3mo | $50,000 | $71 | 66 |
| 1308 Bonacker | 0.39mi | 2/1.0 | 732 (+9%) | 1mo | $146,000 | $199 | 66 |
| 1832 Pater Ave | 0.61mi | 2/1.0 | 680 (+1%) | 5mo | $70,000 | $103 | 65 |
| 1612 Irma Ave | 0.35mi | 2/1.0 | 748 (+11%) | 2mo | $115,500 | $154 | 63 |
| 1712 Parrish Ave | 0.38mi | 2/1.0 | 770 (+15%) | 2mo | $66,000 | $86 | 57 |
| 422 S Thirteenth St | 0.63mi | 1/1.0 (-1) | 625 (-7%) | 2mo | $86,000 | $138 | 52 |
| 1484 Milton Ave | 0.73mi | 2/1.0 | 728 (+8%) | 8mo | $110,500 | $152 | 46 |
Match score weights: distance 35% · size 25% · config 20% · recency 20%. Top-matched comps best support the ARV.
Projected returns pro-forma
-3.0% appreciation · 2.95% rent growth · sell at horizon
- IRR
- -0.6%
- Equity multiple
- 0.98×
- Total profit
- $-643
- Equity at exit
- $16,386
- IRR
- 9.1%
- Equity multiple
- 1.69×
- Total profit
- $21,310
- Equity at exit
- $9,502
Cash invested: $30,772 (down + closing). Projections, not guarantees.
Landlord ↔ Tenant lean methodology
- Overall (STATE)
- 73 Landlord-Friendly
- State Ohio
- 73 Landlord-Friendly · R+6
- County
- — inherits STATE
- City
- — inherits STATE
ZIP-level market 45011
- Rents YoY
- 3.0%
- Active inventory
- 196
- Price-to-rent
- 7.5×
Monthly cashflow live
- Estimated rent
- $1,221 high interval (Pro) →
- Mortgage (P&I)
- −$576
- Tax from tax record
- −$72 /mo · $860/yr
- Insurance
- −$46
- HOA
- −$0
- Vacancy / Maint / Mgmt
- −$256
- Net cashflow
- $271
Break-even live
UW: 25.0% down · 7.5% · 30yr · 1.5% tax · 5.0% vac · 8.0% maint · 8.0% mgmt
Financing live
Cash to close
- Down payment
- $27,475
- Closing costs
- $3,297
- Reserves months
- —
- Total cash needed
- —
Loan-product check · same deal, 3 products live
Conventional
25% down · 7.5% · 30yr
- Down + closing
- —
- Monthly P&I
- —
- Monthly cashflow
- —
- DSCR
- —
- Eligible?
- —
Personal DTI + credit; lowest rate.
DSCR
20% down · 8.5% · 30yr
- Down + closing
- —
- Monthly P&I
- —
- Monthly cashflow
- —
- DSCR
- —
- Eligible?
- —
No personal income docs; deal must DSCR.
Hard money
10% down · 12.0% · 12mo
- Down + closing
- —
- Monthly P&I
- —
- Monthly cashflow
- —
- DSCR
- —
- Eligible?
- —
Short-term bridge; refi at stabilization.
Rent comps 7 comps
| Address | Beds | Baths | Sqft | Rent | $/sqft | DOM | Units | Dist |
|---|---|---|---|---|---|---|---|---|
| 350 Vista Dr Unit 2 Hamilton, OH | 1.0 | 1.0 | 700 | $875 | $1.25 | 1d | 1 | 0.62mi |
| 350 Vista Dr Apt 1 Hamilton, OH | 1.0 | 1.0 | 700 | $900 | $1.29 | 43d | 1 | 0.62mi |
| 358 Hampshire Dr Hamilton, OH | 1.0–2.0 | 1.0 | 687 | $1,250 | $1.82 | 1d | 23 | 0.72mi |
| 358 Hampshire Dr Unit BHA-35607 Hamilton, OH | 1.0 | 1.0 | 630 | $1,075 | $1.71 | 43d | 1 | 0.72mi |
| 358 Hampshire Dr Unit 1FNA-49814 Hamilton, OH | 1.0 | 1.0 | 525 | $985 | $1.88 | 43d | 1 | 0.72mi |
| 1324 Campbell Ave Hamilton, OH | 1.0 | 1.0 | 528 | $795 | $1.51 | 23d | 1 | 0.81mi |
| 829 Maple Ave Apt 1 Hamilton, OH | 1.0 | 1.0 | 731 | $755 | $1.03 | 23d | 1 | 0.90mi |
Listing history 2 events
-
2026-06-18remarks 569-char remark
-
2026-06-18$109,900 Active 1 DOM
ⓘ Source: listings_history table (triggers on properties + properties_extension) + one-shot
backfill from property_details.listing_events for pre-trigger history.
Tax reassessment forecast OH · Partial reset (capped growth)
- Current annual tax
- $860 · $72/mo
- Projected year-2 tax
- $1,287 · $107/mo
- Expected delta
- +$427/yr (+$36/mo · 49.7%)
ⓘ Screening estimate from a state-policy table — verify with the county assessor before closing.
Climate risk First Street
- Flood 1/10 Low FEMA zone X (unshaded) · 0% chance over 30 yrs
- Wildfire 1/10 Low
- Heat 5/10 Major 7 d/yr ≥104°F today · 19 d/yr by 30 yrs out
- Wind 2/10 Low 100% chance of damaging wind over 30 yrs
- Air quality 3/10 Moderate 2 unhealthy d/yr today · 3 by 30 yrs out
Nearby sold comps map
Loading sold comps map…
Walkable amenities ~0.75 mi
Loading nearby amenities…
Taxation est. · year 1
- Rental income
- $14,652
- − Mortgage interest
- −$6,156
- − Property taxes
- −$860
- − Insurance
- −$550
- − Repairs & maintenance
- −$1,172
- − Management
- −$1,172
- − Depreciation
- −$3,197
- Taxable income
- $1,545
- Est. tax owed @ 24.0%
- −$371
- After-tax cash flow
- $2,879/yr
For passive investors: Depreciation is non-cash, so a rental often shows a tax loss while cash-flowing — sheltering income. Rental losses are passive: they offset passive income freely, and up to $25,000/yr can offset ordinary (W-2) income if you actively participate and your MAGI is under $100k (phasing out to $0 by $150k); unused losses carry forward. On sale, claimed depreciation is recaptured at up to 25%, and gains may owe capital-gains tax (a 1031 exchange can defer both). Figures are a year-1 estimate at your 24.0% rate — not tax advice; consult a CPA.
Schools (NCES district)
- District
- Hamilton City
- NCES district ID
- 3904410
- Math proficiency
- 42% ▼ -13.00%
- Reading proficiency
- 45% ▼ -10.00%
- Median HH income
- $40,488
- Composite
- 36.48/100
- National rank
- #4656
- State rank
- #517 of 656 in OH
Livability — Hamilton
- Score
- 73/100
- State rank
- #332
- US rank
- #5467
Category grades
Schools grade is shown separately in the Schools card above.
Census & demographics
- Census place
- Hamilton, OH
- County
- Butler County · 381,674 people
- City population
- 140,900
- Metro
- Cincinnati, OH-KY-IN
- Population (ZIP)
- 75,864
- Household income
- $91,873
- Rent vs Own
- Severe rent burden
- 1795.0
Population outlook (Butler County) Hauer SSP2
- Today (2025)
- 387,706 people
- By 2030
- 392,028 · +1.1%
- By 2040
- 395,307 · +2.0%
- By 2050
- 391,116 · +0.9%
- By 2075
- 378,642 · -2.3%
- By 2100
- 343,248 · -11.5%
Race, ethnicity, and origin ACS 2023
- Neighborhood character
- Predominantly White (68%)
- Race & ethnicity
- White 68% Hispanic / Latino 12% Black 11% Two or more races 9% Asian 4%
- Hispanic origin (detail)
- Mexican 7%
- Common ancestry
- Romanian 2% Italian 2% Slovak 2%
- Foreign-born
- 11% · Canada, Vietnam, China
- Languages at home
- 86% English-only · Spanish 8% Other Indo-European 2% Vietnamese 1%
Political lean MEDSL · Butler
- 2024 margin
- Strong R (+26.3) · D 36.4% · R 62.7%
- 2008→2024 swing
- -3.6pp toward R · 2008: -22.6pp · 2024: -26.3pp
- All cycles
- 2024: R+26.3 2020: R+24.0 2016: R+28.3 2012: R+26.2 2008: R+22.6
Not yet ingested
- Civics
- —
Market trends
- HPI YoY
- ▼ -188.67%
- Current HPI
- 259.7868
- Rent YoY
- ▲ 2.95%
- Metro
- Cincinnati, OH-KY-IN
- State GDP YoY
- ▲ 1.98%
- F500 in state
- 48
Industry mix (Fortune 500 HQ in OH)
| Industry | F500 HQs | Revenue |
|---|---|---|
| Insurance | 3 | $145B |
|
||
| Industrial Machinery | 3 | $49B |
|
||
| Financial Services | 3 | $24B |
|
||
| Consumer Goods | 2 | $93B |
|
||
| Aerospace / Defense | 2 | $47B |
|
||
| Utilities | 2 | $33B |
|
||
Price history
+155.6% since first listed8 events — show timeline
- 2026-06-18 Listed $109,900 Cincy MLS
- 2016-01-11 Sold (MLS) $15,700 Cincy MLS
- 2015-12-15 Contingent — Cincy MLS
- 2015-12-06 Listed $15,700 Cincy MLS
- 1997-10-06 Sold (Public Records) $57,000 Public Records
- 1997-09-30 Sold (MLS) $57,000 Cincy MLS
- 1997-06-02 Listed $57,900 Cincy MLS
- 1994-12-29 Sold (Public Records) $43,000 Public Records
Property tax history
+3.2%/yrLatest (2025): $860 · +0.5% YoY. Source: county tax records.
Cash-flow waterfall
monthlySold comps — $/sqft
last 12 mo · ≤1 miLoading sold comps…