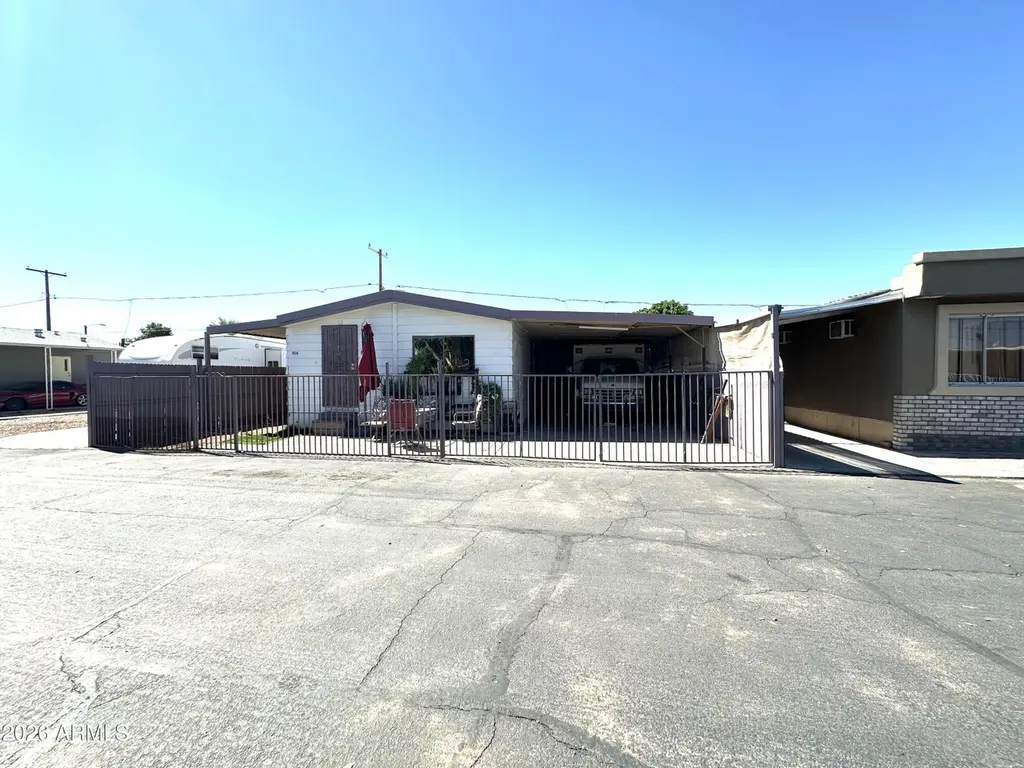
5002 W Bethany Home Rd #104 · Glendale, AZ
Flood risk 1/10 · Minimal
- FEMA flood zone
- X (shaded)
- Chance of flooding over 30 yrs
- 0.0%
- Est. flood insurance / yr
- $507 – $1,088
Fire risk 1/10 · Minimal
- Est. fire insurance / yr
- $610 – $1,132
Heat risk 9/10 · Severe
- Hot days now (above 112°F)
- 7 days/yr
- Hot days in 30 yrs
- 18 days/yr
Wind risk 1/10 · Minimal
- Chance of severe wind over 30 yrs
- —
Air-quality risk 2/10 · Minimal
- Unhealthy air days now
- 0 days/yr
- Unhealthy air days in 30 yrs
- 1 days/yr
Risk factors via First Street. Map © Google.
Why this score? — see what drove the B- grade
The composite is a weighted blend of 9 inputs, each scored 0–100. Each bar is that input's sub-score; the figure is the points it added to the 100-point composite (weight × sub-score).
- Cash flow +30.0/30.0
- 1% rule +10.0/10.0
- DSCR +10.0/10.0
- ARV discount +7.5/15.0
- Livability +3.8/5.0
- Condition / age +3.8/5.0
- Schools +2.3/10.0
- Rent growth +1.8/5.0
- Appreciation +0.0/10.0
$80,000
🖨 Deal sheet (PDF) 📄 Offer letter ✓ Due diligence
Listing remarks
Beautifull Home in the Flamingo Mobile Home Community - a welcoming 4-bedroom, 2-bath residence! Step inside to find a spacious open layout featuring a bright living and dining area with stylish wood-look flooring and a clean, neutral color scheme that suits any décor. The kitchen stands out with abundant cabinet space, sleek granite countertops, a beautiful mosaic tile backsplash, recessed lighting, and stainless-steel appliances ready for your culinary adventures. Each bedroom offers generous closet space, ensuring comfort and convenience for the whole family. Additional highlights include a covered carport and access to the community pool, ideal for relaxing and cooling off during
Key facts
- Parking
- Community pool
- Built 1979
Property features AI
Finance
- HOA & community: Land lease community; Land lease payment of $800 monthly; Community pool and spa; Coin-operated laundry onsite; Biking/walking paths; Near bus stop
Exterior
- Parking: Covered parking for 1 vehicle; 1-car carport; Gated parking
- Utilities: City water; Public sewer
- Home design: Manufactured/mobile home; Leasehold ownership
- Construction: Wood siding and wood frame construction; Painted exterior
- Exterior features: Dirt front and back yard; Wrought iron and wood fencing; Metal roof
Interior
- Kitchen: Pantry; Garbage disposal; Granite counters
- Bedrooms: Up to 4 possible bedrooms
- Flooring: Vinyl flooring
- Bathrooms: 2 full bathrooms
- Heating & cooling: Mini-split heating; Electric heating; Ceiling heating; Ceiling fans for cooling
- Interior features: High-speed internet; Granite counters; No interior steps; Pantry; Full bathroom in primary bedroom; Dual-pane windows; Disposal
- Laundry & utility: Indoor laundry with washer/dryer hookup only
Neighborhood map
What this means for you Summary
Snapshot
- This is a 4-bed/2.0-bath manufactured listed at $80k. Condition is rated good.
Deal economics
- At list price, monthly cash flow is $838 ($10k/yr) — positive.
- The deal already cash-flows at list — no discount required.
- Meets the 1% rule at list price ($2k rent vs $80k).
- Recommended offer: $75k (6.0% below list) — sets the bar for market timing.
- Cap rate 18.9% vs local median 3.5% in Glendale — top-decile yield for the area; either an underpriced asset or a hidden risk that comps aren't pricing in. Stress-test before assuming the spread holds.
Location & tenants
- Location reads 76/100 on livability (#12 in AZ, #3,235 nationally) — a middle-class / working-renter tenant base. Strengths: commute A+, housing A+, amenities B; Watch: health & safety D+, crime F.
- Glendale Union High School District (4285) (urban): math 23% / reading 31% proficiency, ranked #130 of 249 in AZ (top 52%) — low school quality limits family demand, transient renter base, plan for 1-2y turnover.
- Zoned schools: Apollo High School (math 26% / reading 30%, grade F, #136 of 381 statewide, top 36%, 2,198 students, 57% FRL).
- Market conditions: Rents soft (-3.0%/yr); 220 active listings in the ZIP; 32 comparable units currently listed for rent nearby; rentals leasing fast (median 3d on market — plan ~1-2 weeks tenant-placement turnaround); 36,011 units permitted in Maricopa County in 2024 (12,801 in 5+ unit buildings).
- This rent runs 39% of the median local income ($54k/yr) — at the standard rent-burdened threshold; future hikes will face affordability resistance.
Forward outlook
- Local home prices are declining (-3.0%/yr); year-one equity from $553 of loan paydown is wiped out by about $2k of value loss. Plan a longer hold.
- Maricopa County population projected at +38% by 2050 — long-run rental-demand tailwind backs the buy-and-hold thesis.
- At projected returns (-3.0% appreciation + 0.0% rent growth), your $22k cash investment doubles in ~3 years — after that, you're playing with house money.
Negotiation context
- It's been on market 68 days — a 6% lower offer ($75k) is reasonable based on typical stale-listing flexibility.
- 3 sale attempts with the ask held roughly flat each time — persistent listings suggest the price (not the market) is what's stuck; bring a comps-based counter.
Risks & watch-outs
- Climate carrying-cost: extreme-heat days projected 7→18/yr by 2055 (HVAC capex compounding) — expect insurance premiums to compound above CPI over the hold.
Questions for the listing agent
- It's been on market 68 days. Have you received any prior offers? Is the seller open to a 6% concession, seller financing, or rate buy-down credit?
- Built in 1979 — when were the roof, HVAC, electrical panel, plumbing, and water heater last replaced?
- Why hasn't it sold? Are there any deal-killer items the seller is aware of (foundation, flood, title, zoning, code violations)?
- Is there a deadline driving the sale (1031 exchange, divorce, estate, relocation)? That informs how much negotiation room exists.
- Crime grade is F in this area — have there been break-ins, vandalism, or insurance claims at this property in the last 3 years? What carrier currently insures it and at what premium?
- What's the average days-on-market for RENTAL listings here right now (not sales)? A rising rental-DOM trend means longer vacancies and softer asking-rent achievability than the comps imply.
- What's the recent tenant-quality profile in this submarket — average credit score on applications, eviction rate, late-payment / NSF rate, and stable-employment percentage? A property-management company in the area should have these aggregated.
- How much new for-sale + rental construction is in the pipeline within 1–3 miles? Heavy new supply typically softens prices + rents 12–24 months out; constrained supply supports both.
Investment metrics
- 1% rule
- 2.20% ✓
- Cap rate
- 18.86%
- Cash-on-cash
- 44.89%
- DSCR
- 3.00
- GRM
- 3.8
CMA / ARV
No comps found within radius.
Projected returns pro-forma
-3.0% appreciation · 0.0% rent growth · sell at horizon
- IRR
- 38.5%
- Equity multiple
- 2.57×
- Total profit
- $35,277
- Equity at exit
- $11,928
- IRR
- 43.5%
- Equity multiple
- 4.55×
- Total profit
- $79,614
- Equity at exit
- $6,917
Cash invested: $22,400 (down + closing). Projections, not guarantees.
Landlord ↔ Tenant lean methodology
- Overall (STATE)
- 87 Strongly Landlord-Friendly
- State Arizona
- 87 Strongly Landlord-Friendly · R+3
- County
- — inherits STATE
- City
- — inherits STATE
ZIP-level market 85301
- Home prices YoY
- -10.6%
- Rents YoY
- -3.0%
- Active inventory
- 220
- Price-to-rent
- 3.8×
Monthly cashflow live
- Estimated rent
- $1,761 high interval (Pro) →
- Mortgage (P&I)
- −$420
- Tax est. 1.5%
- −$100 /mo · $1,200/yr
- Insurance
- −$33
- HOA
- −$0
- Vacancy / Maint / Mgmt
- −$370
- Net cashflow
- $838
Break-even live
Sensitivity live
| Price | -10% $893 | -5% $866 | +0% $838 | +5% $810 | +10% $783 |
|---|---|---|---|---|---|
| Rent | -10% $699 | -5% $768 | +0% $838 | +5% $908 | +10% $977 |
| Rate | -1.0pp $878 | -0.5pp $858 | base $838 | +0.5pp $817 | +1.0pp $796 |
UW: 25.0% down · 7.5% · 30yr · 1.5% tax · 5.0% vac · 8.0% maint · 8.0% mgmt
Financing live
Cash to close
- Down payment
- $20,000
- Closing costs
- $2,400
- Reserves months
- —
- Total cash needed
- —
Loan-product check · same deal, 3 products live
Conventional
25% down · 7.5% · 30yr
- Down + closing
- —
- Monthly P&I
- —
- Monthly cashflow
- —
- DSCR
- —
- Eligible?
- —
Personal DTI + credit; lowest rate.
DSCR
20% down · 8.5% · 30yr
- Down + closing
- —
- Monthly P&I
- —
- Monthly cashflow
- —
- DSCR
- —
- Eligible?
- —
No personal income docs; deal must DSCR.
Hard money
10% down · 12.0% · 12mo
- Down + closing
- —
- Monthly P&I
- —
- Monthly cashflow
- —
- DSCR
- —
- Eligible?
- —
Short-term bridge; refi at stabilization.
Rent comps 32 comps
| Address | Beds | Baths | Sqft | Rent | $/sqft | DOM | Units | Dist |
|---|---|---|---|---|---|---|---|---|
| 5720 N 48th Ln Glendale, AZ | 3.0 | 2.0 | 1986 | $1,815 | $0.91 | 2d | 1 | 0.38mi |
| 5044 W Maryland Ave Glendale, AZ | 3.0 | 1.0 | 1065 | $1,295 | $1.22 | 4d | 1 | 0.45mi |
| 6346 N 47th Ave Glendale, AZ | 3.0 | 2.0 | 1150 | $1,495 | $1.30 | 0d | 1 | 0.46mi |
| 6551 N 49th Ave Glendale, AZ | 2.0–3.0 | 2.0 | 1165 | $2,150 | $1.84 | 0d | 6 | 0.53mi |
| 5012 W McLellan Rd Glendale, AZ | 3.0 | 2.0 | 1058 | $1,595 | $1.51 | 19d | 1 | 0.55mi |
| 5047 W Tuckey Ln Glendale, AZ | 3.0 | 2.0 | 1396 | $1,765 | $1.26 | 0d | 1 | 0.59mi |
| 5046 W Tuckey Ln Glendale, AZ | 3.0 | 2.0 | 1321 | $1,400 | $1.06 | 18d | 1 | 0.60mi |
| 5037 W Krall St Glendale, AZ | 4.0 | 2.0 | 1449 | $2,026 | $1.40 | 5d | 1 | 0.64mi |
| 4608 W Maryland Ave Glendale, AZ | 3.0 | 2.0 | 1215 | $1,598 | $1.31 | 3d | 3 | 0.66mi |
| 4608 W Maryland Ave Glendale, AZ | 2.0–3.0 | 2.0–2.5 | 1145 | $1,700 | $1.48 | 0d | 5 | 0.66mi |
| 4608 W Maryland Ave Glendale, AZ | 2.0–3.0 | 2.0 | 1141 | $1,700 | $1.49 | 2d | 4 | 0.66mi |
| 5024 W Krall St Glendale, AZ | 3.0 | 2.0 | 1196 | $1,749 | $1.46 | 0d | 1 | 0.66mi |
| 4562 W Maryland Ave Glendale, AZ | 3.0 | 2.0 | 1230 | $1,798 | $1.46 | 21d | 1 | 0.71mi |
| 5710 N 43rd Dr Glendale, AZ | 3.0 | 2.5 | 1296 | $1,900 | $1.47 | 0d | 1 | 0.90mi |
| 4303 W Solano Dr N Glendale, AZ | 4.0 | 2.5 | 1700 | $1,795 | $1.06 | 2d | 1 | 0.91mi |
| 4251 W Keim Dr Phoenix, AZ | 3.0 | 2.0 | 1522 | $1,750 | $1.15 | 0d | 1 | 0.93mi |
| 5136 W Glenn Dr Glendale, AZ | 2.0–3.0 | 1.5 | 1090 | $1,795 | $1.65 | 0d | 5 | 1.08mi |
| 4102 W Rose Ln Phoenix, AZ | 3.0 | 2.0 | 1889 | $2,200 | $1.16 | 0d | 1 | 1.15mi |
| 6734 N 43rd Ave Glendale, AZ | 4.0 | 2.0 | 1576 | $2,700 | $1.71 | 4d | 1 | 1.16mi |
| 4776 W Via Cynthia Glendale, AZ | 3.0 | 2.0 | 1484 | $2,000 | $1.35 | 2d | 1 | 1.21mi |
| 5819 N 59th Dr Glendale, AZ | 3.0 | 3.0 | 1500 | $2,100 | $1.40 | 4d | 1 | 1.21mi |
| 5631 W Colter St Glendale, AZ | 1.0–3.0 | 1.0–2.0 | 885 | $1,599 | $1.81 | 0d | 5 | 1.21mi |
| 4021 W Berridge Ln Phoenix, AZ | 3.0 | 2.0 | 1522 | $1,545 | $1.02 | 0d | 1 | 1.23mi |
| 4021 W Berridge Ln Phoenix, AZ | 3.0 | 2.0 | 1522 | $1,545 | $1.02 | 2d | 1 | 1.23mi |
| 4443 W Palmaire Ave Glendale, AZ | 2.0–3.0 | 2.0 | 987 | $1,695 | $1.72 | 0d | 1 | 1.26mi |
| 4439 W Palmaire Ave Unit 236 Glendale, AZ | 3.0 | 2.0 | 1101 | $1,695 | $1.54 | 25d | 1 | 1.26mi |
| 4032 W Stella Ln Phoenix, AZ | 4.0 | 2.0 | 1526 | $2,200 | $1.44 | 0d | 1 | 1.26mi |
| 4714 N 49th Dr Phoenix, AZ | 4.0 | 2.0 | 1697 | $2,030 | $1.20 | 2d | 1 | 1.31mi |
| 4132 W Colter St Phoenix, AZ | 3.0 | 2.0 | 1332 | $1,795 | $1.35 | 0d | 1 | 1.32mi |
| 4717 N 47th Dr Phoenix, AZ | 4.0 | 2.0 | 1573 | $1,695 | $1.08 | 19d | 1 | 1.33mi |
| 4127 W Solar Dr Phoenix, AZ | 3.0 | 2.0 | 1097 | $1,749 | $1.59 | 0d | 1 | 1.47mi |
| 4507 W Gardenia Ave Glendale, AZ | 4.0 | 2.0 | 2106 | $1,500 | $0.71 | 0d | 1 | 1.50mi |
Listing history 25 events
-
2026-06-21days on market $80,000 Active 68 DOM
-
2026-06-18days on market $80,000 Active 65 DOM
-
2026-06-17days on market $80,000 Active 64 DOM
-
2026-06-16days on market $80,000 Active 63 DOM
-
2026-06-15days on market $80,000 Active 62 DOM
-
2026-06-13days on market $80,000 Active 60 DOM
-
2026-06-13days on market $80,000 Active 59 DOM
-
2026-06-09days on market $80,000 Active 56 DOM
-
2026-06-08days on market $80,000 Active 55 DOM
-
2026-06-07days on market $80,000 Active 54 DOM
-
2026-06-04days on market $80,000 Active 51 DOM
-
2026-06-03days on market $80,000 Active 50 DOM
-
2026-06-02days on market $80,000 Active 49 DOM
-
2026-06-01days on market $80,000 Active 48 DOM
-
2026-05-31days on market $80,000 Active 47 DOM
-
2026-04-14$80,000 Active
-
2026-04-07historical
-
2025-12-23price $89,999
-
2025-10-08$98,000 Active
-
2025-08-29historical
-
2025-07-09price $98,999
-
2025-06-06price $104,000
-
2025-05-24price $105,000
-
2025-04-23price $109,000
-
2025-04-14$130,000 Active
ⓘ Source: listings_history table (triggers on properties + properties_extension) + one-shot
backfill from property_details.listing_events for pre-trigger history.
Climate risk First Street
- Flood 1/10 Low FEMA zone X (shaded) · 0% chance over 30 yrs
- Wildfire 1/10 Low
- Heat 9/10 Extreme 7 d/yr ≥112°F today · 18 d/yr by 30 yrs out
- Wind 1/10 Low
- Air quality 2/10 Low 0 unhealthy d/yr today · 1 by 30 yrs out
Nearby sold comps map
Loading sold comps map…
Walkable amenities ~0.75 mi
Loading nearby amenities…
Taxation est. · year 1
- Rental income
- $21,127
- − Mortgage interest
- −$4,481
- − Property taxes
- −$1,200
- − Insurance
- −$400
- − Repairs & maintenance
- −$1,690
- − Management
- −$1,690
- − Depreciation
- −$2,327
- Taxable income
- $9,338
- Est. tax owed @ 24.0%
- −$2,241
- After-tax cash flow
- $7,815/yr
For passive investors: Depreciation is non-cash, so a rental often shows a tax loss while cash-flowing — sheltering income. Rental losses are passive: they offset passive income freely, and up to $25,000/yr can offset ordinary (W-2) income if you actively participate and your MAGI is under $100k (phasing out to $0 by $150k); unused losses carry forward. On sale, claimed depreciation is recaptured at up to 25%, and gains may owe capital-gains tax (a 1031 exchange can defer both). Figures are a year-1 estimate at your 24.0% rate — not tax advice; consult a CPA.
Condition & rehab AI · 13 photos
This manufactured home is in good condition with a good condition score of 75. It has a good kitchen, good exterior, and good flooring. The home is move-in ready with minor cosmetic updates needed to enhance its curb appeal and value.
Value-add opportunities
- Both paint exterior — enhances curb appeal and resale value
- Both landscape around carport — improves curb appeal and rental value
Renovation cost estimate screening
Value-add ROI direction
- Both paint exterior — enhances curb appeal and resale value ↑
- Both landscape around carport — improves curb appeal and rental value ↑
ⓘ Cost ranges are severity-bucket heuristics (US national rule-of-thumb). Get contractor quotes + a written scope before underwriting a rehab budget.
Schools (NCES district)
- District
- Glendale Union High School District (4285)
- NCES district ID
- 0403450
- Math proficiency
- 23% ▼ -38.00%
- Reading proficiency
- 31% ▼ -19.00%
- Median HH income
- $40,846
- Composite
- 22.81/100
- National rank
- #8020
- State rank
- #130 of 249 in AZ
Livability — Glendale
- Score
- 76/100
- State rank
- #12
- US rank
- #3235
Category grades
Schools grade is shown separately in the Schools card above.
Census & demographics
- Census place
- Glendale, AZ
- County
- Maricopa County · 4,537,380 people
- City population
- 294,586
- Metro
- Phoenix-Mesa-Chandler, AZ
- Population (ZIP)
- 68,178
- Household income
- $53,827
- Rent vs Own
- Severe rent burden
- 3741.0
Population outlook (Maricopa County) Hauer SSP2
- Today (2025)
- 4,979,203 people
- By 2030
- 5,378,229 · +8.0%
- By 2040
- 6,156,598 · +23.6%
- By 2050
- 6,872,376 · +38.0%
- By 2075
- 8,401,270 · +68.7%
- By 2100
- 9,247,439 · +85.7%
Race, ethnicity, and origin ACS 2023
- Neighborhood character
- Majority Hispanic (63%)
- Race & ethnicity
- Hispanic / Latino 63% Two or more races 37% White 22% Black 8% Asian 2% Native American 2%
- Hispanic origin (detail)
- Mexican 57% Cuban 1%
- Common ancestry
- Slovak 1% Italian 1%
- Foreign-born
- 26% · Canada, Vietnam, Philippines
- Languages at home
- 46% English-only · Spanish 48% Arabic 1% Other Indo-European 1%
Political lean MEDSL · Maricopa
- 2024 margin
- Toss-up / Even · D 47.7% · R 51.2% · Other 1.1%
- 2008→2024 swing
- +7.1pp toward D · 2008: -10.6pp · 2024: -3.5pp
- All cycles
- 2024: R+3.5 2020: D+2.2 2016: R+3.5 2012: R+12.0 2008: R+10.6
Not yet ingested
- Civics
- —
Market trends
- HPI YoY
- ▼ -50.49%
- Current HPI
- 427.3069
- Rent YoY
- ▼ -2.98%
- Metro
- Phoenix-Mesa-Chandler, AZ
- State GDP YoY
- ▲ 4.54%
- F500 in state
- 20
Industry mix (Fortune 500 HQ in AZ)
| Industry | F500 HQs | Revenue |
|---|---|---|
| Technology | 2 | $13B |
|
||
| Mining / Metals | 1 | $23B |
|
||
| Environmental Services | 1 | $16B |
|
||
| Metals / Steel | 1 | $14B |
|
||
| Technology Distribution | 1 | $9B |
|
||
| Homebuilding | 1 | $8B |
|
||
Price history
-38.5% since first listed10 events — show timeline
- 2026-04-14 Listed $80,000 ARMLS
- 2026-04-07 Listing Removed — ARMLS
- 2025-12-23 Price Changed $89,999 ARMLS
- 2025-10-08 Listed $98,000 ARMLS
- 2025-08-29 Listing Removed — ARMLS
- 2025-07-09 Price Changed $98,999 ARMLS
- 2025-06-06 Price Changed $104,000 ARMLS
- 2025-05-24 Price Changed $105,000 ARMLS
- 2025-04-23 Price Changed $109,000 ARMLS
- 2025-04-14 Listed $130,000 ARMLS
Cash-flow waterfall
monthlySold comps — $/sqft
last 12 mo · ≤1 miLoading sold comps…