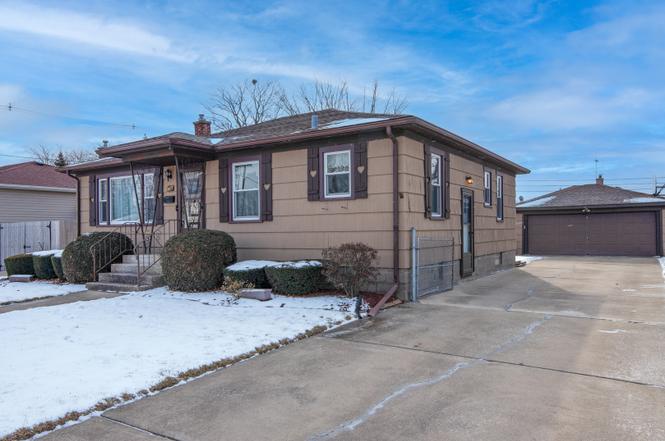
827 E 160th Pl · South Holland, IL
Flood risk 3/10 · Minor
- FEMA flood zone
- X (unshaded)
- Chance of flooding over 30 yrs
- 0.13%
- Est. flood insurance / yr
- $473 – $860
Fire risk 1/10 · Minimal
- Est. fire insurance / yr
- $804 – $1,492
Heat risk 3/10 · Minor
- Hot days now (above 103°F)
- 7 days/yr
- Hot days in 30 yrs
- 15 days/yr
Wind risk 2/10 · Minimal
- Chance of severe wind over 30 yrs
- —
Air-quality risk 4/10 · Minor
- Unhealthy air days now
- 4 days/yr
- Unhealthy air days in 30 yrs
- 5 days/yr
Risk factors via First Street. Map © Google.
Why this score? — see what drove the C grade
The composite is a weighted blend of 9 inputs, each scored 0–100. Each bar is that input's sub-score; the figure is the points it added to the 100-point composite (weight × sub-score).
- Cash flow +30.0/30.0
- DSCR +10.0/10.0
- 1% rule +9.4/10.0
- Livability +3.9/5.0
- Rent growth +2.5/5.0
- Condition / age +2.5/5.0
- Schools +0.7/10.0
- ARV discount +0.1/15.0
- Appreciation +0.0/10.0
$209,900
🖨 Deal sheet 📄 Offer letter ✓ Due diligence
Listing remarks
Welcome home to this spacious ranch with a finished basement, offering around 2,000 square feet of versatile living space and major updates that provide ultimate peace of mind. The expensive updates that could be missed at quick glance are a new furnace (2019), new Air Conditioner (2019), new tear off roof and gutters on the house (2019), new garage roof (2018), and new windows (2018)!! The heart of the home features a large, sun-filled living room that flows seamlessly into the open-concept kitchen and dining area-perfect for hosting dinner parties while staying connected with guests. The kitchen comes fully equipped with the appliances included. This level also hosts three comfortable be
Key facts
- New furnace
- New garage roof
- New air conditioner
Tags
Property features AI
Finance
- HOA & community: No master association fee required; Community features include park, sidewalks, street lights, and paved streets
Exterior
- Parking: Detached garage with garage door opener; Approximately 2.5 garage/total parking spaces
- Utilities: Water source: Lake Michigan; Public sewer
- Home design: Detached single-family home; One-story design; Fee simple ownership; Built approximately 61–70 years ago; Faces unspecified direction
- Construction: Cedar siding; Asphalt roof; Block and brick/mortar foundation; Built before 1978
- Exterior features: Patio; Porch; Fenced yard; Landscaped lot; School bus service, commuter bus, interstate access
Interior
- Kitchen: Kitchen on main level (16 x 12)
- Bedrooms: 3 bedrooms (1 additional possible); One bedroom located below grade (basement); Master bedroom on main level (15 x 12); Bedroom on main level (12 x 9); Bedroom on main level (11 x 8); Basement bedroom (11 x 10)
- Flooring: Laminate flooring
- Bathrooms: 2 full bathrooms; Basement bathroom(s) present
- Heating & cooling: Natural gas heating with forced air; Central air conditioning
- Interior features: First-floor bedroom; First-floor full bath; Partially finished, full basement; Unfinished attic; 7 total rooms; Humidifier
- Laundry & utility: Basement laundry; Gas dryer hookup; Electric dryer hookup; Laundry chute; Utility sink
Neighborhood map
What this means for you Summary
Snapshot
- This is a 3-bed/1.5-bath single-family listed at $210k.
Deal economics
- At list price, monthly cash flow is $1k ($13k/yr) — positive.
- The deal already cash-flows at list — no discount required.
- Meets the 1% rule at list price ($3k rent vs $210k).
- Recommended offer: $185k (12.0% below list) — sets the bar for market timing.
- Cap rate 12.7% vs local median 8.4% in South Holland — top-decile yield for the area; either an underpriced asset or a hidden risk that comps aren't pricing in. Stress-test before assuming the spread holds.
Location & tenants
- Location reads 77/100 on livability (#167 in IL, #3,071 nationally) — a middle-class / working-renter tenant base. Strengths: commute A+, housing A+, cost of living A; Watch: crime C-, amenities C-, schools D+.
- Thornton Twp Hsd 205 (suburban): math 7% / reading 8% proficiency, ranked #594 of 620 in IL (top 96%) — low school quality limits family demand, transient renter base, plan for 1-2y turnover.
- Market conditions: 135 active listings in the ZIP; 7 comparable units currently listed for rent nearby; rentals leasing fast (median 8d on market — plan ~1-2 weeks tenant-placement turnaround); 6,272 units permitted in Cook County in 2024 (4,658 in 5+ unit buildings).
Forward outlook
- Local home prices are declining (-3.0%/yr); year-one equity from $1k of loan paydown is wiped out by about $6k of value loss. Plan a longer hold.
- At projected returns (-3.0% appreciation + 3.0% rent growth), your $59k cash investment doubles in ~6 years — after that, you're playing with house money.
Negotiation context
- It's been on market 149 days — a 12% lower offer ($185k) is reasonable based on typical stale-listing flexibility.
- 5 sale attempts since 3y ago with the ask held roughly flat each time — persistent listings suggest the price (not the market) is what's stuck; bring a comps-based counter.
Risks & watch-outs
- Watch-outs: built in 1956 — expect roof / HVAC / electrical / plumbing capex.
Questions for the listing agent
- It's been on market 149 days. Have you received any prior offers? Is the seller open to a 12% concession, seller financing, or rate buy-down credit?
- Built in 1956 — when were the roof, HVAC, electrical panel, plumbing, and water heater last replaced?
- Why hasn't it sold? Are there any deal-killer items the seller is aware of (foundation, flood, title, zoning, code violations)?
- Is there a deadline driving the sale (1031 exchange, divorce, estate, relocation)? That informs how much negotiation room exists.
- Schools are D-rated, which usually means shorter tenancies and higher turnover. Who's the typical renter profile here, and what's been the actual vacancy rate?
- What's the average days-on-market for RENTAL listings here right now (not sales)? A rising rental-DOM trend means longer vacancies and softer asking-rent achievability than the comps imply.
- What's the recent tenant-quality profile in this submarket — average credit score on applications, eviction rate, late-payment / NSF rate, and stable-employment percentage? A property-management company in the area should have these aggregated.
- How much new for-sale + rental construction is in the pipeline within 1–3 miles? Heavy new supply typically softens prices + rents 12–24 months out; constrained supply supports both.
Investment metrics
- 1% rule
- 1.44% ✓
- Cap rate
- 12.71%
- Cash-on-cash
- 22.92%
- DSCR
- 2.02
- GRM
- 5.8
CMA / ARV
- ARV (on-the-fly)
- $180,360
- Comps found
- 12
Show comp detail 12 sales within ~0.75 mi
| Address | Dist | Beds/Ba | Sqft | Sold | Price | $/sf | Match |
|---|---|---|---|---|---|---|---|
| 823 E 163rd St | 0.27mi | 3/1.0 | 1,184 (+10%) | 1mo | $197,500 | $167 | 68 |
| 15944 School St | 0.31mi | 2/1.0 (-1) | 1,008 (-7%) | 4mo | $175,000 | $174 | 64 |
| 15722 Woodlawn East Ave | 0.60mi | 3/1.5 | 1,015 (-6%) | 1mo | $101,000 | $100 | 61 |
| 15539 Minerva Ave | 0.71mi | 3/1.5 | 1,050 (-3%) | 2mo | $134,000 | $128 | 61 |
| 16001 Avalon Ave | 0.51mi | 4/2.0 (+1) | 1,136 (+5%) | 1mo | $187,500 | $165 | 60 |
| 944 E 163rd Pl | 0.37mi | 3/2.0 | 1,205 (+12%) | 2mo | $201,000 | $167 | 60 |
| 16645 Cottage Grove Ave | 0.74mi | 3/2.0 | 1,120 (+4%) | 1mo | $211,894 | $189 | 56 |
| 15509 Rose Dr | 0.72mi | 2/1.0 (-1) | 1,100 (+2%) | 0mo | $135,000 | $123 | 56 |
| 15634 Avalon Ave | 0.71mi | 4/1.5 (+1) | 1,029 (-5%) | 1mo | $115,000 | $112 | 53 |
| 15519 Ellis Ave | 0.70mi | 2/2.0 (-1) | 1,024 (-5%) | 4mo | $133,000 | $130 | 48 |
| 16417 Claire Ln | 0.58mi | 3/2.5 | 1,209 (+12%) | 2mo | $254,995 | $211 | 48 |
| 15505 Drexel Ave | 0.71mi | 4/2.0 (+1) | 1,200 (+11%) | 2mo | $205,000 | $171 | 40 |
Match score weights: distance 35% · size 25% · config 20% · recency 20%. Top-matched comps best support the ARV.
Projected returns pro-forma
-3.0% appreciation · 3.0% rent growth · sell at horizon
- IRR
- 15.8%
- Equity multiple
- 1.64×
- Total profit
- $37,428
- Equity at exit
- $31,297
- IRR
- 24.5%
- Equity multiple
- 3.12×
- Total profit
- $124,403
- Equity at exit
- $18,148
Cash invested: $58,772 (down + closing). Projections, not guarantees.
Landlord ↔ Tenant lean methodology
- Overall (STATE)
- 43 Moderately Tenant-Leaning
- State Illinois
- 43 Moderately Tenant-Leaning · D+7
- County
- — inherits STATE
- City
- — inherits STATE
ZIP-level market 60473
- Active inventory
- 135
- Price-to-rent
- 5.8×
Monthly cashflow live
- Estimated rent
- $3,030 high interval (Pro) →
- Mortgage (P&I)
- −$1,101
- Tax from tax record
- −$83 /mo · $996/yr
- Insurance
- −$87
- HOA
- −$0
- Vacancy / Maint / Mgmt
- −$636
- Net cashflow
- $1,123
Break-even live
UW: 25.0% down · 7.5% · 30yr · 1.5% tax · 5.0% vac · 8.0% maint · 8.0% mgmt
Financing live
Cash to close
- Down payment
- $52,475
- Closing costs
- $6,297
- Reserves months
- —
- Total cash needed
- —
Loan-product check · same deal, 3 products live
Conventional
25% down · 7.5% · 30yr
- Down + closing
- —
- Monthly P&I
- —
- Monthly cashflow
- —
- DSCR
- —
- Eligible?
- —
Personal DTI + credit; lowest rate.
DSCR
20% down · 8.5% · 30yr
- Down + closing
- —
- Monthly P&I
- —
- Monthly cashflow
- —
- DSCR
- —
- Eligible?
- —
No personal income docs; deal must DSCR.
Hard money
10% down · 12.0% · 12mo
- Down + closing
- —
- Monthly P&I
- —
- Monthly cashflow
- —
- DSCR
- —
- Eligible?
- —
Short-term bridge; refi at stabilization.
Rent comps 7 comps
| Address | Beds | Baths | Sqft | Rent | $/sqft | DOM | Units | Dist |
|---|---|---|---|---|---|---|---|---|
| 16246 Dobson Ave South Holland, IL | 3.0 | 2.0 | 1250 | $3,170 | $2.54 | 2d | 1 | 0.30mi |
| 16001 Avalon Ave South Holland, IL | 3.0 | 2.0 | 1136 | $3,330 | $2.93 | 6d | 1 | 0.48mi |
| 15509 Park Ln South Holland, IL | 4.0 | 1.5 | 1200 | $3,400 | $2.83 | 7d | 1 | 0.81mi |
| 15509 Park Ln South Holland, IL | 4.0 | 1.5 | 1200 | $3,400 | $2.83 | 24d | 1 | 0.81mi |
| 15231 Hastings Dr Dolton, IL | 4.0 | 1.5 | 1487 | $2,146 | $1.44 | 7d | 1 | 1.12mi |
| 15238 Doctor Martin Luther King Junior Dr Unit 2W Dolton, IL | 2.0 | 1.0 | 800 | $1,500 | $1.88 | 10d | 1 | 1.18mi |
| 14916 Langley Ave Dolton, IL | 3.0 | 1.5 | 1418 | $2,500 | $1.76 | 24d | 1 | 1.45mi |
Listing history 33 events
-
2026-06-18days on market $209,900 Active 149 DOM
-
2026-06-17days on market $209,900 Active 148 DOM
-
2026-06-16days on market $209,900 Active 147 DOM
-
2026-06-15days on market $209,900 Active 146 DOM
-
2026-06-13days on market $209,900 Active 144 DOM
-
2026-06-13days on market $209,900 Active 143 DOM
-
2026-06-09days on market $209,900 Active 140 DOM
-
2026-06-08days on market $209,900 Active 139 DOM
-
2026-06-07days on market $209,900 Active 138 DOM
-
2026-06-04days on market $209,900 Active 135 DOM
-
2026-06-03days on market $209,900 Active 134 DOM
-
2026-06-02days on market $209,900 Active 133 DOM
-
2026-06-01days on market $209,900 Active 132 DOM
-
2026-05-31days on market $209,900 Active 131 DOM
-
2026-05-04price $212,900
-
2026-03-24price $215,800
-
2026-03-02price $217,800
-
2026-02-07price $219,800
-
2026-01-20$219,900 Active
-
2025-09-01historical
-
2025-07-31price
-
2025-02-27Active
-
2024-11-04historical
-
2024-05-08price
-
2024-05-02price
-
2024-05-02price
-
2024-05-02status Active
-
2024-04-18historical Contingent - No Showings
-
2024-04-18price
-
2024-03-04Active
-
2024-02-28historical
-
2023-10-03price
-
2023-08-28Active
ⓘ Source: listings_history table (triggers on properties + properties_extension) + one-shot
backfill from property_details.listing_events for pre-trigger history.
Tax reassessment forecast IL · Partial reset (capped growth)
- Current annual tax
- $996 · $83/mo
- Projected year-2 tax
- $2,880 · $240/mo
- Expected delta
- +$1,884/yr (+$157/mo · 189.2%)
ⓘ Screening estimate from a state-policy table — verify with the county assessor before closing.
Climate risk First Street
- Flood 3/10 Moderate FEMA zone X (unshaded) · 13% chance over 30 yrs
- Wildfire 1/10 Low
- Heat 3/10 Moderate 7 d/yr ≥103°F today · 15 d/yr by 30 yrs out
- Wind 2/10 Low
- Air quality 4/10 Moderate 4 unhealthy d/yr today · 5 by 30 yrs out
Nearby sold comps map
Loading sold comps map…
Walkable amenities ~0.75 mi
Loading nearby amenities…
Taxation est. · year 1
- Rental income
- $36,363
- − Mortgage interest
- −$11,758
- − Property taxes
- −$996
- − Insurance
- −$1,050
- − Repairs & maintenance
- −$2,909
- − Management
- −$2,909
- − Depreciation
- −$6,106
- Taxable income
- $10,635
- Est. tax owed @ 24.0%
- −$2,553
- After-tax cash flow
- $10,920/yr
For passive investors: Depreciation is non-cash, so a rental often shows a tax loss while cash-flowing — sheltering income. Rental losses are passive: they offset passive income freely, and up to $25,000/yr can offset ordinary (W-2) income if you actively participate and your MAGI is under $100k (phasing out to $0 by $150k); unused losses carry forward. On sale, claimed depreciation is recaptured at up to 25%, and gains may owe capital-gains tax (a 1031 exchange can defer both). Figures are a year-1 estimate at your 24.0% rate — not tax advice; consult a CPA.
Schools (NCES district)
- District
- Thornton Twp Hsd 205
- NCES district ID
- 1738970
- Math proficiency
- 7% ▬ 0.00%
- Reading proficiency
- 8% ▼ -2.00%
- Median HH income
- $43,392
- Composite
- 6.92/100
- National rank
- #9976
- State rank
- #594 of 620 in IL
Livability — South Holland
- Score
- 77/100
- State rank
- #167
- US rank
- #3071
Category grades
Schools grade is shown separately in the Schools card above.
Census & demographics
- Census place
- South Holland, IL
- City population
- 21,407
- Population (ZIP)
- 21,407
Population outlook (Cook County) Hauer SSP2
- Today (2025)
- 5,347,519 people
- By 2030
- 5,357,703 · +0.2%
- By 2040
- 5,324,924 · -0.4%
- By 2050
- 5,230,762 · -2.2%
- By 2075
- 4,785,735 · -10.5%
- By 2100
- 4,188,836 · -21.7%
Race, ethnicity, and origin ACS 2023
- Neighborhood character
- Predominantly Black (75%)
- Race & ethnicity
- Black 75% White 10% Hispanic / Latino 10% Two or more races 3% Asian 1%
- Hispanic origin (detail)
- Mexican 9% Puerto Rican 1%
- Common ancestry
- Iranian 3% Romanian 2%
- Foreign-born
- 6% · Canada, China
- Languages at home
- 87% English-only · Spanish 8% Other Asian/Pacific 1% Russian/Polish/Slavic 1%
Political lean MEDSL · Cook
- 2024 margin
- Solid D (+42.0) · D 70.4% · R 28.4% · Other 1.2%
- 2008→2024 swing
- -11.4pp toward R · 2008: 53.4pp · 2024: 42.0pp
- All cycles
- 2024: D+42.0 2020: D+50.3 2016: D+53.0 2012: D+49.4 2008: D+53.4
Not yet ingested
- Civics
- —
Market trends
- HPI YoY
- ▼ -114.36%
- Current HPI
- 201.2479
- Rent YoY
- —
- Metro
- —
- State GDP YoY
- ▲ 1.59%
- F500 in state
- 60
Industry mix (Fortune 500 HQ in IL)
| Industry | F500 HQs | Revenue |
|---|---|---|
| Insurance | 4 | $201B |
|
||
| Consumer Goods | 4 | $87B |
|
||
| Industrial Machinery | 3 | $64B |
|
||
| Healthcare | 2 | $55B |
|
||
| Retail / Pharmacy | 1 | $148B |
|
||
| Agriculture / Food | 1 | $86B |
|
||
Price history
-3.2% since first listed19 events — show timeline
- 2026-05-04 Price Changed $212,900 MRED as Distributed by MLS Grid
- 2026-03-24 Price Changed $215,800 MRED as Distributed by MLS Grid
- 2026-03-02 Price Changed $217,800 MRED as Distributed by MLS Grid
- 2026-02-07 Price Changed $219,800 MRED as Distributed by MLS Grid
- 2026-01-20 Listed $219,900 MRED as Distributed by MLS Grid
- 2025-09-01 Listing Removed — MRED as Distributed by MLS Grid
- 2025-07-31 Price Changed — MRED as Distributed by MLS Grid
- 2025-02-27 Listed — MRED as Distributed by MLS Grid
- 2024-11-04 Listing Removed — MRED as Distributed by MLS Grid
- 2024-05-08 Price Changed — MRED as Distributed by MLS Grid
- 2024-05-02 Price Changed — MRED as Distributed by MLS Grid
- 2024-05-02 Price Changed — MRED as Distributed by MLS Grid
- 2024-05-02 Relisted — MRED as Distributed by MLS Grid
- 2024-04-18 Contingent — MRED as Distributed by MLS Grid
- 2024-04-18 Price Changed — MRED as Distributed by MLS Grid
- 2024-03-04 Listed — MRED as Distributed by MLS Grid
- 2024-02-28 Listing Removed — MRED as Distributed by MLS Grid
- 2023-10-03 Price Changed — MRED as Distributed by MLS Grid
- 2023-08-28 Listed — MRED as Distributed by MLS Grid
Property tax history
-7.6%/yrLatest (2023): $996 · -24.5% YoY. Source: county tax records.
Cash-flow waterfall
monthlySold comps — $/sqft
last 12 mo · ≤1 miLoading sold comps…