 🏗️ New Construction
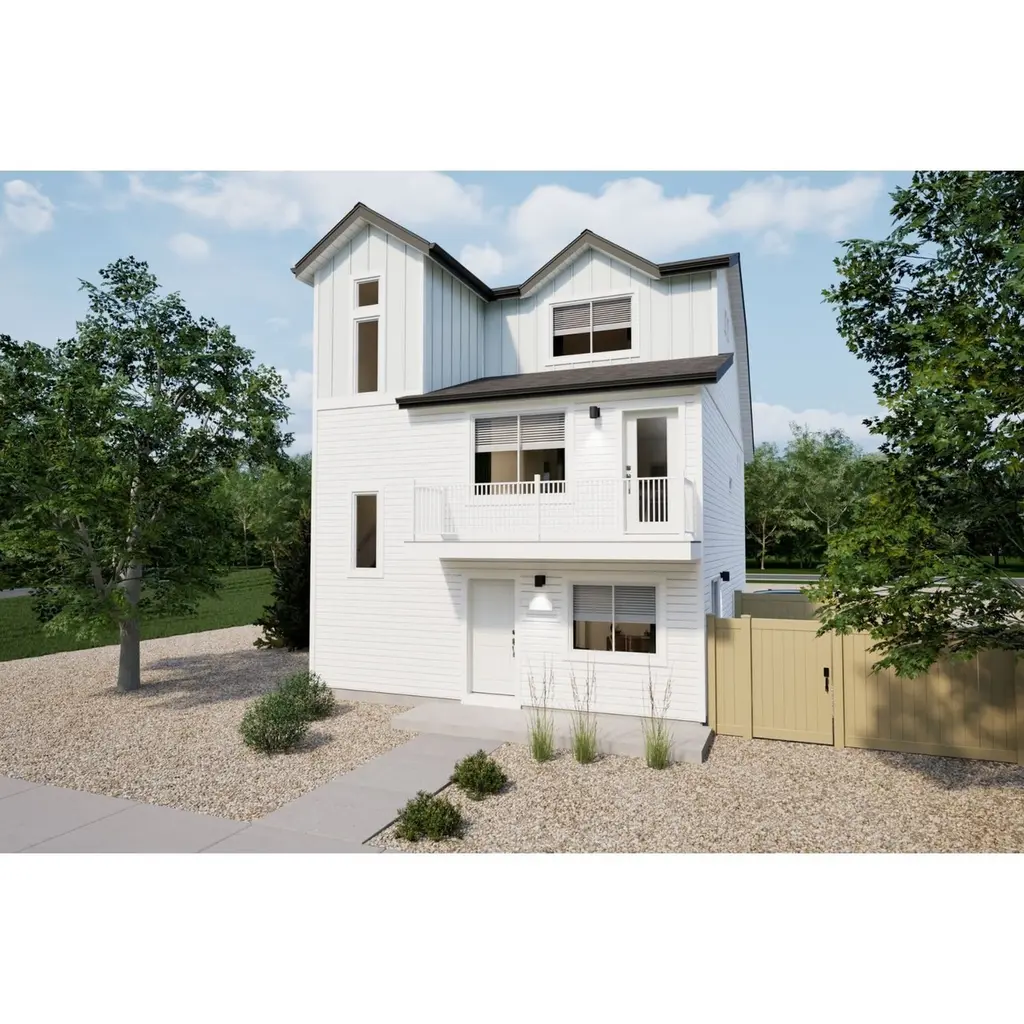
Albright Plan · Bennett, CO
Flood risk 1/10 · Minimal
- FEMA flood zone
- X (unshaded)
- Chance of flooding over 30 yrs
- 0.0%
- Est. flood insurance / yr
- $507 – $1,088
Fire risk 5/10 · Moderate
- Est. fire insurance / yr
- $939 – $1,743
Heat risk 3/10 · Minor
- Hot days now (above 92°F)
- 6 days/yr
- Hot days in 30 yrs
- 16 days/yr
Wind risk 2/10 · Minimal
- Chance of severe wind over 30 yrs
- —
Air-quality risk 2/10 · Minimal
- Unhealthy air days now
- 1 days/yr
- Unhealthy air days in 30 yrs
- 2 days/yr
Risk factors via First Street. Map © Google.
Why this score? — see what drove the D grade
The composite is a weighted blend of 9 inputs, each scored 0–100. Each bar is that input's sub-score; the figure is the points it added to the 100-point composite (weight × sub-score).
- Cash flow +10.0/30.0
- Appreciation +10.0/10.0
- ARV discount +7.5/15.0
- 1% rule +3.2/10.0
- Livability +3.0/5.0
- DSCR +2.9/10.0
- Rent growth +2.5/5.0
- Condition / age +2.5/5.0
- Schools +2.1/10.0
$389,990
🖨 Deal sheet (PDF) 📄 Offer letter ✓ Due diligence
Listing remarks
Welcome home!. This beautiful new home located at Reunion Ridge offers 1,311 total square feet featuring 3 bedrooms, 2.5 bathrooms, and a 2-car garage. The open kitchen provides plenty of storage space to unleash your culinary creativity. The open floor plan seamlessly connects the living room and kitchen, making it ideal for entertaining guests or enjoying quality time with loved ones. The door off the great room goes to a spacious balcony for endless outdoor entertainment. The main floor features a spacious flex room and powder bathroom. Spend your morning enjoying a cup of coffee on the balcony. Contact us today and make this house your new home! Actual home may differ from the artist's
Key facts
- Open green spaces
- Spacious balcony
- Flex room
Tags
Property features AI
Finance
- Other: List price $389,990
- HOA & community: Monthly association fee of $60
Exterior
- Parking: 2 total parking spaces; 2-car garage
- Home design: New construction — Plan home (Albright); Active listing
- Exterior features: Address: 45068 Sunflower Ln, Bennett, CO 80102
Interior
- Bedrooms: 3 bedrooms
- Bathrooms: 2 full bathrooms
- Interior features: Plan home (Albright plan); Living area approximately 1,311
Neighborhood map
What this means for you Summary
Snapshot
- This is a 3-bed/2.0-bath single-family listed at $390k.
Deal economics
- At list price, monthly cash flow is $-218 ($-3k/yr) — negative.
- To cash-flow at today's rent, offer at most $334k (14.3% below list).
- To meet the 1% rule (rent ≥ 1% of price), the offer needs to be $300k (23.1% below list).
- Recommended offer: $300k (23.1% below list) — sets the bar for 1% rule.
Location & tenants
- Location reads 59/100 on livability (#263 in CO) — a working-class tenant base; expect higher turnover. Strengths: housing A+, crime A-; Watch: cost of living D+, schools F, amenities F.
- Bennett School District No. 29J (rural): math 13% / reading 31% proficiency, ranked #69 of 86 in CO (top 80%) — low school quality limits family demand, transient renter base, plan for 1-2y turnover.
- Market conditions: 213 active listings in the ZIP; 1 comparable units currently listed for rent nearby; 2,299 units permitted in Adams County in 2024 (343 in 5+ unit buildings).
Forward outlook
- In year one you build about $39k of equity ($3k loan paydown + $37k appreciation (10.0% local appreciation)).
- Adams County population projected at +44% by 2050 — long-run rental-demand tailwind backs the buy-and-hold thesis.
- By year 2, paydown + projected appreciation supports a ~$63k cash-out refi (75% LTV) — recoverable capital for the next deal without selling this one.
Negotiation context
- Only 6 days on market — expect competitive offers; lowballing is unlikely to land.
Risks & watch-outs
- Climate carrying-cost: moderate wildfire risk — expect insurance premiums to compound above CPI over the hold.
Questions for the listing agent
- What do current leases actually rent for vs. the listed asking? Can we see a recent rent roll and the last 12 months of T-12 income?
- What does the HOA fee cover, when was the last increase, and are there any pending special assessments or reserve-fund shortfalls?
- Is there a deadline driving the sale (1031 exchange, divorce, estate, relocation)? That informs how much negotiation room exists.
- Schools are F-rated, which usually means shorter tenancies and higher turnover. Who's the typical renter profile here, and what's been the actual vacancy rate?
- The area grade is low — what's the realistic commute time and amenity access for the typical tenant pool here? Any planned neighborhood developments (good or bad) we should know about?
- What's the average days-on-market for RENTAL listings here right now (not sales)? A rising rental-DOM trend means longer vacancies and softer asking-rent achievability than the comps imply.
- What's the recent tenant-quality profile in this submarket — average credit score on applications, eviction rate, late-payment / NSF rate, and stable-employment percentage? A property-management company in the area should have these aggregated.
- How much new for-sale + rental construction is in the pipeline within 1–3 miles? Heavy new supply typically softens prices + rents 12–24 months out; constrained supply supports both.
Investment metrics
- 1% rule
- 0.82% ✗
- Cap rate
- 5.58%
- Cash-on-cash
- -2.55%
- DSCR
- 0.89
- GRM
- 10.2
CMA / ARV
- ARV (on-the-fly)
- $365,769
- Comps found
- 12
Show comp detail 12 sales within ~0.75 mi
| Address | Dist | Beds/Ba | Sqft | Sold | Price | $/sf | Match |
|---|---|---|---|---|---|---|---|
| 46514 Avery Ln | 0.08mi | 3/3.0 | 1,311 (0%) | 1mo | $370,000 | $282 | 91 |
| 46534 Avery Ln | 0.08mi | 3/3.0 | 1,311 (0%) | 3mo | $359,990 | $275 | 90 |
| 46577 Sunflower Ln | 0.04mi | 3/3.0 | 1,464 (+12%) | 3mo | $389,999 | $266 | 72 |
| 46585 Sunflower Ln | 0.04mi | 3/3.0 | 1,464 (+12%) | 4mo | $383,490 | $262 | 71 |
| 215 Mckinley Dr | 0.46mi | 3/2.0 | 1,210 (-8%) | 1mo | $355,000 | $293 | 65 |
| 845 Madison Way | 0.54mi | 3/2.0 | 1,380 (+5%) | 4mo | $378,900 | $275 | 62 |
| 704 Madison Way | 0.51mi | 3/2.0 | 1,210 (-8%) | 4mo | $410,000 | $339 | 60 |
| 248 Madison Dr | 0.41mi | 3/2.0 | 1,162 (-11%) | 3mo | $375,000 | $323 | 59 |
| 236 Jefferson Dr | 0.42mi | 3/2.0 | 1,162 (-11%) | 4mo | $379,000 | $326 | 59 |
| 220 Mckinley Dr | 0.45mi | 4/2.0 (+1) | 1,482 (+13%) | 2mo | $325,000 | $219 | 50 |
| 47349 Lily Ave | 0.57mi | 3/2.0 | 1,490 (+14%) | 4mo | $415,000 | $279 | 47 |
| 47385 Lily Ave | 0.64mi | 3/2.0 | 1,490 (+14%) | 4mo | $397,500 | $267 | 44 |
Match score weights: distance 35% · size 25% · config 20% · recency 20%. Top-matched comps best support the ARV.
Projected returns pro-forma
10.0% appreciation · 3.0% rent growth · sell at horizon
- IRR
- 22.5%
- Equity multiple
- 2.81×
- Total profit
- $185,421
- Equity at exit
- $329,514
- IRR
- 20.1%
- Equity multiple
- 6.44×
- Total profit
- $557,104
- Equity at exit
- $710,609
Cash invested: $102,415 (down + closing). Projections, not guarantees.
Landlord ↔ Tenant lean methodology
- Overall (STATE)
- 38 Tenant-Leaning
- State Colorado
- 38 Tenant-Leaning · D+4
- County
- — inherits STATE
- City
- — inherits STATE
ZIP-level market 80102
- Home prices YoY
- 3.1%
- Active inventory
- 213
- Price-to-rent
- 10.8×
Monthly cashflow live
- Estimated rent
- $3,000 medium interval (Pro) →
- Mortgage (P&I)
- −$1,918
- Tax est. 1.5%
- −$457 /mo · $5,487/yr
- Insurance
- −$152
- HOA
- −$60
- Vacancy / Maint / Mgmt
- −$630
- Net cashflow
- $-218
Break-even live
Sensitivity live
| Price | -10% $35 | -5% $-91 | +0% $-218 | +5% $-344 | +10% $-471 |
|---|---|---|---|---|---|
| Rent | -10% $-455 | -5% $-336 | +0% $-218 | +5% $-99 | +10% $19 |
| Rate | -1.0pp $-34 | -0.5pp $-125 | base $-218 | +0.5pp $-313 | +1.0pp $-409 |
UW: 25.0% down · 7.5% · 30yr · 1.5% tax · 5.0% vac · 8.0% maint · 8.0% mgmt
Financing live
Cash to close
- Down payment
- $91,442
- Closing costs
- $10,973
- Reserves months
- —
- Total cash needed
- —
Loan-product check · same deal, 3 products live
Conventional
25% down · 7.5% · 30yr
- Down + closing
- —
- Monthly P&I
- —
- Monthly cashflow
- —
- DSCR
- —
- Eligible?
- —
Personal DTI + credit; lowest rate.
DSCR
20% down · 8.5% · 30yr
- Down + closing
- —
- Monthly P&I
- —
- Monthly cashflow
- —
- DSCR
- —
- Eligible?
- —
No personal income docs; deal must DSCR.
Hard money
10% down · 12.0% · 12mo
- Down + closing
- —
- Monthly P&I
- —
- Monthly cashflow
- —
- DSCR
- —
- Eligible?
- —
Short-term bridge; refi at stabilization.
Rent comps 1 comps
| Address | Beds | Baths | Sqft | Rent | $/sqft | DOM | Units | Dist |
|---|---|---|---|---|---|---|---|---|
| 239 Adams St Bennett, CO | 3.0 | 2.5 | 1653 | $3,000 | $1.81 | 25d | 1 | 0.72mi |
HOA detail
- Monthly dues
- $60 · $720/yr
Listing history 5 events
-
2026-06-21days on market $389,990 Active 6 DOM
-
2026-06-18days on market $389,990 Active 3 DOM
-
2026-06-17days on market $389,990 Active 2 DOM
-
2026-06-15remarks 699-char remark
-
2026-06-15$389,990 Active 1 DOM
ⓘ Source: listings_history table (triggers on properties + properties_extension) + one-shot
backfill from property_details.listing_events for pre-trigger history.
Climate risk First Street
- Flood 1/10 Low FEMA zone X (unshaded) · 0% chance over 30 yrs
- Wildfire 5/10 Major
- Heat 3/10 Moderate 6 d/yr ≥92°F today · 16 d/yr by 30 yrs out
- Wind 2/10 Low
- Air quality 2/10 Low 1 unhealthy d/yr today · 2 by 30 yrs out
Nearby sold comps map
Loading sold comps map…
Walkable amenities ~0.75 mi
Loading nearby amenities…
Taxation est. · year 1
- Rental income
- $36,000
- − Mortgage interest
- −$20,489
- − Property taxes
- −$5,487
- − Insurance
- −$1,829
- − Repairs & maintenance
- −$2,880
- − Management
- −$2,880
- − HOA
- −$720
- − Depreciation
- −$10,641
- Taxable loss
- −$8,925
- Est. tax savings @ 24.0%
- +$2,142
- After-tax cash flow
- $-471/yr
For passive investors: Depreciation is non-cash, so a rental often shows a tax loss while cash-flowing — sheltering income. Rental losses are passive: they offset passive income freely, and up to $25,000/yr can offset ordinary (W-2) income if you actively participate and your MAGI is under $100k (phasing out to $0 by $150k); unused losses carry forward. On sale, claimed depreciation is recaptured at up to 25%, and gains may owe capital-gains tax (a 1031 exchange can defer both). Figures are a year-1 estimate at your 24.0% rate — not tax advice; consult a CPA.
Schools (NCES district)
- District
- Bennett School District No. 29J
- NCES district ID
- 0802430
- Math proficiency
- 13% ▼ -10.00%
- Reading proficiency
- 31% ▼ -9.00%
- Median HH income
- $69,795
- Composite
- 21.39/100
- National rank
- #8353
- State rank
- #69 of 86 in CO
Livability — Bennett
- Score
- 59/100
- State rank
- #263
- US rank
- #19691
Category grades
Schools grade is shown separately in the Schools card above.
Census & demographics
- Census place
- Bennett, CO
- City population
- 5,994
- Population (ZIP)
- 5,994
Population outlook (Adams County) Hauer SSP2
- Today (2025)
- 598,184 people
- By 2030
- 651,880 · +9.0%
- By 2040
- 759,778 · +27.0%
- By 2050
- 862,889 · +44.3%
- By 2075
- 1,085,994 · +81.5%
- By 2100
- 1,211,318 · +102.5%
Race, ethnicity, and origin ACS 2023
- Neighborhood character
- Predominantly White (72%)
- Race & ethnicity
- White 72% Hispanic / Latino 21% Two or more races 11% Black 2%
- Hispanic origin (detail)
- Mexican 17% Puerto Rican 1%
- Common ancestry
- Serbian 4% Italian 3% Lithuanian 2%
- Foreign-born
- 6% · Canada, China
- Languages at home
- 87% English-only · Spanish 10% German/W. Germanic 1% Chinese 1%
Political lean MEDSL · Adams
- 2024 margin
- Lean D (+9.0) · D 53.2% · R 44.1% · Other 2.7%
- 2008→2024 swing
- -9.3pp toward R · 2008: 18.4pp · 2024: 9.0pp
- All cycles
- 2024: D+9.0 2020: D+16.3 2016: D+7.2 2012: D+15.1 2008: D+18.4
Not yet ingested
- Civics
- —
Market trends
- HPI YoY
- ▲ 14.94%
- Current HPI
- 494.39
- Rent YoY
- —
- Metro
- —
- State GDP YoY
- ▲ 1.95%
- F500 in state
- 14
Industry mix (Fortune 500 HQ in CO)
| Industry | F500 HQs | Revenue |
|---|---|---|
| Technology Distribution | 1 | $31B |
|
||
| Food / Agriculture | 1 | $18B |
|
||
| Packaging | 1 | $14B |
|
||
| Healthcare | 1 | $13B |
|
||
| Energy | 1 | $10B |
|
||
| Technology | 1 | $4B |
|
||
Cash-flow waterfall
monthlySold comps — $/sqft
last 12 mo · ≤1 miLoading sold comps…