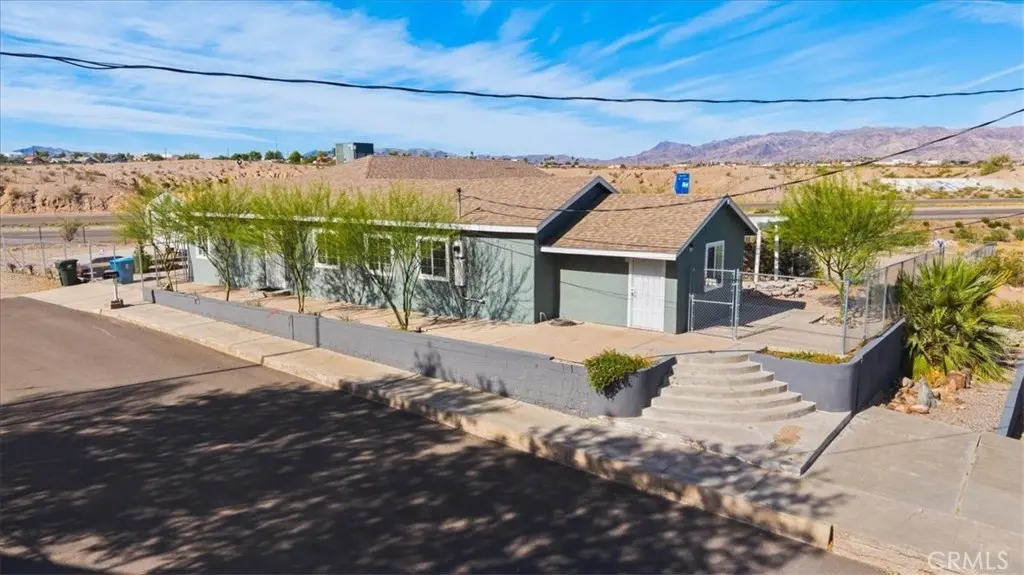
801 Valley Ave · Needles, CA
Flood risk 1/10 · Minimal
- FEMA flood zone
- X (unshaded)
- Chance of flooding over 30 yrs
- 0.0%
- Est. flood insurance / yr
- $507 – $1,088
Fire risk 5/10 · Moderate
- Est. fire insurance / yr
- $659 – $1,223
Heat risk 9/10 · Severe
- Hot days now (above 116°F)
- 7 days/yr
- Hot days in 30 yrs
- 16 days/yr
Wind risk 1/10 · Minimal
- Chance of severe wind over 30 yrs
- —
Air-quality risk 1/10 · Minimal
- Unhealthy air days now
- 0 days/yr
- Unhealthy air days in 30 yrs
- 0 days/yr
Risk factors via First Street. Map © Google.
Why this score? — see what drove the F grade
The composite is a weighted blend of 9 inputs, each scored 0–100. Each bar is that input's sub-score; the figure is the points it added to the 100-point composite (weight × sub-score).
- ARV discount +7.5/15.0
- Appreciation +5.8/10.0
- Livability +3.1/5.0
- Rent growth +2.5/5.0
- Condition / age +2.5/5.0
- Schools +2.3/10.0
- Cash flow +0.9/30.0
- 1% rule +0.0/10.0
- DSCR +0.0/10.0
$325,000
🖨 Deal sheet (PDF) 📄 Offer letter ✓ Due diligence
Listing remarks
A truly distinctive multi-parcel estate offering scale, flexibility, and architectural character rarely found at this price point. Set on approximately 1.46 acres across three separate parcels, this one-of-a-kind property delivers a unique blend of residential living and expansive utility—ideal for multi-generational living, creative use, or those seeking space beyond the ordinary. At the heart of the home is a stunning barndominium-style great room, where soaring ceilings, exposed architectural framing, and oversized ceiling fans create a dramatic sense of volume and openness. The space feels both grand and inviting—designed for gathering, entertaining, or reimagining to suit y
Key facts
- Industrial character
- Multi parcel estate
- 1.46 acre lot
Tags
Property features AI
Finance
- Other: Lot is a corner parcel and part of additional parcels; Lot described as over 40,000 sq ft (0-1 unit/acre)
- HOA & community: Rural community
Exterior
- Parking: Four garage spaces; Six uncovered parking spaces; Total of ten parking spaces; Garage plus additional/other parking (see remarks)
- Utilities: Public sewer; District/public water
- Home design: Single-story house; Updated/remodeled condition; No attached units or common walls; Property has a view; Entry level: 1 (front entry)
- Construction: House structure; Updated/remodeled
- Exterior features: Open patio; Patio present; No pool
Interior
- Kitchen: Family-style kitchen with dining ell
- Bedrooms: Five bedrooms on the main level; All bedrooms located on the lower/main floor; Main floor primary bedroom
- Bathrooms: One full bathroom; One 3/4 bathroom; Bathrooms with tub-shower and separate shower
- Heating & cooling: Central cooling (see remarks)
- Interior features: Beamed ceilings; Front entry
- Laundry & utility: Dedicated laundry room
Neighborhood map
What this means for you Summary
Snapshot
- This is a 1-bed/1.0-bath other listed at $325k.
Deal economics
- At list price, monthly cash flow is $-1k ($-16k/yr) — negative.
- To cash-flow at today's rent, offer at most $129k (60.4% below list).
- To meet the 1% rule (rent ≥ 1% of price), the offer needs to be $112k (65.4% below list).
- Recommended offer: $112k (65.4% below list) — sets the bar for 1% rule.
- Cap rate 1.3% vs local median 5.3% in Needles — below-typical yield; the buyer is paying a premium for something (appreciation thesis, condition, location) that the cap rate doesn't capture.
Location & tenants
- Location reads 62/100 on livability (#492 in CA) — a middle-class / working-renter tenant base. Strengths: commute A+, cost of living A+, housing A+; Watch: health & safety C-, crime F, amenities F.
- Needles Unified (town): math 22% / reading 28% proficiency, ranked #1,194 of 1,400 in CA (top 85%) — low school quality limits family demand, transient renter base, plan for 1-2y turnover; 68% free/reduced lunch — lower-income household profile, screen leases tightly.
- Zoned schools: Needles Middle (math 12% / reading 27%, grade F, #419 of 498 statewide, top 85%, 192 students, 80% FRL).
- Market conditions: 161 active listings in the ZIP; 3 comparable units currently listed for rent nearby; rentals lingering (median 46d on market — plan ~5-8 weeks vacancy on turnover, expect pricing pressure); 67% of comp listings sitting > 30 days — soft ceiling on asking rent; 5,458 units permitted in San Bernardino County in 2024 (1,500 in 5+ unit buildings).
Forward outlook
- In year one you build about $8k of equity ($2k loan paydown + $5k appreciation (1.6% local appreciation)).
- San Bernardino County population projected at +15% by 2050 — modest demand growth; plan on rents tracking national, not racing it.
- By year 5, paydown + projected appreciation supports a ~$34k cash-out refi (75% LTV) — recoverable capital for the next deal without selling this one.
Negotiation context
- It's been on market 54 days — a 3% lower offer ($315k) is reasonable based on typical stale-listing flexibility.
- 2 sale attempts since 2y ago with the ask held roughly flat each time — persistent listings suggest the price (not the market) is what's stuck; bring a comps-based counter.
- Current owner paid $80k; list at $325k implies a 306% gain — meaningful room to come down on a strong offer.
Risks & watch-outs
- Watch-outs: built in 1954 — expect roof / HVAC / electrical / plumbing capex.
- Climate carrying-cost: moderate wildfire risk; extreme-heat days projected 7→16/yr by 2055 (HVAC capex compounding) — expect insurance premiums to compound above CPI over the hold.
Questions for the listing agent
- What do current leases actually rent for vs. the listed asking? Can we see a recent rent roll and the last 12 months of T-12 income?
- It's been on market 54 days. Have you received any prior offers? Is the seller open to a 65% concession, seller financing, or rate buy-down credit?
- Built in 1954 — when were the roof, HVAC, electrical panel, plumbing, and water heater last replaced?
- Is there a deadline driving the sale (1031 exchange, divorce, estate, relocation)? That informs how much negotiation room exists.
- Schools are D-rated, which usually means shorter tenancies and higher turnover. Who's the typical renter profile here, and what's been the actual vacancy rate?
- Crime grade is F in this area — have there been break-ins, vandalism, or insurance claims at this property in the last 3 years? What carrier currently insures it and at what premium?
- The area grade is low — what's the realistic commute time and amenity access for the typical tenant pool here? Any planned neighborhood developments (good or bad) we should know about?
- What's the average days-on-market for RENTAL listings here right now (not sales)? A rising rental-DOM trend means longer vacancies and softer asking-rent achievability than the comps imply.
- What's the recent tenant-quality profile in this submarket — average credit score on applications, eviction rate, late-payment / NSF rate, and stable-employment percentage? A property-management company in the area should have these aggregated.
- How much new for-sale + rental construction is in the pipeline within 1–3 miles? Heavy new supply typically softens prices + rents 12–24 months out; constrained supply supports both.
Investment metrics
- 1% rule
- 0.35% ✗
- Cap rate
- 1.28%
- Cash-on-cash
- -17.90%
- DSCR
- 0.20
- GRM
- 24.1
CMA / ARV
- ARV (median comp)
- $755,276
- List price
- $325,000
- Delta
- -56.97%
- Verdict
- UNDERPRICED
- Comps
- 2 within 1.0 mi
Projected returns pro-forma
1.64% appreciation · 3.0% rent growth · sell at horizon
- IRR
- -14.6%
- Equity multiple
- 0.23×
- Total profit
- $-69,993
- Equity at exit
- $121,985
- IRR
- -8.0%
- Equity multiple
- -0.08×
- Total profit
- $-98,057
- Equity at exit
- $171,013
Cash invested: $91,000 (down + closing). Projections, not guarantees.
Landlord ↔ Tenant lean methodology
- Overall (STATE)
- 18 Strongly Tenant-Friendly
- State California
- 18 Strongly Tenant-Friendly · D+13
- County
- — inherits STATE
- City
- — inherits STATE
ZIP-level market 92363
- Home prices YoY
- 0.6%
- Active inventory
- 161
- Price-to-rent
- 24.1×
Monthly cashflow live
- Estimated rent
- $1,125 medium interval (Pro) →
- Mortgage (P&I)
- −$1,704
- Tax est. 1.5%
- −$406 /mo · $4,875/yr
- Insurance
- −$135
- HOA
- −$0
- Vacancy / Maint / Mgmt
- −$236
- Net cashflow
- $-1,358
Break-even live
Sensitivity live
| Price | -10% $-1,133 | -5% $-1,245 | +0% $-1,358 | +5% $-1,470 | +10% $-1,582 |
|---|---|---|---|---|---|
| Rent | -10% $-1,446 | -5% $-1,402 | +0% $-1,358 | +5% $-1,313 | +10% $-1,269 |
| Rate | -1.0pp $-1,194 | -0.5pp $-1,275 | base $-1,358 | +0.5pp $-1,442 | +1.0pp $-1,527 |
UW: 25.0% down · 7.5% · 30yr · 1.5% tax · 5.0% vac · 8.0% maint · 8.0% mgmt
Financing live
Cash to close
- Down payment
- $81,250
- Closing costs
- $9,750
- Reserves months
- —
- Total cash needed
- —
Loan-product check · same deal, 3 products live
Conventional
25% down · 7.5% · 30yr
- Down + closing
- —
- Monthly P&I
- —
- Monthly cashflow
- —
- DSCR
- —
- Eligible?
- —
Personal DTI + credit; lowest rate.
DSCR
20% down · 8.5% · 30yr
- Down + closing
- —
- Monthly P&I
- —
- Monthly cashflow
- —
- DSCR
- —
- Eligible?
- —
No personal income docs; deal must DSCR.
Hard money
10% down · 12.0% · 12mo
- Down + closing
- —
- Monthly P&I
- —
- Monthly cashflow
- —
- DSCR
- —
- Eligible?
- —
Short-term bridge; refi at stabilization.
Rent comps 3 comps
| Address | Beds | Baths | Sqft | Rent | $/sqft | DOM | Units | Dist |
|---|---|---|---|---|---|---|---|---|
| 412 D St Needles, CA | 2.0 | 1.0 | 1096 | $1,200 | $1.09 | 15d | 1 | 0.13mi |
| 110 S L St Needles, CA | 2.0 | 1.0 | 700 | $800 | $1.14 | 45d | 1 | 0.69mi |
| 214 Spruce St Needles, CA | 1.0 | 1.0 | 542 | $1,100 | $2.03 | 45d | 1 | 0.87mi |
Listing history 22 events
-
2026-06-22days on market $325,000 Active 54 DOM
-
2026-06-19days on market $325,000 Active 52 DOM
-
2026-06-18days on market $325,000 Active 51 DOM
-
2026-06-17days on market $325,000 Active 50 DOM
-
2026-06-16days on market $325,000 Active 49 DOM
-
2026-06-15days on market $325,000 Active 48 DOM
-
2026-06-14days on market $325,000 Active 46 DOM
-
2026-06-13days on market $325,000 Active 45 DOM
-
2026-06-10days on market $325,000 Active 43 DOM
-
2026-06-09days on market $325,000 Active 42 DOM
-
2026-06-08days on market $325,000 Active 41 DOM
-
2026-06-07days on market $325,000 Active 40 DOM
-
2026-06-05days on market $325,000 Active 37 DOM
-
2026-06-02days on market $325,000 Active 35 DOM
-
2026-06-01days on market $325,000 Active 34 DOM
-
2026-05-31days on market $325,000 Active 33 DOM
-
2026-05-30days on market $325,000 Active 32 DOM
-
2026-04-28$325,000 Active 2096-char remark
-
2025-04-14historical
-
2024-11-17$450,000 Active
-
2008-06-19soldstatus $80,000
-
1991-01-23soldstatus $100,000
ⓘ Source: listings_history table (triggers on properties + properties_extension) + one-shot
backfill from property_details.listing_events for pre-trigger history.
Climate risk First Street
- Flood 1/10 Low FEMA zone X (unshaded) · 0% chance over 30 yrs
- Wildfire 5/10 Major
- Heat 9/10 Extreme 7 d/yr ≥116°F today · 16 d/yr by 30 yrs out
- Wind 1/10 Low
- Air quality 1/10 Low 0 unhealthy d/yr today · 0 by 30 yrs out
Nearby sold comps map
Loading sold comps map…
Walkable amenities ~0.75 mi
Loading nearby amenities…
Taxation est. · year 1
- Rental income
- $13,496
- − Mortgage interest
- −$18,205
- − Property taxes
- −$4,875
- − Insurance
- −$1,625
- − Repairs & maintenance
- −$1,080
- − Management
- −$1,080
- − Depreciation
- −$9,455
- Taxable loss
- −$22,823
- Est. tax savings @ 24.0%
- +$5,478
- After-tax cash flow
- $-10,813/yr
For passive investors: Depreciation is non-cash, so a rental often shows a tax loss while cash-flowing — sheltering income. Rental losses are passive: they offset passive income freely, and up to $25,000/yr can offset ordinary (W-2) income if you actively participate and your MAGI is under $100k (phasing out to $0 by $150k); unused losses carry forward. On sale, claimed depreciation is recaptured at up to 25%, and gains may owe capital-gains tax (a 1031 exchange can defer both). Figures are a year-1 estimate at your 24.0% rate — not tax advice; consult a CPA.
Schools (NCES district)
- District
- Needles Unified
- NCES district ID
- 0626760
- Math proficiency
- 22% ▼ -2.00%
- Reading proficiency
- 28% ▼ -1.00%
- Median HH income
- $31,795
- Composite
- 23.35/100
- National rank
- #13305
- State rank
- #1194 of 1400 in CA
Livability — Needles
- Score
- 62/100
- State rank
- #492
- US rank
- #16661
Category grades
Schools grade is shown separately in the Schools card above.
Census & demographics
- Census place
- Needles, CA
- Population (ZIP)
- 5,392
Population outlook (San Bernardino County) Hauer SSP2
- Today (2025)
- 2,300,329 people
- By 2030
- 2,378,907 · +3.4%
- By 2040
- 2,523,137 · +9.7%
- By 2050
- 2,642,388 · +14.9%
- By 2075
- 2,880,769 · +25.2%
- By 2100
- 2,909,436 · +26.5%
Race, ethnicity, and origin ACS 2023
- Neighborhood character
- Diverse neighborhood (Simpson 0.63)
- Race & ethnicity
- White 54% Hispanic / Latino 29% Two or more races 16% Native American 11% Black 3%
- Hispanic origin (detail)
- Mexican 24% Puerto Rican 2%
- Common ancestry
- Romanian 3% Iranian 3% Lithuanian 2%
- Foreign-born
- 3% · Canada, China
- Languages at home
- 89% English-only · Spanish 9% Chinese 1%
Political lean MEDSL · San Bernardino
- 2024 margin
- Toss-up / Even · D 47.5% · R 49.7% · Other 2.8%
- 2008→2024 swing
- -8.5pp toward R · 2008: 6.3pp · 2024: -2.1pp
- All cycles
- 2024: R+2.1 2020: D+10.7 2016: D+9.8 2012: D+5.4 2008: D+6.3
Not yet ingested
- Civics
- —
Market trends
- HPI YoY
- ▲ 1.64%
- Current HPI
- 279.7931
- Rent YoY
- —
- Metro
- —
- State GDP YoY
- ▲ 3.21%
- F500 in state
- 116
Industry mix (Fortune 500 HQ in CA)
| Industry | F500 HQs | Revenue |
|---|---|---|
| Technology | 27 | $1,492B |
|
||
| Financial Services | 3 | $174B |
|
||
| Retail | 3 | $44B |
|
||
| Insurance | 3 | $26B |
|
||
| Media / Entertainment | 2 | $115B |
|
||
| Pharmaceuticals / Biotech | 2 | $62B |
|
||
Price history
+225.0% since first listed5 events — show timeline
- 2026-04-28 Listed $325,000 CRMLS
- 2025-04-14 Listing Removed — CRMLS
- 2024-11-17 Listed $450,000 CRMLS
- 2008-06-19 Sold (Public Records) $80,000 Public Records
- 1991-01-23 Sold (Public Records) $100,000 Public Records
Cash-flow waterfall
monthlySold comps — $/sqft
last 12 mo · ≤1 miLoading sold comps…