190 Greenbriar Cir · Holly Springs, MS
Flood risk 1/10 · Minimal
- FEMA flood zone
- X (unshaded)
- Chance of flooding over 30 yrs
- 0.0%
- Est. flood insurance / yr
- $507 – $1,088
Fire risk 4/10 · Minor
- Est. fire insurance / yr
- $1,241 – $2,305
Heat risk 6/10 · Moderate
- Hot days now (above 108°F)
- 7 days/yr
- Hot days in 30 yrs
- 21 days/yr
Wind risk 4/10 · Minor
- Chance of severe wind over 30 yrs
- 21.0%
Air-quality risk 1/10 · Minimal
- Unhealthy air days now
- 0 days/yr
- Unhealthy air days in 30 yrs
- 0 days/yr
Risk factors via First Street. Map © Google.
Why this score? — see what drove the B grade
The composite is a weighted blend of 9 inputs, each scored 0–100. Each bar is that input's sub-score; the figure is the points it added to the 100-point composite (weight × sub-score).
- Cash flow +30.0/30.0
- 1% rule +10.0/10.0
- DSCR +10.0/10.0
- ARV discount +7.5/15.0
- Appreciation +5.0/10.0
- Livability +3.1/5.0
- Rent growth +2.5/5.0
- Condition / age +2.5/5.0
- Schools +1.1/10.0
$70,000
🖨 Deal sheet 📄 Offer letter ✓ Due diligence
Listing remarks
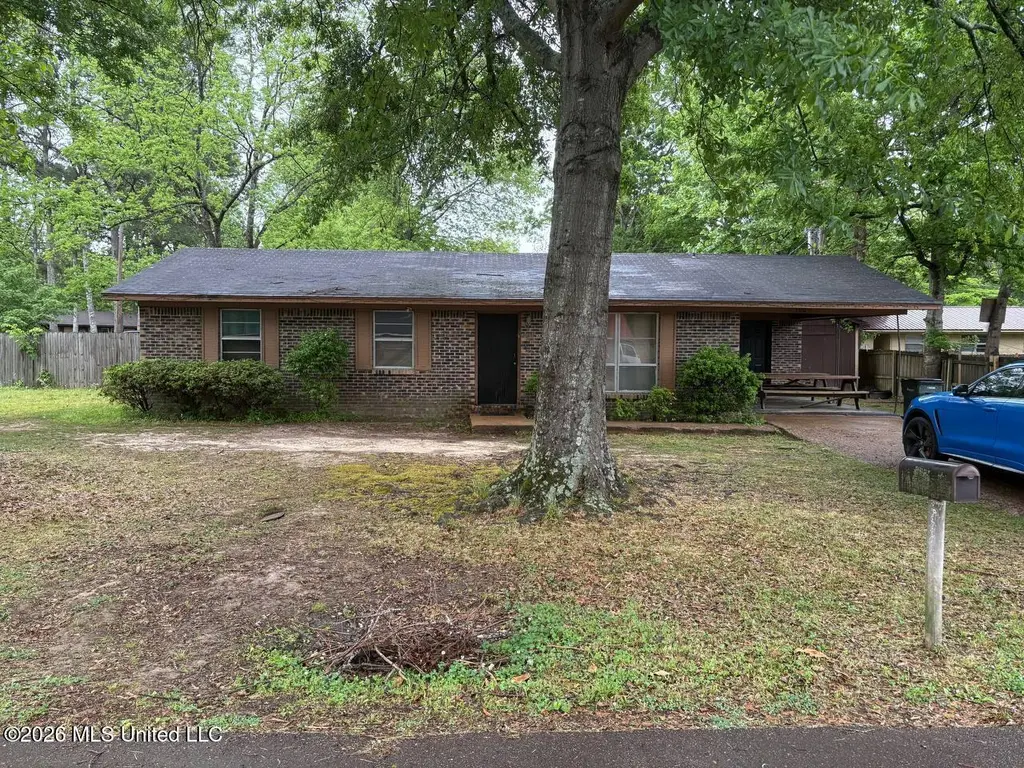
Charming 3-bedroom, 1.5-bath home situated on a spacious 1.88-acre lot in Holly Springs, MS! This property offers the perfect blend of privacy and potential, with plenty of room to enjoy outdoor living, expand, or customize to your needs. Ideal for buyers looking for space and a peaceful setting while still being conveniently located. Great opportunity for a primary residence, rental, or investment property with room to add value. Don't miss your chance to own acreage!
Key facts
- Own acreage
- Peaceful setting
- Outdoor living
Tags
Property features AI
Exterior
- Parking: Attached carport with space for 1 vehicle
- Utilities: Public water; Public sewer; Electricity connected; Natural gas connected
- Home design: Single-family house; One story
- Construction: Brick construction; Slab foundation; Built (year sourced from public records)
- Exterior features: Asphalt shingle roof
Interior
- Kitchen: Cooktop; Oven; Refrigerator
- Bedrooms: At least one bedroom
- Bathrooms: One full bathroom; One half bathroom (1.5 total bathrooms)
- Heating & cooling: Hot water heating; Window unit(s) for cooling
- Interior features: Five total rooms; Includes dining room
- Laundry & utility: Washer/Dryer included
Neighborhood map
What this means for you Summary
Snapshot
- This is a 3-bed/1.0-bath single-family listed at $70k.
Deal economics
- At list price, monthly cash flow is $616 ($7k/yr) — positive.
- The deal already cash-flows at list — no discount required.
- Meets the 1% rule at list price ($1k rent vs $70k).
- Recommended offer: $68k (3.0% below list) — sets the bar for market timing.
- Cap rate 16.9% vs local median 5.4% in Holly Springs — top-decile yield for the area; either an underpriced asset or a hidden risk that comps aren't pricing in. Stress-test before assuming the spread holds.
Location & tenants
- Location reads 62/100 on livability (#178 in MS) — a middle-class / working-renter tenant base. Strengths: cost of living A+, housing A+, crime B; Watch: amenities F, commute F, employment F.
- Holly Springs School District (town): math 12% / reading 15% proficiency, ranked #111 of 130 in MS (top 85%) — low school quality limits family demand, transient renter base, plan for 1-2y turnover; 92% free/reduced lunch — lower-income household profile, screen leases tightly.
- Zoned schools: Holly Springs Primary School (math 12% / reading 12%, grade F, #308 of 375 statewide, top 83%, 358 students, 100% FRL); Holly Springs Junior High School (math 17% / reading 17%, grade F, #125 of 179 statewide, top 70%, 138 students, 100% FRL); Holly Springs High School (math 12% / reading 12%, grade F, #164 of 197 statewide, top 84%, 301 students, 100% FRL).
- Market conditions: 146 active listings in the ZIP; 310 units permitted in Marshall County in 2024 (0 in 5+ unit buildings).
Forward outlook
- In year one you build about $477 of equity ($484 loan paydown + $-7 appreciation (-0.0% local appreciation)).
- Marshall County population projected at -24% by 2050 — secular population decline; favor cash flow + early exit over multi-decade hold.
- At projected returns (-0.0% appreciation + 3.0% rent growth), your $20k cash investment doubles in ~3 years — after that, you're playing with house money.
Negotiation context
- It's been on market 43 days — a 3% lower offer ($68k) is reasonable based on typical stale-listing flexibility.
Risks & watch-outs
- Climate carrying-cost: extreme-heat days projected 7→21/yr by 2055 (HVAC capex compounding) — expect insurance premiums to compound above CPI over the hold.
Questions for the listing agent
- It's been on market 43 days. Have you received any prior offers? Is the seller open to a 3% concession, seller financing, or rate buy-down credit?
- Built in 1972 — when were the roof, HVAC, electrical panel, plumbing, and water heater last replaced?
- Is there a deadline driving the sale (1031 exchange, divorce, estate, relocation)? That informs how much negotiation room exists.
- Schools are F-rated, which usually means shorter tenancies and higher turnover. Who's the typical renter profile here, and what's been the actual vacancy rate?
- What's the average days-on-market for RENTAL listings here right now (not sales)? A rising rental-DOM trend means longer vacancies and softer asking-rent achievability than the comps imply.
- What's the recent tenant-quality profile in this submarket — average credit score on applications, eviction rate, late-payment / NSF rate, and stable-employment percentage? A property-management company in the area should have these aggregated.
- How much new for-sale + rental construction is in the pipeline within 1–3 miles? Heavy new supply typically softens prices + rents 12–24 months out; constrained supply supports both.
Investment metrics
- 1% rule
- 1.97% ✓
- Cap rate
- 16.86%
- Cash-on-cash
- 37.73%
- DSCR
- 2.68
- GRM
- 4.2
CMA / ARV
- ARV (median comp)
- $146,201
- List price
- $70,000
- Delta
- -52.12%
- Verdict
- UNDERPRICED
- Comps
- 20 within 1.0 mi
Show comp detail 10 sales within ~0.75 mi
| Address | Dist | Beds/Ba | Sqft | Sold | Price | $/sf | Match |
|---|---|---|---|---|---|---|---|
| 165 Greenbriar Cir | 0.03mi | 3/1.5 | 1,075 (0%) | 3mo | $80,000 | $74 | 94 |
| 230 Greenbriar Cir | 0.07mi | 3/1.5 | 1,075 (0%) | 6mo | $134,900 | $125 | 90 |
| 360 E College Ave | 0.31mi | 2/1.0 (-1) | 1,085 (+1%) | 17mo | $159,000 | $147 | 65 |
| 395 E Van Dorn Ave | 0.38mi | 2/1.5 (-1) | 1,020 (-5%) | 6mo | $60,000 | $59 | 61 |
| 130 Shadowlane Dr | 0.12mi | 3/1.0 | 920 (-14%) | 14mo | $129,999 | $141 | 59 |
| 665 Salem Ave | 0.73mi | 3/1.0 | 1,128 (+5%) | 1mo | $169,900 | $151 | 57 |
| 645 Cox Ave | 0.58mi | 3/1.5 | 1,025 (-5%) | 16mo | $29,600 | $29 | 50 |
| 155 Martin St | 0.68mi | 2/1.0 (-1) | 1,100 (+2%) | 20mo | $99,000 | $90 | 42 |
| 656 Coleman Ave | 0.66mi | 3/2.0 | 1,200 (+12%) | 6mo | $210,000 | $175 | 41 |
| 287 S Craft St | 0.65mi | 2/1.0 (-1) | 1,175 (+9%) | 14mo | $159,900 | $136 | 38 |
Match score weights: distance 35% · size 25% · config 20% · recency 20%. Top-matched comps best support the ARV.
Projected returns pro-forma
-0.01% appreciation · 3.0% rent growth · sell at horizon
- IRR
- 38.7%
- Equity multiple
- 2.90×
- Total profit
- $37,189
- Equity at exit
- $20,291
- IRR
- 41.8%
- Equity multiple
- 5.70×
- Total profit
- $92,139
- Equity at exit
- $24,363
Cash invested: $19,600 (down + closing). Projections, not guarantees.
Landlord ↔ Tenant lean methodology
- Overall (STATE)
- 90 Strongly Landlord-Friendly
- State Mississippi
- 90 Strongly Landlord-Friendly · R+11
- County
- — inherits STATE
- City
- — inherits STATE
ZIP-level market 38635
- Home prices YoY
- -0.0%
- Active inventory
- 146
- Price-to-rent
- 4.2×
Monthly cashflow live
- Estimated rent
- $1,382 medium interval (Pro) →
- Mortgage (P&I)
- −$367
- Tax from tax record
- −$79 /mo · $951/yr
- Insurance
- −$29
- HOA
- −$0
- Vacancy / Maint / Mgmt
- −$290
- Net cashflow
- $616
Break-even live
UW: 25.0% down · 7.5% · 30yr · 1.5% tax · 5.0% vac · 8.0% maint · 8.0% mgmt
Financing live
Cash to close
- Down payment
- $17,500
- Closing costs
- $2,100
- Reserves months
- —
- Total cash needed
- —
Loan-product check · same deal, 3 products live
Conventional
25% down · 7.5% · 30yr
- Down + closing
- —
- Monthly P&I
- —
- Monthly cashflow
- —
- DSCR
- —
- Eligible?
- —
Personal DTI + credit; lowest rate.
DSCR
20% down · 8.5% · 30yr
- Down + closing
- —
- Monthly P&I
- —
- Monthly cashflow
- —
- DSCR
- —
- Eligible?
- —
No personal income docs; deal must DSCR.
Hard money
10% down · 12.0% · 12mo
- Down + closing
- —
- Monthly P&I
- —
- Monthly cashflow
- —
- DSCR
- —
- Eligible?
- —
Short-term bridge; refi at stabilization.
Listing history 12 events
-
2026-06-13status $70,000 Pending 43 DOM
-
2026-06-12days on market $70,000 Active 43 DOM
-
2026-06-09days on market $70,000 Active 40 DOM
-
2026-06-08days on market $70,000 Active 39 DOM
-
2026-06-07days on market $70,000 Active 38 DOM
-
2026-06-07days on market $70,000 Active 37 DOM
-
2026-06-04days on market $70,000 Active 34 DOM
-
2026-06-02days on market $70,000 Active 33 DOM
-
2026-06-01days on market $70,000 Active 32 DOM
-
2026-05-31days on market $70,000 Active 31 DOM
-
2026-05-31price $70,000 Active 30 DOM
-
2026-04-30$80,000 Active 473-char remark
ⓘ Source: listings_history table (triggers on properties + properties_extension) + one-shot
backfill from property_details.listing_events for pre-trigger history.
Tax reassessment forecast MS · Resets to sale price
- Current annual tax
- $951 · $79/mo
- Projected year-2 tax
- $951 · $79/mo
- Expected delta
- $0/yr ($0/mo · 0.0%)
ⓘ Screening estimate from a state-policy table — verify with the county assessor before closing.
Climate risk First Street
- Flood 1/10 Low FEMA zone X (unshaded) · 0% chance over 30 yrs
- Wildfire 4/10 Moderate
- Heat 6/10 Major 7 d/yr ≥108°F today · 21 d/yr by 30 yrs out
- Wind 4/10 Moderate 21% chance of damaging wind over 30 yrs
- Air quality 1/10 Low 0 unhealthy d/yr today · 0 by 30 yrs out
Nearby sold comps map
Loading sold comps map…
Walkable amenities ~0.75 mi
Loading nearby amenities…
Taxation est. · year 1
- Rental income
- $16,584
- − Mortgage interest
- −$3,921
- − Property taxes
- −$951
- − Insurance
- −$350
- − Repairs & maintenance
- −$1,327
- − Management
- −$1,327
- − Depreciation
- −$2,036
- Taxable income
- $6,673
- Est. tax owed @ 24.0%
- −$1,601
- After-tax cash flow
- $5,794/yr
For passive investors: Depreciation is non-cash, so a rental often shows a tax loss while cash-flowing — sheltering income. Rental losses are passive: they offset passive income freely, and up to $25,000/yr can offset ordinary (W-2) income if you actively participate and your MAGI is under $100k (phasing out to $0 by $150k); unused losses carry forward. On sale, claimed depreciation is recaptured at up to 25%, and gains may owe capital-gains tax (a 1031 exchange can defer both). Figures are a year-1 estimate at your 24.0% rate — not tax advice; consult a CPA.
Schools (NCES district)
- District
- Holly Springs School District
- NCES district ID
- 2801950
- Math proficiency
- 12% ▼ -12.00%
- Reading proficiency
- 15% ▼ -7.00%
- Median HH income
- $33,106
- Composite
- 10.9/100
- National rank
- #9752
- State rank
- #111 of 130 in MS
Livability — Holly Springs
- Score
- 62/100
- State rank
- #178
- US rank
- #16836
Category grades
Schools grade is shown separately in the Schools card above.
Census & demographics
- Census place
- Holly Springs, MS
- Population (ZIP)
- 15,312
Population outlook (Marshall County) Hauer SSP2
- Today (2025)
- 33,542 people
- By 2030
- 31,983 · -4.6%
- By 2040
- 28,556 · -14.9%
- By 2050
- 25,352 · -24.4%
- By 2075
- 20,032 · -40.3%
- By 2100
- 16,738 · -50.1%
Race, ethnicity, and origin ACS 2023
- Neighborhood character
- Majority Black (64%)
- Race & ethnicity
- Black 64% White 29% Two or more races 5%
- Common ancestry
- Serbian 1% English 1%
- Foreign-born
- 3%
- Languages at home
- 97% English-only · Spanish 1%
Political lean MEDSL · Marshall
- 2024 margin
- Lean R (+7.3) · D 46.0% · R 53.2%
- 2008→2024 swing
- -25.5pp toward R · 2008: 18.2pp · 2024: -7.3pp
- All cycles
- 2024: R+7.3 2020: D+3.1 2016: D+9.7 2012: D+19.4 2008: D+18.2
Not yet ingested
- Civics
- —
Market trends
- HPI YoY
- ▬ -0.01%
- Current HPI
- 245.68
- Rent YoY
- —
- Metro
- —
- State GDP YoY
- —
- F500 in state
- 0
Price history
-12.5% since first listed3 events — show timeline
- 2026-06-12 Pending — MLSU
- 2026-05-30 Price Changed $70,000 MLSU
- 2026-04-30 Listed $80,000 MLSU
Property tax history
+1.5%/yrLatest (2025): $951 · +4.3% YoY. Source: county tax records.
Cash-flow waterfall
monthlySold comps — $/sqft
last 12 mo · ≤1 miLoading sold comps…