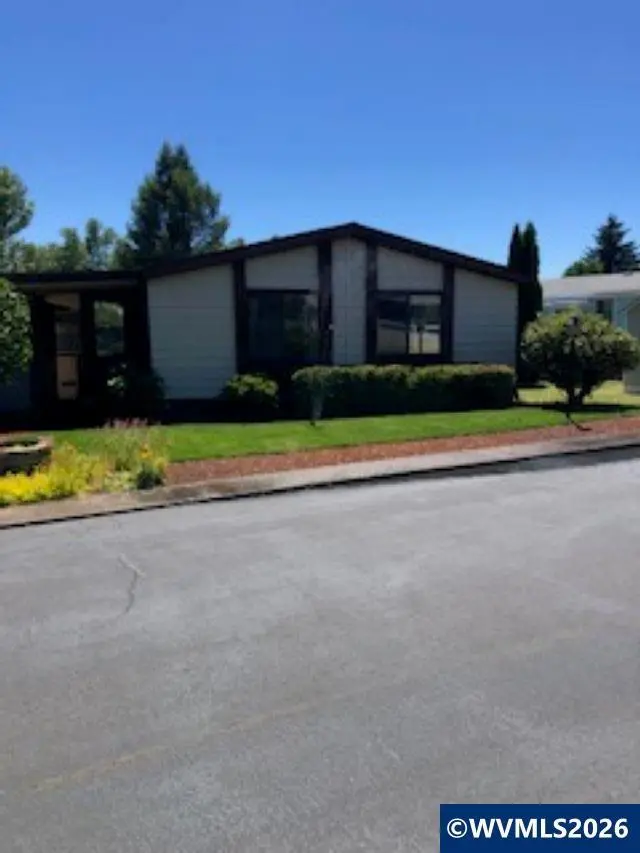
450 SE LaCreole Dr #142 · Dallas, OR
Flood risk 5/10 · Moderate
- FEMA flood zone
- X (unshaded)
- Chance of flooding over 30 yrs
- 0.24%
- Est. flood insurance / yr
- $507 – $1,088
Fire risk 6/10 · Moderate
- Est. fire insurance / yr
- $498 – $926
Heat risk 3/10 · Minor
- Hot days now (above 92°F)
- 7 days/yr
- Hot days in 30 yrs
- 15 days/yr
Wind risk 1/10 · Minimal
- Chance of severe wind over 30 yrs
- —
Air-quality risk 8/10 · Major
- Unhealthy air days now
- 10 days/yr
- Unhealthy air days in 30 yrs
- 10 days/yr
Risk factors via First Street. Map © Google.
Why this score? — see what drove the C+ grade
The composite is a weighted blend of 9 inputs, each scored 0–100. Each bar is that input's sub-score; the figure is the points it added to the 100-point composite (weight × sub-score).
- Cash flow +28.2/30.0
- DSCR +10.0/10.0
- 1% rule +7.8/10.0
- ARV discount +5.4/15.0
- Livability +4.0/5.0
- Schools +3.7/10.0
- Rent growth +2.5/5.0
- Condition / age +2.5/5.0
- Appreciation +0.0/10.0
$129,000
🖨 Deal sheet 📄 Offer letter ✓ Due diligence
Listing remarks MLS
Vaulted ceilings, walk in closets, enclosed sun room. Newer carpeting in living room and 2nd bedroom. Heat pump. Large backyard room for garden. Glass top stove.
Key facts
- Heat pump
- New roof
- 2 garage spots
Tags
Property features AI
Finance
- Other: Square footage source: County; No assessments or liens reported
- HOA & community: Located in an adult park
Exterior
- Parking: Detached 2-car garage
- Utilities: City water connected; Electric water heater
- Home design: Double wide manufactured home; Adult park community (Greenway)
- Construction: Lap siding; Composition roof; Pier foundation; Built in 1984; Tan exterior
- Exterior features: Partially fenced yard; Front door
Interior
- Kitchen: Range included; Refrigerator included
- Bedrooms: Master bedroom on the main level; Second bedroom on the main level
- Flooring: Carpet; Vinyl
- Bathrooms: Two bathrooms on the main level
- Heating & cooling: Heat pump; Forced air heating
- Interior features: Carpet and vinyl flooring; Electric range
- Laundry & utility: Utility room on the main level; Electric water heater
Neighborhood map
What this means for you Summary
Snapshot
- This is a 2-bed/2.0-bath manufactured listed at $129k.
Deal economics
- At list price, monthly cash flow is $408 ($5k/yr) — positive.
- The deal already cash-flows at list — no discount required.
- Meets the 1% rule at list price ($2k rent vs $129k).
- Cap rate 10.1% vs local median 2.4% in Dallas — top-decile yield for the area; either an underpriced asset or a hidden risk that comps aren't pricing in. Stress-test before assuming the spread holds.
Location & tenants
- Location reads 79/100 on livability (#61 in OR, #2,132 nationally) — a middle-class / working-renter tenant base. Strengths: housing A+, health & safety A+, commute A; Watch: amenities F.
- Dallas SD 2 (town): math 32% / reading 48% proficiency, ranked #102 of 183 in OR (top 56%) — families likely to look elsewhere, expect single-tenant / working-renter base with shorter leases.
- Zoned schools: Dallas High School (836 students, 27% FRL).
- Market conditions: 215 active listings in the ZIP; 9 comparable units currently listed for rent nearby; rentals at typical pace (median 21d on market — plan ~3-4 weeks tenant-placement turnaround); solid renter incomes; 177 units permitted in Polk County in 2024 (14 in 5+ unit buildings).
Forward outlook
- Local home prices are declining (-3.0%/yr); year-one equity from $892 of loan paydown is wiped out by about $4k of value loss. Plan a longer hold.
- Polk County population projected at +25% by 2050 — long-run rental-demand tailwind backs the buy-and-hold thesis.
- At projected returns (-3.0% appreciation + 3.0% rent growth), your $36k cash investment doubles in ~9 years — after that, you're playing with house money.
Negotiation context
- Only 6 days on market — expect competitive offers; lowballing is unlikely to land.
- 2 sale attempts since 19y ago with the ask held roughly flat each time — persistent listings suggest the price (not the market) is what's stuck; bring a comps-based counter.
- Current owner paid $28k; list at $129k implies a 369% gain — meaningful room to come down on a strong offer.
Risks & watch-outs
- Climate carrying-cost: moderate flood risk; major wildfire risk — expect insurance premiums to compound above CPI over the hold.
Questions for the listing agent
- Is there a deadline driving the sale (1031 exchange, divorce, estate, relocation)? That informs how much negotiation room exists.
- Schools are D-rated, which usually means shorter tenancies and higher turnover. Who's the typical renter profile here, and what's been the actual vacancy rate?
- What's the average days-on-market for RENTAL listings here right now (not sales)? A rising rental-DOM trend means longer vacancies and softer asking-rent achievability than the comps imply.
- What's the recent tenant-quality profile in this submarket — average credit score on applications, eviction rate, late-payment / NSF rate, and stable-employment percentage? A property-management company in the area should have these aggregated.
- How much new for-sale + rental construction is in the pipeline within 1–3 miles? Heavy new supply typically softens prices + rents 12–24 months out; constrained supply supports both.
Investment metrics
- 1% rule
- 1.28% ✓
- Cap rate
- 10.09%
- Cash-on-cash
- 13.56%
- DSCR
- 1.60
- GRM
- 6.5
CMA / ARV
- ARV (on-the-fly)
- $123,120
- Comps found
- 12
Show comp detail 12 sales within ~0.75 mi
| Address | Dist | Beds/Ba | Sqft | Sold | Price | $/sf | Match |
|---|---|---|---|---|---|---|---|
| 450 LaCreole Dr #25 | 0.10mi | 3/2.0 (+1) | 1,296 (0%) | 1mo | $161,500 | $125 | 90 |
| 300 SE LaCreole Dr #263 | 0.14mi | 3/2.0 (+1) | 1,296 (0%) | 1mo | $145,900 | $113 | 87 |
| 450 SE Lacreole Dr #128 | 0.00mi | 3/2.0 (+1) | 1,248 (-4%) | 2mo | $65,000 | $52 | 87 |
| 450 LaCreole Dr #31 | 0.00mi | 2/2.0 | 1,344 (+4%) | 8mo | $106,000 | $79 | 87 |
| 450 SE Lacreole Dr #49 | 0.00mi | 3/2.0 (+1) | 1,244 (-4%) | 8mo | $122,000 | $98 | 82 |
| 300 SE Lacreole Dr #253 | 0.14mi | 2/2.0 | 1,404 (+8%) | 2mo | $55,000 | $39 | 78 |
| 300 LaCreole Dr #220 | 0.19mi | 2/2.0 | 1,404 (+8%) | 2mo | $150,000 | $107 | 76 |
| 300 SE LaCreole Dr #210 | 0.14mi | 3/2.0 (+1) | 1,188 (-8%) | 3mo | $100,000 | $84 | 72 |
| 631 E Ellendale Ave #206 | 0.40mi | 3/2.0 (+1) | 1,339 (+3%) | 0mo | $154,000 | $115 | 70 |
| 300 SE Lacreole Dr #283 | 0.25mi | 2/2.0 | 1,224 (-6%) | 11mo | $116,000 | $95 | 70 |
| 300 SE Lacreole Dr #211 | 0.25mi | 2/2.0 | 1,188 (-8%) | 7mo | $79,500 | $67 | 69 |
| 1030 E Ellendale Ave #3 | 0.39mi | 3/1.5 (+1) | 1,176 (-9%) | 9mo | $60,000 | $51 | 52 |
Match score weights: distance 35% · size 25% · config 20% · recency 20%. Top-matched comps best support the ARV.
Projected returns pro-forma
-3.0% appreciation · 3.0% rent growth · sell at horizon
- IRR
- 3.7%
- Equity multiple
- 1.14×
- Total profit
- $5,111
- Equity at exit
- $19,234
- IRR
- 13.2%
- Equity multiple
- 2.05×
- Total profit
- $38,017
- Equity at exit
- $11,154
Cash invested: $36,120 (down + closing). Projections, not guarantees.
Landlord ↔ Tenant lean methodology
- Overall (STATE)
- 28 Tenant-Leaning
- State Oregon
- 28 Tenant-Leaning · D+6
- County
- — inherits STATE
- City
- — inherits STATE
ZIP-level market 97338
- Active inventory
- 215
- Price-to-rent
- 6.5×
Monthly cashflow live
- Estimated rent
- $1,645 high interval (Pro) →
- Mortgage (P&I)
- −$676
- Tax est. 1.5%
- −$161 /mo · $1,935/yr
- Insurance
- −$54
- HOA
- −$0
- Vacancy / Maint / Mgmt
- −$345
- Net cashflow
- $408
Break-even live
UW: 25.0% down · 7.5% · 30yr · 1.5% tax · 5.0% vac · 8.0% maint · 8.0% mgmt
Financing live
Cash to close
- Down payment
- $32,250
- Closing costs
- $3,870
- Reserves months
- —
- Total cash needed
- —
Loan-product check · same deal, 3 products live
Conventional
25% down · 7.5% · 30yr
- Down + closing
- —
- Monthly P&I
- —
- Monthly cashflow
- —
- DSCR
- —
- Eligible?
- —
Personal DTI + credit; lowest rate.
DSCR
20% down · 8.5% · 30yr
- Down + closing
- —
- Monthly P&I
- —
- Monthly cashflow
- —
- DSCR
- —
- Eligible?
- —
No personal income docs; deal must DSCR.
Hard money
10% down · 12.0% · 12mo
- Down + closing
- —
- Monthly P&I
- —
- Monthly cashflow
- —
- DSCR
- —
- Eligible?
- —
Short-term bridge; refi at stabilization.
Rent comps 9 comps
| Address | Beds | Baths | Sqft | Rent | $/sqft | DOM | Units | Dist |
|---|---|---|---|---|---|---|---|---|
| 418 SE Lacreole Dr Apt 4 Dallas, OR | 2.0 | 1.5 | 1120 | $1,500 | $1.34 | 44d | 1 | 0.16mi |
| 481 E Ellendale Ave Dallas, OR | 2.0 | 2.0 | 1050 | $1,425 | $1.36 | 2d | 2 | 0.49mi |
| 1060 SE Miller Ave Dallas, OR | 3.0 | 2.0 | 1200 | $1,725 | $1.44 | 14d | 1 | 0.49mi |
| 1267 SE Holman Ave Unit 2 Dallas, OR | 3.0 | 1.5 | 1045 | $1,850 | $1.77 | 23d | 1 | 0.71mi |
| 1289 SE Holman Ave Dallas, OR | 3.0 | 1.0 | 926 | $1,495 | $1.61 | 44d | 1 | 0.73mi |
| 860 SE Fir Villa Rd Dallas, OR | 3.0 | 2.0 | 1200 | $2,200 | $1.83 | 21d | 1 | 0.86mi |
| 352 NE Evergreen Ct Dallas, OR | 2.0 | 1.0 | 1041 | $1,700 | $1.63 | 14d | 1 | 0.87mi |
| 237 SE Clay St Apt 4 Dallas, OR | 2.0 | 1.0 | 970 | $1,550 | $1.60 | 14d | 1 | 1.00mi |
| 1324 SW Levens St Dallas, OR | 3.0 | 1.0 | 1012 | $2,100 | $2.08 | 23d | 1 | 1.28mi |
Listing history 6 events
-
2026-06-18days on market $129,000 Active 6 DOM
-
2026-06-17days on market $129,000 Active 5 DOM
-
2026-06-16days on market $129,000 Active 4 DOM
-
2026-06-15days on market $129,000 Active 3 DOM
-
2026-06-14remarks 319-char remark
-
2026-06-14$129,000 Active 1 DOM
ⓘ Source: listings_history table (triggers on properties + properties_extension) + one-shot
backfill from property_details.listing_events for pre-trigger history.
Climate risk First Street
- Flood 5/10 Major FEMA zone X (unshaded) · 24% chance over 30 yrs
- Wildfire 6/10 Major
- Heat 3/10 Moderate 7 d/yr ≥92°F today · 15 d/yr by 30 yrs out
- Wind 1/10 Low
- Air quality 8/10 Severe 10 unhealthy d/yr today · 10 by 30 yrs out
Nearby sold comps map
Loading sold comps map…
Walkable amenities ~0.75 mi
Loading nearby amenities…
Taxation est. · year 1
- Rental income
- $19,740
- − Mortgage interest
- −$7,226
- − Property taxes
- −$1,935
- − Insurance
- −$645
- − Repairs & maintenance
- −$1,579
- − Management
- −$1,579
- − Depreciation
- −$3,753
- Taxable income
- $3,023
- Est. tax owed @ 24.0%
- −$725
- After-tax cash flow
- $4,171/yr
For passive investors: Depreciation is non-cash, so a rental often shows a tax loss while cash-flowing — sheltering income. Rental losses are passive: they offset passive income freely, and up to $25,000/yr can offset ordinary (W-2) income if you actively participate and your MAGI is under $100k (phasing out to $0 by $150k); unused losses carry forward. On sale, claimed depreciation is recaptured at up to 25%, and gains may owe capital-gains tax (a 1031 exchange can defer both). Figures are a year-1 estimate at your 24.0% rate — not tax advice; consult a CPA.
Schools (NCES district)
- District
- Dallas SD 2
- NCES district ID
- 4103860
- Math proficiency
- 32% ▼ -7.00%
- Reading proficiency
- 48% ▼ -4.00%
- Median HH income
- $53,684
- Composite
- 37.24/100
- National rank
- #8983
- State rank
- #102 of 183 in OR
Livability — Dallas
- Score
- 79/100
- State rank
- #61
- US rank
- #2132
Category grades
Schools grade is shown separately in the Schools card above.
Census & demographics
- Census place
- Dallas, OR
- County
- Polk County · 84,240 people
- City population
- 23,419
- Metro
- Salem, OR
- Population (ZIP)
- 23,419
- Household income
- $78,858
- Rent vs Own
- Severe rent burden
- 782.0
Population outlook (Polk County) Hauer SSP2
- Today (2025)
- 88,594 people
- By 2030
- 93,209 · +5.2%
- By 2040
- 101,942 · +15.1%
- By 2050
- 110,395 · +24.6%
- By 2075
- 131,091 · +48.0%
- By 2100
- 141,746 · +60.0%
Race, ethnicity, and origin ACS 2023
- Neighborhood character
- Predominantly White (81%)
- Race & ethnicity
- White 81% Hispanic / Latino 10% Two or more races 9% Native American 2%
- Hispanic origin (detail)
- Mexican 8%
- Common ancestry
- Slovak 4% Portuguese 3% Lithuanian 3%
- Foreign-born
- 3% · Canada
- Languages at home
- 95% English-only · Spanish 4%
Political lean MEDSL · Polk
- 2024 margin
- Toss-up / Even · D 46.6% · R 50.4% · Other 3.0%
- 2008→2024 swing
- -3.3pp toward R · 2008: -0.5pp · 2024: -3.8pp
- All cycles
- 2024: R+3.8 2020: R+1.7 2016: R+7.0 2012: R+4.8 2008: R+0.5
Not yet ingested
- Civics
- —
Market trends
- HPI YoY
- ▼ -332.14%
- Current HPI
- 311.4157
- Rent YoY
- —
- Metro
- Salem, OR
- State GDP YoY
- ▲ 2.05%
- F500 in state
- 2
Industry mix (Fortune 500 HQ in OR)
| Industry | F500 HQs | Revenue |
|---|---|---|
| Consumer Goods | 1 | $51B |
|
||
Price history
+369.1% since first listed4 events — show timeline
- 2026-06-12 Listed $129,000 WVMLS
- 2008-02-08 Sold (MLS) $27,500 WVMLS
- 2008-01-19 Listing Removed — WVMLS
- 2007-11-16 Listed $27,500 WVMLS
Cash-flow waterfall
monthlySold comps — $/sqft
last 12 mo · ≤1 miLoading sold comps…