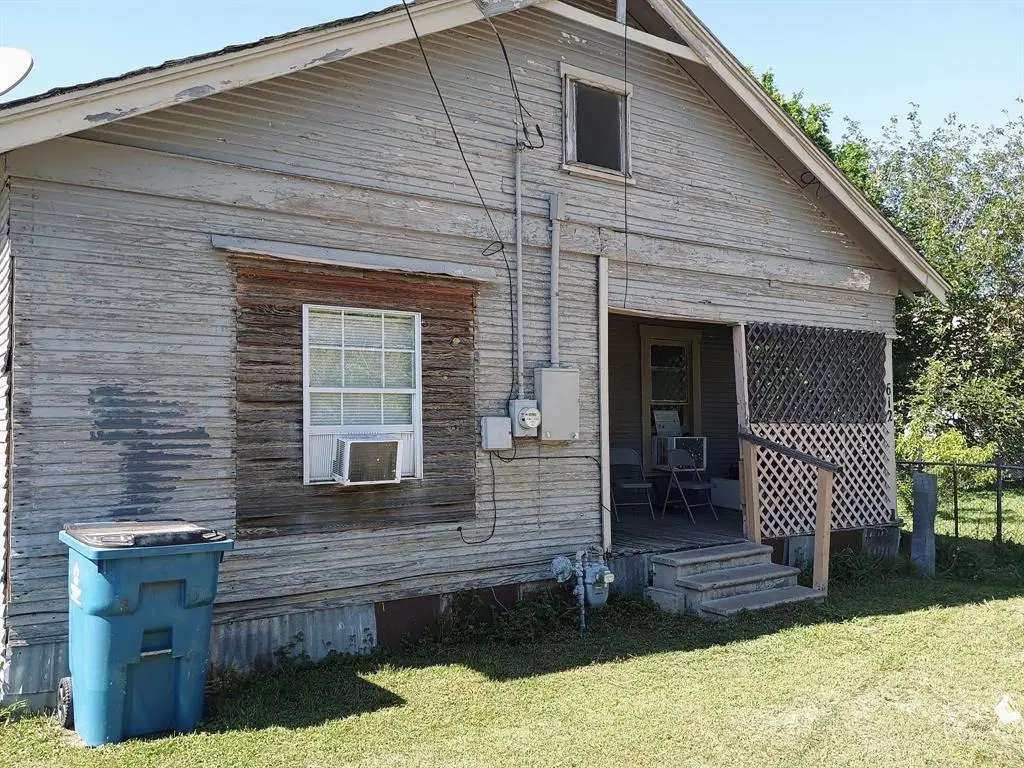
612 W 16th Ave · Corsicana, TX
Flood risk 1/10 · Minimal
- FEMA flood zone
- X (unshaded)
- Chance of flooding over 30 yrs
- 0.0%
- Est. flood insurance / yr
- $507 – $1,088
Fire risk 5/10 · Moderate
- Est. fire insurance / yr
- $1,222 – $2,270
Heat risk 7/10 · Major
- Hot days now (above 109°F)
- 7 days/yr
- Hot days in 30 yrs
- 25 days/yr
Wind risk 6/10 · Moderate
- Chance of severe wind over 30 yrs
- 58.0%
Air-quality risk 2/10 · Minimal
- Unhealthy air days now
- 0 days/yr
- Unhealthy air days in 30 yrs
- 1 days/yr
Risk factors via First Street. Map © Google.
Why this score? — see what drove the B- grade
The composite is a weighted blend of 9 inputs, each scored 0–100. Each bar is that input's sub-score; the figure is the points it added to the 100-point composite (weight × sub-score).
- Cash flow +30.0/30.0
- 1% rule +10.0/10.0
- DSCR +10.0/10.0
- ARV discount +7.5/15.0
- Livability +3.6/5.0
- Schools +3.2/10.0
- Condition / age +2.5/5.0
- Rent growth +2.1/5.0
- Appreciation +0.0/10.0
$72,000
🖨 Deal sheet 📄 Offer letter ✓ Due diligence
Listing remarks
612 W 16th Ave presents a strong value-add opportunity with Main Street frontage, ideal for investors or buyers looking to build equity. This 2-bedroom, 1-bath home is livable and functional, making it suitable for immediate occupancy while repairs and updates are completed. The property offers a straightforward layout with solid potential and visibility from a well-traveled street. While repairs and cosmetic improvements are needed, the home is priced with that in mind and provides an excellent chance to renovate, rent, or update to personal preference. Main Street location adds convenience, accessibility, and long-term value appeal. Located near local amenities, schools, and major routes
Key facts
- Near schools
- Established area
- Near major routes
Tags
Property features AI
Finance
- Other: Lot smaller than 0.5 acre
- Financial info: Treat as clear loan type; No second mortgage
- HOA & community: No association
Exterior
- Parking: 2 covered parking spaces; Driveway parking; Outside parking
- Utilities: City water; City sewer; Electricity connected; Cable available
- Home design: Single-family residence; One story; Residential property; Not attached to another property
- Construction: Built in 1940
- Exterior features: Sidewalk; City water; City sewer; Cable available; Electricity connected
Interior
- Kitchen: No appliances included
- Bedrooms: Primary bedroom on main level; Second bedroom on main level
- Bathrooms: 1 full bathroom
- Interior features: One living area; Other interior features; 3 total rooms
Neighborhood map
What this means for you Summary
Snapshot
- This is a 2-bed/1.0-bath single-family listed at $72k.
Deal economics
- At list price, monthly cash flow is $599 ($7k/yr) — positive.
- The deal already cash-flows at list — no discount required.
- Meets the 1% rule at list price ($1k rent vs $72k).
- Recommended offer: $71k (1.5% below list) — sets the bar for market timing.
- Cap rate 16.3% vs local median 4.5% in Corsicana — top-decile yield for the area; either an underpriced asset or a hidden risk that comps aren't pricing in. Stress-test before assuming the spread holds.
Location & tenants
- Location reads 71/100 on livability (#283 in TX) — a middle-class / working-renter tenant base. Strengths: cost of living A+, housing A+, health & safety A+; Watch: amenities D, crime F, commute F.
- Corsicana ISD (town): math 39% / reading 37% proficiency, ranked #471 of 826 in TX (top 57%) — families likely to look elsewhere, expect single-tenant / working-renter base with shorter leases; 65% free/reduced lunch — lower-income household profile, screen leases tightly.
- Zoned schools: Carroll El (math 32% / reading 27%, grade F, #2,525 of 4,322 statewide, top 62%, 502 students, 96% FRL) — zoned schools average 96% FRL vs 65% district-wide (31 pts higher); higher-poverty schools than district average — tighter screening recommended.
- Market conditions: Rents soft (-1.5%/yr); 268 active listings in the ZIP; 6 comparable units currently listed for rent nearby; rentals lingering (median 44d on market — plan ~5-8 weeks vacancy on turnover, expect pricing pressure); 83% of comp listings sitting > 30 days — soft ceiling on asking rent; 522 units permitted in Navarro County in 2024 (0 in 5+ unit buildings).
Forward outlook
- Local home prices are declining (-3.0%/yr); year-one equity from $498 of loan paydown is wiped out by about $2k of value loss. Plan a longer hold.
- Navarro County population projected to shrink 4% by 2050 — rents likely to lag national; underwrite the cash flow, not the appreciation.
- At projected returns (-3.0% appreciation + 0.0% rent growth), your $20k cash investment doubles in ~4 years — after that, you're playing with house money.
Negotiation context
- It's been on market 21 days — a 2% lower offer ($71k) is reasonable based on typical stale-listing flexibility.
- 5 sale attempts since 19y ago with the ask held roughly flat each time — persistent listings suggest the price (not the market) is what's stuck; bring a comps-based counter.
Risks & watch-outs
- Watch-outs: built in 1944 — expect roof / HVAC / electrical / plumbing capex.
- Climate carrying-cost: major wind risk, 58% chance of damaging wind over 30y; moderate wildfire risk; extreme-heat days projected 7→25/yr by 2055 (HVAC capex compounding) — expect insurance premiums to compound above CPI over the hold.
Questions for the listing agent
- Built in 1944 — when were the roof, HVAC, electrical panel, plumbing, and water heater last replaced?
- Is there a deadline driving the sale (1031 exchange, divorce, estate, relocation)? That informs how much negotiation room exists.
- Schools are F-rated, which usually means shorter tenancies and higher turnover. Who's the typical renter profile here, and what's been the actual vacancy rate?
- Crime grade is F in this area — have there been break-ins, vandalism, or insurance claims at this property in the last 3 years? What carrier currently insures it and at what premium?
- What's the average days-on-market for RENTAL listings here right now (not sales)? A rising rental-DOM trend means longer vacancies and softer asking-rent achievability than the comps imply.
- What's the recent tenant-quality profile in this submarket — average credit score on applications, eviction rate, late-payment / NSF rate, and stable-employment percentage? A property-management company in the area should have these aggregated.
- How much new for-sale + rental construction is in the pipeline within 1–3 miles? Heavy new supply typically softens prices + rents 12–24 months out; constrained supply supports both.
Investment metrics
- 1% rule
- 1.87% ✓
- Cap rate
- 16.28%
- Cash-on-cash
- 35.68%
- DSCR
- 2.59
- GRM
- 4.4
CMA / ARV
- ARV (on-the-fly)
- $185,168
- Comps found
- 7
Show comp detail 7 sales within ~0.75 mi
| Address | Dist | Beds/Ba | Sqft | Sold | Price | $/sf | Match |
|---|---|---|---|---|---|---|---|
| 811 S 18th St | 0.33mi | 3/2.0 (+1) | 1,148 (+1%) | 1mo | $190,000 | $166 | 73 |
| 115 E 13th Ave | 0.39mi | 3/2.0 (+1) | 1,151 (+1%) | 2mo | $189,000 | $164 | 69 |
| 123 E 13th Ave | 0.39mi | 3/2.0 (+1) | 1,265 (+11%) | 2mo | $190,000 | $150 | 52 |
| 119 E 13th Ave | 0.39mi | 3/2.0 (+1) | 1,263 (+11%) | 4mo | $205,900 | $163 | 50 |
| 1111 W 12th Ave | 0.43mi | 3/1.0 (+1) | 1,008 (-11%) | 8mo | $159,000 | $158 | 50 |
| 106 W 17th Ave | 0.38mi | 3/2.0 (+1) | 1,305 (+15%) | 8mo | $200,000 | $153 | 42 |
| 204 E PR Renfro Ave | 0.53mi | 3/2.0 (+1) | 1,292 (+14%) | 21mo | $224,000 | $173 | 26 |
Match score weights: distance 35% · size 25% · config 20% · recency 20%. Top-matched comps best support the ARV.
Projected returns pro-forma
-3.0% appreciation · 0.0% rent growth · sell at horizon
- IRR
- 28.0%
- Equity multiple
- 2.12×
- Total profit
- $22,556
- Equity at exit
- $10,735
- IRR
- 33.7%
- Equity multiple
- 3.65×
- Total profit
- $53,522
- Equity at exit
- $6,225
Cash invested: $20,160 (down + closing). Projections, not guarantees.
Landlord ↔ Tenant lean methodology
- Overall (STATE)
- 87 Strongly Landlord-Friendly
- State Texas
- 87 Strongly Landlord-Friendly · R+5
- County
- — inherits STATE
- City
- — inherits STATE
ZIP-level market 75110
- Rents YoY
- -1.5%
- Active inventory
- 268
- Price-to-rent
- 4.4×
Monthly cashflow live
- Estimated rent
- $1,349 high interval (Pro) →
- Mortgage (P&I)
- −$378
- Tax from tax record
- −$59 /mo · $708/yr
- Insurance
- −$30
- HOA
- −$0
- Vacancy / Maint / Mgmt
- −$283
- Net cashflow
- $599
Break-even live
UW: 25.0% down · 7.5% · 30yr · 1.5% tax · 5.0% vac · 8.0% maint · 8.0% mgmt
Financing live
Cash to close
- Down payment
- $18,000
- Closing costs
- $2,160
- Reserves months
- —
- Total cash needed
- —
Loan-product check · same deal, 3 products live
Conventional
25% down · 7.5% · 30yr
- Down + closing
- —
- Monthly P&I
- —
- Monthly cashflow
- —
- DSCR
- —
- Eligible?
- —
Personal DTI + credit; lowest rate.
DSCR
20% down · 8.5% · 30yr
- Down + closing
- —
- Monthly P&I
- —
- Monthly cashflow
- —
- DSCR
- —
- Eligible?
- —
No personal income docs; deal must DSCR.
Hard money
10% down · 12.0% · 12mo
- Down + closing
- —
- Monthly P&I
- —
- Monthly cashflow
- —
- DSCR
- —
- Eligible?
- —
Short-term bridge; refi at stabilization.
Rent comps 6 comps
| Address | Beds | Baths | Sqft | Rent | $/sqft | DOM | Units | Dist |
|---|---|---|---|---|---|---|---|---|
| 1801 S Business 45 Unit 14 Corsicana, TX | 1.0 | 1.0 | 1000 | $750 | $0.75 | 44d | 1 | 0.73mi |
| 1509 W Collin St Corsicana, TX | 3.0 | 2.0 | 1290 | $1,850 | $1.43 | 44d | 1 | 0.92mi |
| 736 W 1st Ave Unit B Corsicana, TX | 1.0 | 1.0 | 750 | $850 | $1.13 | 44d | 1 | 1.01mi |
| 1306 Liveoak Ave Corsicana, TX | 3.0 | 1.0 | 1080 | $1,300 | $1.20 | 5d | 1 | 1.29mi |
| 1505 Woodlawn Ave Corsicana, TX | 3.0 | 2.0 | 1220 | $1,900 | $1.56 | 44d | 1 | 1.34mi |
| 1624 E Collin St Corsicana, TX | 3.0 | 2.0 | 1339 | $2,000 | $1.49 | 44d | 1 | 1.49mi |
Listing history 23 events
-
2026-06-19days on market $72,000 Active 21 DOM
-
2026-06-18days on market $72,000 Active 20 DOM
-
2026-06-17days on market $72,000 Active 19 DOM
-
2026-06-16days on market $72,000 Active 18 DOM
-
2026-06-15days on market $72,000 Active 17 DOM
-
2026-06-14days on market $72,000 Active 15 DOM
-
2026-06-12days on market $72,000 Active 14 DOM
-
2026-06-09days on market $72,000 Active 11 DOM
-
2026-06-08days on market $72,000 Active 10 DOM
-
2026-06-07days on market $72,000 Active 9 DOM
-
2026-06-02days on market $72,000 Active 4 DOM
-
2026-06-01days on market $72,000 Active 3 DOM
-
2026-05-31days on market $72,000 Active 2 DOM
-
2026-05-29$72,000 Active
-
2026-03-16historical
-
2026-03-12price $68,000
-
2026-02-25$69,000 Active
-
2017-12-01historical
-
2016-12-14$45,000 Active
-
2014-09-26historical
-
2013-09-25$35,000 Active
-
2008-02-11historical
-
2007-09-17$42,000
ⓘ Source: listings_history table (triggers on properties + properties_extension) + one-shot
backfill from property_details.listing_events for pre-trigger history.
Tax reassessment forecast TX · Resets to sale price
- Current annual tax
- $708 · $59/mo
- Projected year-2 tax
- $1,318 · $110/mo
- Expected delta
- +$609/yr (+$51/mo · 86.0%)
ⓘ Screening estimate from a state-policy table — verify with the county assessor before closing.
Climate risk First Street
- Flood 1/10 Low FEMA zone X (unshaded) · 0% chance over 30 yrs
- Wildfire 5/10 Major
- Heat 7/10 Severe 7 d/yr ≥109°F today · 25 d/yr by 30 yrs out
- Wind 6/10 Major 58% chance of damaging wind over 30 yrs
- Air quality 2/10 Low 0 unhealthy d/yr today · 1 by 30 yrs out
Nearby sold comps map
Loading sold comps map…
Walkable amenities ~0.75 mi
Loading nearby amenities…
Taxation est. · year 1
- Rental income
- $16,192
- − Mortgage interest
- −$4,033
- − Property taxes
- −$708
- − Insurance
- −$360
- − Repairs & maintenance
- −$1,295
- − Management
- −$1,295
- − Depreciation
- −$2,095
- Taxable income
- $6,406
- Est. tax owed @ 24.0%
- −$1,537
- After-tax cash flow
- $5,655/yr
For passive investors: Depreciation is non-cash, so a rental often shows a tax loss while cash-flowing — sheltering income. Rental losses are passive: they offset passive income freely, and up to $25,000/yr can offset ordinary (W-2) income if you actively participate and your MAGI is under $100k (phasing out to $0 by $150k); unused losses carry forward. On sale, claimed depreciation is recaptured at up to 25%, and gains may owe capital-gains tax (a 1031 exchange can defer both). Figures are a year-1 estimate at your 24.0% rate — not tax advice; consult a CPA.
Schools (NCES district)
- District
- Corsicana ISD
- NCES district ID
- 4815330
- Math proficiency
- 39% ▼ -9.00%
- Reading proficiency
- 37% ▬ 0.00%
- Median HH income
- $39,948
- Composite
- 31.89/100
- National rank
- #5862
- State rank
- #471 of 826 in TX
Livability — Corsicana
- Score
- 71/100
- State rank
- #283
- US rank
- #6570
Category grades
Schools grade is shown separately in the Schools card above.
Census & demographics
- Census place
- Corsicana, TX
- County
- Navarro County · 31,552 people
- City population
- 31,552
- Metro
- Corsicana, TX
- Population (ZIP)
- 31,552
- Household income
- $57,370
- Rent vs Own
- Severe rent burden
- 663.0
Population outlook (Navarro County) Hauer SSP2
- Today (2025)
- 48,397 people
- By 2030
- 48,096 · -0.6%
- By 2040
- 47,394 · -2.1%
- By 2050
- 46,541 · -3.8%
- By 2075
- 44,940 · -7.1%
- By 2100
- 42,288 · -12.6%
Race, ethnicity, and origin ACS 2023
- Neighborhood character
- Diverse neighborhood (Simpson 0.68)
- Race & ethnicity
- White 41% Hispanic / Latino 37% Two or more races 16% Black 13% Pacific Islander 2% Asian 1%
- Hispanic origin (detail)
- Mexican 34%
- Common ancestry
- Lithuanian 2% Slovak 1% Romanian 1%
- Foreign-born
- 17% · Canada
- Languages at home
- 68% English-only · Spanish 29% Other Asian/Pacific 2%
Political lean MEDSL · Navarro
- 2024 margin
- Solid R (+51.8) · D 23.7% · R 75.6%
- 2008→2024 swing
- -18.7pp toward R · 2008: -33.1pp · 2024: -51.8pp
- All cycles
- 2024: R+51.8 2020: R+45.5 2016: R+48.8 2012: R+42.4 2008: R+33.1
Not yet ingested
- Civics
- —
Market trends
- HPI YoY
- ▼ -248.01%
- Current HPI
- 224.5566
- Rent YoY
- ▼ -1.47%
- Metro
- Corsicana, TX
- State GDP YoY
- ▲ 3.95%
- F500 in state
- 110
Industry mix (Fortune 500 HQ in TX)
| Industry | F500 HQs | Revenue |
|---|---|---|
| Energy | 16 | $1,198B |
|
||
| Technology | 5 | $198B |
|
||
| Engineering / Construction | 4 | $72B |
|
||
| Energy Services | 3 | $60B |
|
||
| Utilities | 3 | $41B |
|
||
| Healthcare | 2 | $330B |
|
||
Price history
+71.4% since first listed10 events — show timeline
- 2026-05-29 Listed $72,000 NTREIS
- 2026-03-16 Listing Removed — HARMLS
- 2026-03-12 Price Changed $68,000 HARMLS
- 2026-02-25 Listed $69,000 HARMLS
- 2017-12-01 Listing Removed — NTREIS
- 2016-12-14 Listed $45,000 NTREIS
- 2014-09-26 Listing Removed — NTREIS
- 2013-09-25 Listed $35,000 NTREIS
- 2008-02-11 Listing Removed — NTREIS
- 2007-09-17 Listed $42,000 NTREIS
Property tax history
+6.6%/yrLatest (2025): $708 · +9.5% YoY. Source: county tax records.
Cash-flow waterfall
monthlySold comps — $/sqft
last 12 mo · ≤1 miLoading sold comps…