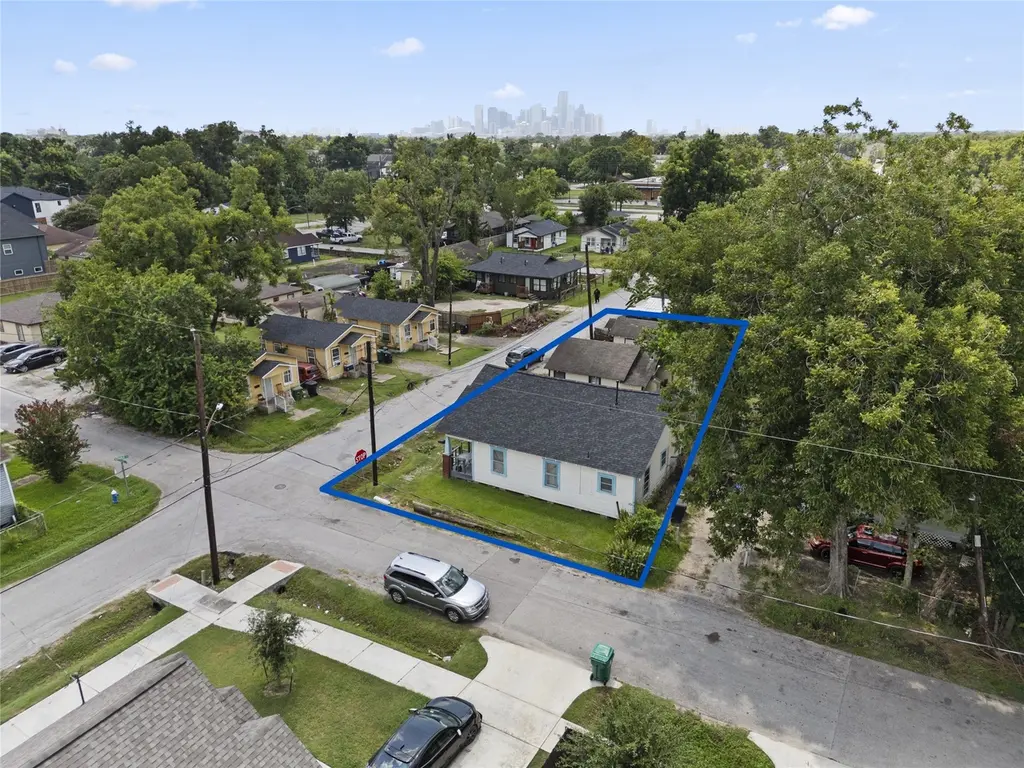
5611 Nichols St · Houston, TX
Flood risk 6/10 · Moderate
- FEMA flood zone
- X (unshaded)
- Chance of flooding over 30 yrs
- 0.71%
- Est. flood insurance / yr
- $507 – $1,088
Fire risk 1/10 · Minimal
- Est. fire insurance / yr
- $1,222 – $2,270
Heat risk 9/10 · Severe
- Hot days now (above 109°F)
- 7 days/yr
- Hot days in 30 yrs
- 24 days/yr
Wind risk 9/10 · Severe
- Chance of severe wind over 30 yrs
- 99.0%
Air-quality risk 3/10 · Minor
- Unhealthy air days now
- 2 days/yr
- Unhealthy air days in 30 yrs
- 3 days/yr
Risk factors via First Street. Map © Google.
Why this score? — see what drove the D grade
The composite is a weighted blend of 9 inputs, each scored 0–100. Each bar is that input's sub-score; the figure is the points it added to the 100-point composite (weight × sub-score).
- ARV discount +15.0/15.0
- Appreciation +10.0/10.0
- Cash flow +4.6/30.0
- Livability +3.7/5.0
- Rent growth +3.6/5.0
- Schools +2.7/10.0
- Condition / age +2.5/5.0
- 1% rule +1.0/10.0
- DSCR +0.0/10.0
$170,000
🖨 Deal sheet (PDF) 📄 Offer letter ✓ Due diligence
Listing remarks MLS
3-Corner Homes In The Near North Chew subdivision, May be sold with others, Ask about other homes in The White Portfolio. with MLS# 187646792, 32158022, 35844177, 36322345, 4544794
Key facts
- 5,000 sq ft lot
- Parking
- Built 1939
Neighborhood map
What this means for you Summary
Snapshot
- This is a 1-bed/1.0-bath single-family listed at $170k.
Deal economics
- At list price, monthly cash flow is $-431 ($-5k/yr) — negative.
- To cash-flow at today's rent, offer at most $94k (44.8% below list).
- To meet the 1% rule (rent ≥ 1% of price), the offer needs to be $102k (39.7% below list).
- Recommended offer: $94k (44.8% below list) — sets the bar for cash-flow.
Location & tenants
- Location reads 74/100 on livability (#184 in TX, #4,771 nationally) — a middle-class / working-renter tenant base. Strengths: amenities A+, cost of living A+, housing A+; Watch: crime F.
- Houston ISD (urban): math 27% / reading 35% proficiency, ranked #593 of 826 in TX (top 72%) — families likely to look elsewhere, expect single-tenant / working-renter base with shorter leases; 71% free/reduced lunch — lower-income household profile, screen leases tightly.
- Zoned schools: Atherton El (math 8% / reading 22%, grade F, #4,021 of 4,322 statewide, top 94%, 433 students, 96% FRL); Mcreynolds Middle (math 10% / reading 17%, grade F, #1,602 of 1,662 statewide, top 97%, 398 students, 98% FRL); Wheatley H S (math 17% / reading 19%, grade F, #1,445 of 1,632 statewide, top 89%, 643 students, 95% FRL) — zoned schools average 97% FRL vs 71% district-wide (25 pts higher); higher-poverty schools than district average — tighter screening recommended.
- Zoned-school proficiency averages 15% at this address vs 31% district-wide (-16 pts) — the specific schools serving this property underperform the Houston ISD average; the district grade overstates school quality for this exact location.
- Market conditions: Rents rising fast (+4.3%/yr); 339 active listings in the ZIP; 32 comparable units currently listed for rent nearby; rentals at typical pace (median 26d on market — plan ~3-4 weeks tenant-placement turnaround); 29,883 units permitted in Harris County in 2024 (8,621 in 5+ unit buildings).
Forward outlook
- In year one you build about $18k of equity ($1k loan paydown + $17k appreciation (10.0% local appreciation)).
- Harris County population projected at +47% by 2050 — long-run rental-demand tailwind backs the buy-and-hold thesis.
- By year 3, paydown + projected appreciation supports a ~$46k cash-out refi (75% LTV) — recoverable capital for the next deal without selling this one.
Negotiation context
- It's been on market 217 days — a 12% lower offer ($150k) is reasonable based on typical stale-listing flexibility.
Risks & watch-outs
- Watch-outs: built in 1939 — expect roof / HVAC / electrical / plumbing capex.
- Climate carrying-cost: major flood risk; severe wind risk, 99% chance of damaging wind over 30y; extreme-heat days projected 7→24/yr by 2055 (HVAC capex compounding) — expect insurance premiums to compound above CPI over the hold.
Questions for the listing agent
- What do current leases actually rent for vs. the listed asking? Can we see a recent rent roll and the last 12 months of T-12 income?
- It's been on market 217 days. Have you received any prior offers? Is the seller open to a 45% concession, seller financing, or rate buy-down credit?
- Built in 1939 — when were the roof, HVAC, electrical panel, plumbing, and water heater last replaced?
- Why hasn't it sold? Are there any deal-killer items the seller is aware of (foundation, flood, title, zoning, code violations)?
- Is there a deadline driving the sale (1031 exchange, divorce, estate, relocation)? That informs how much negotiation room exists.
- Schools are D-rated, which usually means shorter tenancies and higher turnover. Who's the typical renter profile here, and what's been the actual vacancy rate?
- Crime grade is F in this area — have there been break-ins, vandalism, or insurance claims at this property in the last 3 years? What carrier currently insures it and at what premium?
- The area grade is low — what's the realistic commute time and amenity access for the typical tenant pool here? Any planned neighborhood developments (good or bad) we should know about?
- What's the average days-on-market for RENTAL listings here right now (not sales)? A rising rental-DOM trend means longer vacancies and softer asking-rent achievability than the comps imply.
- What's the recent tenant-quality profile in this submarket — average credit score on applications, eviction rate, late-payment / NSF rate, and stable-employment percentage? A property-management company in the area should have these aggregated.
- How much new for-sale + rental construction is in the pipeline within 1–3 miles? Heavy new supply typically softens prices + rents 12–24 months out; constrained supply supports both.
Investment metrics
- 1% rule
- 0.60% ✗
- Cap rate
- 3.25%
- Cash-on-cash
- -10.86%
- DSCR
- 0.52
- GRM
- 13.8
CMA / ARV
- ARV (median comp)
- $309,240
- List price
- $170,000
- Delta
- -45.03%
- Verdict
- UNDERPRICED
- Comps
- 20 within 1.0 mi
Projected returns pro-forma
10.0% appreciation · 4.27% rent growth · sell at horizon
- IRR
- 17.0%
- Equity multiple
- 2.40×
- Total profit
- $66,533
- Equity at exit
- $153,149
- IRR
- 16.4%
- Equity multiple
- 5.63×
- Total profit
- $220,449
- Equity at exit
- $330,273
Cash invested: $47,600 (down + closing). Projections, not guarantees.
Landlord ↔ Tenant lean methodology
- Overall (STATE)
- 87 Strongly Landlord-Friendly
- State Texas
- 87 Strongly Landlord-Friendly · R+5
- County
- — inherits STATE
- City
- — inherits STATE
ZIP-level market 77020
- Home prices YoY
- 29.1%
- Rents YoY
- 4.3%
- Active inventory
- 339
- Price-to-rent
- 13.8×
Monthly cashflow live
- Estimated rent
- $1,025 high interval (Pro) →
- Mortgage (P&I)
- −$891
- Tax from tax record
- −$278 /mo · $3,338/yr
- Insurance
- −$71
- HOA
- −$0
- Vacancy / Maint / Mgmt
- −$215
- Net cashflow
- $-431
Break-even live
Sensitivity live
| Price | -10% $-335 | -5% $-383 | +0% $-431 | +5% $-479 | +10% $-527 |
|---|---|---|---|---|---|
| Rent | -10% $-512 | -5% $-471 | +0% $-431 | +5% $-390 | +10% $-350 |
| Rate | -1.0pp $-345 | -0.5pp $-388 | base $-431 | +0.5pp $-475 | +1.0pp $-520 |
UW: 25.0% down · 7.5% · 30yr · 1.5% tax · 5.0% vac · 8.0% maint · 8.0% mgmt
Financing live
Cash to close
- Down payment
- $42,500
- Closing costs
- $5,100
- Reserves months
- —
- Total cash needed
- —
Loan-product check · same deal, 3 products live
Conventional
25% down · 7.5% · 30yr
- Down + closing
- —
- Monthly P&I
- —
- Monthly cashflow
- —
- DSCR
- —
- Eligible?
- —
Personal DTI + credit; lowest rate.
DSCR
20% down · 8.5% · 30yr
- Down + closing
- —
- Monthly P&I
- —
- Monthly cashflow
- —
- DSCR
- —
- Eligible?
- —
No personal income docs; deal must DSCR.
Hard money
10% down · 12.0% · 12mo
- Down + closing
- —
- Monthly P&I
- —
- Monthly cashflow
- —
- DSCR
- —
- Eligible?
- —
Short-term bridge; refi at stabilization.
Rent comps 32 comps
| Address | Beds | Baths | Sqft | Rent | $/sqft | DOM | Units | Dist |
|---|---|---|---|---|---|---|---|---|
| 4903 Noble St Houston, TX | 2.0 | 1.0 | 525 | $1,200 | $2.29 | 45d | 1 | 0.35mi |
| 2202 Solo St Houston, TX | 2.0 | 1.0 | 620 | $1,200 | $1.94 | 45d | 1 | 0.36mi |
| 5408 Market St Unit 5408-1 Houston, TX | 2.0 | 1.0 | 730 | $900 | $1.23 | 7d | 1 | 0.61mi |
| 5504 Morwood St Houston, TX | 2.0 | 1.0 | 749 | $850 | $1.13 | 26d | 1 | 0.76mi |
| 5510 Morwood St Houston, TX | 2.0 | 1.0 | 749 | $650 | $0.87 | 26d | 1 | 0.77mi |
| 5514 Morgood St Houston, TX | 2.0 | 1.0 | 749 | $650 | $0.87 | 45d | 1 | 0.79mi |
| 621 Majestic St Unit Back Houston, TX | 2.0 | 1.0 | 600 | $750 | $1.25 | 45d | 1 | 0.82mi |
| 1909 Benson St Houston, TX | 1.0 | 1.0 | 460 | $795 | $1.73 | 20d | 1 | 0.90mi |
| 1911 Benson St Unit 4 Houston, TX | 1.0 | 1.0 | 460 | $795 | $1.73 | 7d | 1 | 0.91mi |
| 1911 Benson St Unit 1 Houston, TX | 1.0 | 1.0 | 460 | $795 | $1.73 | 20d | 1 | 0.91mi |
| 6116 Octavia St Houston, TX | 2.0 | 1.0 | 611 | $775 | $1.27 | 26d | 1 | 0.95mi |
| 6116 Octavia St Houston, TX | 2.0 | 1.0 | 611 | $715 | $1.17 | 1d | 1 | 0.95mi |
| 5436 Makeig St Houston, TX | 2.0 | 1.0 | 749 | $650 | $0.87 | 26d | 1 | 0.95mi |
| 5430 Makeig St Houston, TX | 2.0 | 1.0 | 749 | $650 | $0.87 | 26d | 1 | 0.97mi |
| 5462 Makeig St Houston, TX | 2.0 | 1.0 | 749 | $650 | $0.87 | 26d | 1 | 0.98mi |
| 3802 Dabney St Houston, TX | 1.0–2.0 | 1.0 | 825 | $990 | $1.20 | 45d | 2 | 1.00mi |
| 3806 Wipprecht St Houston, TX | 1.0 | 1.0 | 750 | $700 | $0.93 | 15d | 1 | 1.02mi |
| 3814 Wipprecht St Unit 18B Houston, TX | 1.0 | 1.0 | 750 | $700 | $0.93 | 18d | 1 | 1.03mi |
| 3813 Wipprecht St Houston, TX | 2.0 | 1.0 | 750 | $1,200 | $1.60 | 26d | 1 | 1.04mi |
| 7212 Corpus Christi St Houston, TX | 1.0 | 1.0 | 700 | $950 | $1.36 | 45d | 1 | 1.05mi |
| 3502 Campbell St Houston, TX | 2.0 | 1.0 | 725 | $800 | $1.10 | 45d | 1 | 1.20mi |
| 4249 Clinton Dr Houston, TX | 1.0 | 1.0 | 692 | $1,950 | $2.82 | 4d | 1 | 1.31mi |
| 5006 Cavalcade St Apt 2 Houston, TX | 1.0 | 1.0 | 541 | $850 | $1.57 | 45d | 1 | 1.34mi |
| 1800 N Wayside Dr Unit 5 Houston, TX | 1.0 | 1.0 | 442 | $750 | $1.70 | 24d | 1 | 1.42mi |
| 3031 Sumpter St Houston, TX | 1.0 | 1.0 | 502 | $850 | $1.69 | 26d | 1 | 1.43mi |
| 3031 Sumpter St Unit 50 Houston, TX | 2.0 | 1.0 | 732 | $1,200 | $1.64 | 26d | 1 | 1.43mi |
| 3031 Sumpter St Houston, TX | 1.0 | 1.0 | 502 | $850 | $1.69 | 15d | 1 | 1.43mi |
| 1412 Sydnor St Houston, TX | 2.0 | 1.0 | 507 | $800 | $1.58 | 26d | 1 | 1.49mi |
| 1412 Sydnor St Houston, TX | 1.0 | 1.0 | 500 | $700 | $1.40 | 14d | 1 | 1.49mi |
| 1412 Sydnor St Houston, TX | 2.0 | 1.0 | 507 | $800 | $1.58 | 45d | 1 | 1.49mi |
| 1412 Sydnor St Unit 7 Houston, TX | 1.0 | 1.0 | 500 | $650 | $1.30 | 15d | 1 | 1.49mi |
| 1412 Sydnor St Unit 5 Houston, TX | 1.0 | 1.0 | 500 | $700 | $1.40 | 15d | 1 | 1.49mi |
Listing history 14 events
-
2026-06-21days on market $170,000 Active 217 DOM
-
2026-06-18days on market $170,000 Active 214 DOM
-
2026-06-17days on market $170,000 Active 213 DOM
-
2026-06-16days on market $170,000 Active 212 DOM
-
2026-06-15days on market $170,000 Active 211 DOM
-
2026-06-13days on market $170,000 Active 209 DOM
-
2026-06-10days on market $170,000 Active 205 DOM
-
2026-06-08days on market $170,000 Active 204 DOM
-
2026-06-07days on market $170,000 Active 203 DOM
-
2026-06-04days on market $170,000 Active 200 DOM
-
2026-05-31days on market $170,000 Active 197 DOM
-
2026-03-23price $170,000 180-char remark
Show marketing remark (180 chars)
3-Corner Homes In The Near North Chew subdivision, May be sold with others, Ask about other homes in The White Portfolio. with MLS# 187646792, 32158022, 35844177, 36322345, 4544794
-
2025-11-15$237,000 Active 180-char remark
Show marketing remark (180 chars)
3-Corner Homes In The Near North Chew subdivision, May be sold with others, Ask about other homes in The White Portfolio. with MLS# 187646792, 32158022, 35844177, 36322345, 4544794
-
1988-01-02soldstatus
ⓘ Source: listings_history table (triggers on properties + properties_extension) + one-shot
backfill from property_details.listing_events for pre-trigger history.
Tax reassessment forecast TX · Resets to sale price
- Current annual tax
- $3,338 · $278/mo
- Projected year-2 tax
- $3,338 · $278/mo
- Expected delta
- $0/yr ($0/mo · 0.0%)
ⓘ Screening estimate from a state-policy table — verify with the county assessor before closing.
Climate risk First Street
- Flood 6/10 Major FEMA zone X (unshaded) · 71% chance over 30 yrs
- Wildfire 1/10 Low
- Heat 9/10 Extreme 7 d/yr ≥109°F today · 24 d/yr by 30 yrs out
- Wind 9/10 Extreme 99% chance of damaging wind over 30 yrs
- Air quality 3/10 Moderate 2 unhealthy d/yr today · 3 by 30 yrs out
Nearby sold comps map
Loading sold comps map…
Walkable amenities ~0.75 mi
Loading nearby amenities…
Taxation est. · year 1
- Rental income
- $12,300
- − Mortgage interest
- −$9,523
- − Property taxes
- −$3,338
- − Insurance
- −$850
- − Repairs & maintenance
- −$984
- − Management
- −$984
- − Depreciation
- −$4,945
- Taxable loss
- −$8,324
- Est. tax savings @ 24.0%
- +$1,998
- After-tax cash flow
- $-3,171/yr
For passive investors: Depreciation is non-cash, so a rental often shows a tax loss while cash-flowing — sheltering income. Rental losses are passive: they offset passive income freely, and up to $25,000/yr can offset ordinary (W-2) income if you actively participate and your MAGI is under $100k (phasing out to $0 by $150k); unused losses carry forward. On sale, claimed depreciation is recaptured at up to 25%, and gains may owe capital-gains tax (a 1031 exchange can defer both). Figures are a year-1 estimate at your 24.0% rate — not tax advice; consult a CPA.
Schools (NCES district)
- District
- Houston ISD
- NCES district ID
- 4823640
- Math proficiency
- 27% ▼ -18.00%
- Reading proficiency
- 35% ▼ -6.00%
- Median HH income
- $46,054
- Composite
- 26.63/100
- National rank
- #7173
- State rank
- #593 of 826 in TX
Livability — Houston
- Score
- 74/100
- State rank
- #184
- US rank
- #4771
Category grades
Schools grade is shown separately in the Schools card above.
Census & demographics
- Census place
- Houston, TX
- County
- Harris County · 4,702,590 people
- City population
- 3,226,434
- Metro
- Houston-The Woodlands-Sugar Land, TX
- Population (ZIP)
- 23,686
- Household income
- $50,119
- Rent vs Own
- Severe rent burden
- 969.0
Population outlook (Harris County) Hauer SSP2
- Today (2025)
- 5,571,493 people
- By 2030
- 6,089,821 · +9.3%
- By 2040
- 7,142,806 · +28.2%
- By 2050
- 8,185,864 · +46.9%
- By 2075
- 10,574,329 · +89.8%
- By 2100
- 12,109,958 · +117.4%
Race, ethnicity, and origin ACS 2023
- Neighborhood character
- Predominantly Hispanic (69%)
- Race & ethnicity
- Hispanic / Latino 69% Black 24% Two or more races 22% White 5% Asian 1%
- Hispanic origin (detail)
- Mexican 60%
- Common ancestry
- Swiss 1%
- Foreign-born
- 23% · Canada
- Languages at home
- 39% English-only · Spanish 59% Other Indo-European 1%
Political lean MEDSL · Harris
- 2024 margin
- Lean D (+5.5) · D 52.0% · R 46.4% · Other 1.6%
- 2008→2024 swing
- +3.9pp toward D · 2008: 1.6pp · 2024: 5.5pp
- All cycles
- 2024: D+5.5 2020: D+13.3 2016: D+12.4 2012: D+0.1 2008: D+1.6
Not yet ingested
- Civics
- —
Market trends
- HPI YoY
- ▲ 55.64%
- Current HPI
- 246.5578
- Rent YoY
- ▲ 4.27%
- Metro
- Houston-The Woodlands-Sugar Land, TX
- State GDP YoY
- ▲ 3.95%
- F500 in state
- 110
Industry mix (Fortune 500 HQ in TX)
| Industry | F500 HQs | Revenue |
|---|---|---|
| Energy | 16 | $1,198B |
|
||
| Technology | 5 | $198B |
|
||
| Engineering / Construction | 4 | $72B |
|
||
| Energy Services | 3 | $60B |
|
||
| Utilities | 3 | $41B |
|
||
| Healthcare | 2 | $330B |
|
||
Price history
-28.3% since first listed3 events — show timeline
- 2026-03-23 Price Changed $170,000 HARMLS
- 2025-11-15 Listed $237,000 HARMLS
- 1988-01-02 Sold (Public Records) — Public Records
Property tax history
+9.3%/yrLatest (2025): $3,338 · -7.0% YoY. Source: county tax records.
Cash-flow waterfall
monthlySold comps — $/sqft
last 12 mo · ≤1 miLoading sold comps…