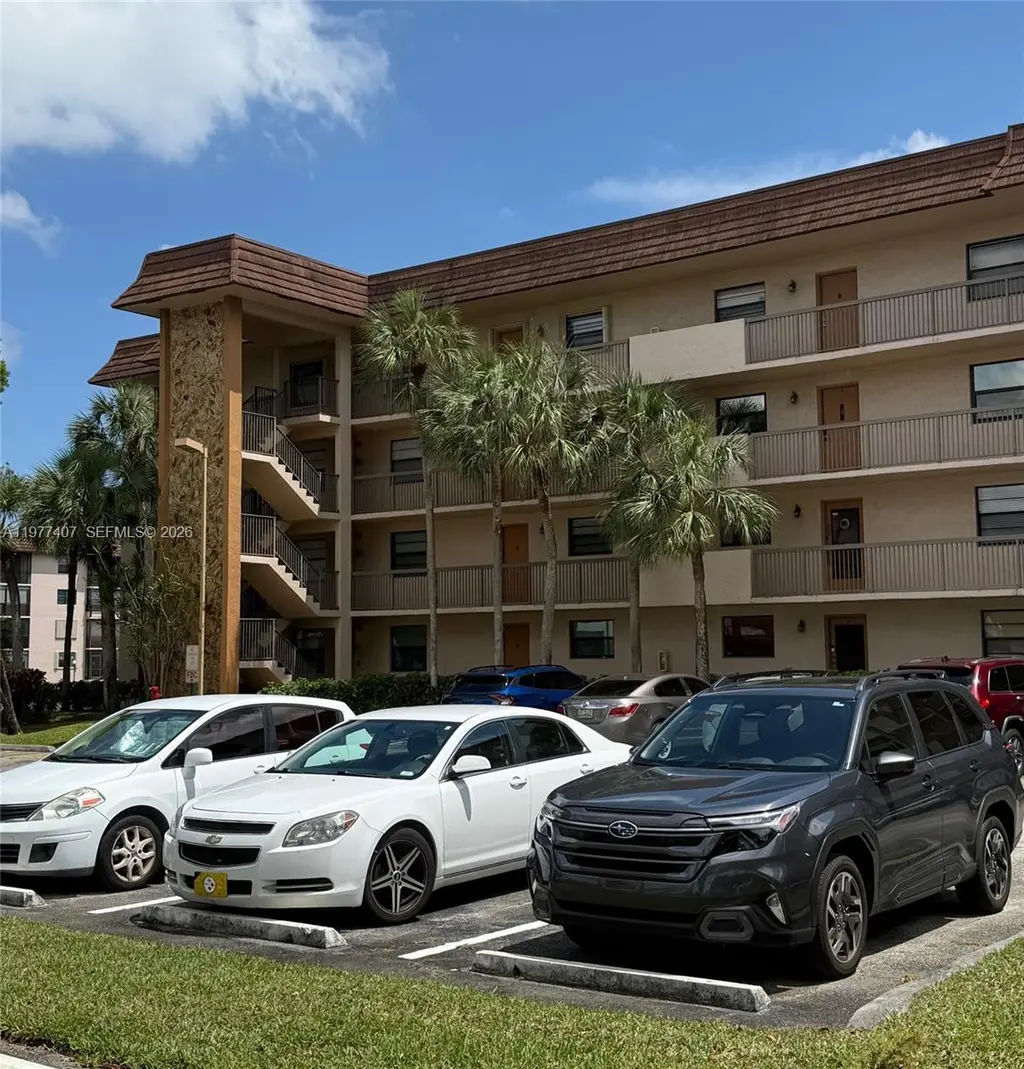
4940 E Sabal Palm Blvd #203 · Tamarac, FL
Flood risk No data
- FEMA flood zone
- —
- Chance of flooding over 30 yrs
- —
- Est. flood insurance / yr
- —
Fire risk No data
- Est. fire insurance / yr
- —
Heat risk No data
- Hot days now (above threshold)
- —
- Hot days in 30 yrs
- —
Wind risk No data
- Chance of severe wind over 30 yrs
- —
Air-quality risk No data
- Unhealthy air days now
- —
- Unhealthy air days in 30 yrs
- —
Risk factors via First Street. Map © Google.
Why this score? — see what drove the D grade
The composite is a weighted blend of 9 inputs, each scored 0–100. Each bar is that input's sub-score; the figure is the points it added to the 100-point composite (weight × sub-score).
- Cash flow +10.7/30.0
- 1% rule +8.4/10.0
- ARV discount +7.5/15.0
- Schools +4.1/10.0
- Livability +3.8/5.0
- DSCR +3.1/10.0
- Condition / age +2.5/5.0
- Rent growth +2.2/5.0
- Appreciation +0.0/10.0
$175,000
🖨 Deal sheet (PDF) 📄 Offer letter ✓ Due diligence
Listing remarks
IMMACULATE TURN KEY 2/2 IN LAKES OF CARRIAGE HILLS. 1270 SQUARE FEET. EXTRA LARGE LAUNDRY ROOM W/ WASHER & DRYER, CAN BE USED AS WORK ROOM. WATER VIEW FROM LIVING ROOM/BALCONY AND MASTER BEDROOM. REAL WOOD KITCHEN CABINETS (EXCEPT SHELVES). CLOSET GALORE + 2 WALK IN CLOSETS. WIRED ALARM SYSTEM. ASSOC. REPRESENTS 55+ VERY QUIET AND 100% SECURE COMMUNITY. MAINTENANCE INCLUDES INTERNET ACCESS + WIFI, BASIC CABLE TV, WATER, BUILDING INSURANCE, MAINTENANCE, LANDSCAPING, 2 HEATED POOLS, TENNIS, VERY ACTIVE CLUBHOUSE, COURTESY BUS, SECURITY PATROL. ELEVATOR DECEMBER 2024. ROOF 2022 NO PETS. NO RENTALS. MINIMUM: 20% DOWNPAYMENT, 600 CREDIT, $40k INCOME
Key facts
- Closet galore
- 2 heated pools
- Wired alarm system
Tags
Property features AI
Finance
- Other: Pets not allowed
- HOA & community: Monthly association fee; Association amenities include clubhouse, elevator(s), pool, and tennis court(s); Association covers common areas, cable TV, internet, grounds and structure maintenance; Senior community
Exterior
- Parking: Guest parking
- Security: Security system (owned)
- Utilities: Cable available
- Home design: Attached property; 4-story building; Entry on level 2; Resale unit; Has view
- Construction: Block construction
- Exterior features: Balcony; Screened balcony; Exterior lighting; Lakefront waterfront; Association heated pool
Interior
- Kitchen: Dishwasher; Electric range; Microwave; Refrigerator; Garbage disposal; Electric water heater
- Bedrooms: Loft
- Flooring: Ceramic tile; Hardwood; Wood
- Bathrooms: 2 full bathrooms
- Heating & cooling: Central heating (electric); Central air conditioning (electric)
- Interior features: Split bedroom layout; Elevator access; Ceramic tile and hardwood/wood flooring
- Laundry & utility: Washer; Dryer
Neighborhood map
What this means for you Summary
Snapshot
- This is a 2-bed/2.0-bath condo listed at $175k.
Deal economics
- At list price, monthly cash flow is $-82 ($-984/yr) — negative.
- To cash-flow at today's rent, offer at most $161k (8.3% below list).
- Meets the 1% rule at list price ($2k rent vs $175k).
- Recommended offer: $161k (8.3% below list) — sets the bar for cash-flow.
- Cap rate 5.7% vs local median 3.9% in Tamarac — top-decile yield for the area; either an underpriced asset or a hidden risk that comps aren't pricing in. Stress-test before assuming the spread holds.
Location & tenants
- Location reads 76/100 on livability (#239 in FL, #3,785 nationally) — a middle-class / working-renter tenant base. Strengths: housing A+, health & safety A+, cost of living A-; Watch: employment C-, amenities F, commute F.
- Broward (suburban): math 42% / reading 53% proficiency, ranked #46 of 73 in FL (top 63%) — families likely to look elsewhere, expect single-tenant / working-renter base with shorter leases.
- Zoned schools: Nova Blanche Forman Elementary (math 35% / reading 55%, grade D-, #1,271 of 2,144 statewide, top 60%, 769 students, 72% FRL); Nova Middle School (math 44% / reading 53%, grade C-, #274 of 571 statewide, top 50%, 1,284 students, 68% FRL); Nova High School (math 22% / reading 56%, grade F, #312 of 667 statewide, top 48%, 2,227 students, 59% FRL) — zoned schools average 66% FRL vs 51% district-wide (15 pts higher); higher-poverty schools than district average — tighter screening recommended.
- Market conditions: Rents soft (-1.4%/yr); 827 active listings in the ZIP; 40 comparable units currently listed for rent nearby; rentals at typical pace (median 26d on market — plan ~3-4 weeks tenant-placement turnaround); 2,111 units permitted in Broward County in 2024 (1,265 in 5+ unit buildings).
- At $2,338/mo this rent would consume 48% of the median local household income ($58k/yr) (locally 2809% of renters already pay >50% of income on rent) — very limited rent-growth headroom before tenants either downsize or default.
Forward outlook
- Local home prices are declining (-3.0%/yr); year-one equity from $1k of loan paydown is wiped out by about $5k of value loss. Plan a longer hold.
- Broward County population projected at +34% by 2050 — long-run rental-demand tailwind backs the buy-and-hold thesis.
Negotiation context
- It's been on market 86 days — a 6% lower offer ($164k) is reasonable based on typical stale-listing flexibility.
- 4 sale attempts with the ask held roughly flat each time — persistent listings suggest the price (not the market) is what's stuck; bring a comps-based counter.
- Current owner paid $46k; list at $175k implies a 281% gain — meaningful room to come down on a strong offer.
Risks & watch-outs
- Watch-outs: HOA is 28% of rent.
Questions for the listing agent
- What do current leases actually rent for vs. the listed asking? Can we see a recent rent roll and the last 12 months of T-12 income?
- It's been on market 86 days. Have you received any prior offers? Is the seller open to a 8% concession, seller financing, or rate buy-down credit?
- What does the HOA fee cover, when was the last increase, and are there any pending special assessments or reserve-fund shortfalls?
- Any open or pending special assessments — roof, HVAC, plumbing, elevator, façade? What's the per-unit balance and payoff schedule, and is the seller paying it off at close or rolling it to the buyer?
- Why hasn't it sold? Are there any deal-killer items the seller is aware of (foundation, flood, title, zoning, code violations)?
- Is there a deadline driving the sale (1031 exchange, divorce, estate, relocation)? That informs how much negotiation room exists.
- Schools are B-rated — typically a magnet for longer-tenancy family renters. What's the average tenant stay here, and is there a school-zone premium baked into asking?
- The area grade is low — what's the realistic commute time and amenity access for the typical tenant pool here? Any planned neighborhood developments (good or bad) we should know about?
- What's the average days-on-market for RENTAL listings here right now (not sales)? A rising rental-DOM trend means longer vacancies and softer asking-rent achievability than the comps imply.
- What's the recent tenant-quality profile in this submarket — average credit score on applications, eviction rate, late-payment / NSF rate, and stable-employment percentage? A property-management company in the area should have these aggregated.
- How much new apartment / multifamily construction is in the pipeline within 1–3 miles? Heavy new supply (>2% of stock underway) typically softens rents 12–24 months out; light construction supports rent growth.
Investment metrics
- 1% rule
- 1.34% ✓
- Cap rate
- 5.73%
- Cash-on-cash
- -2.01%
- DSCR
- 0.91
- GRM
- 6.2
CMA / ARV
No comps found within radius.
Projected returns pro-forma
-3.0% appreciation · 0.0% rent growth · sell at horizon
- IRR
- -25.0%
- Equity multiple
- 0.18×
- Total profit
- $-39,954
- Equity at exit
- $26,093
- IRR
- -49.6%
- Equity multiple
- -0.35×
- Total profit
- $-66,056
- Equity at exit
- $15,131
Cash invested: $49,000 (down + closing). Projections, not guarantees.
Landlord ↔ Tenant lean methodology
- Overall (STATE)
- 87 Strongly Landlord-Friendly
- State Florida
- 87 Strongly Landlord-Friendly · R+3
- County
- — inherits STATE
- City
- — inherits STATE
ZIP-level market 33319
- Rents YoY
- -1.4%
- Active inventory
- 827
- Price-to-rent
- 6.2×
Monthly cashflow live
- Estimated rent
- $2,338 high interval (Pro) →
- Mortgage (P&I)
- −$918
- Tax from tax record
- −$278 /mo · $3,341/yr
- Insurance
- −$73
- HOA
- −$660
- Vacancy / Maint / Mgmt
- −$491
- Net cashflow
- $-82
Break-even live
Sensitivity live
| Price | -10% $17 | -5% $-32 | +0% $-82 | +5% $-132 | +10% $-181 |
|---|---|---|---|---|---|
| Rent | -10% $-267 | -5% $-174 | +0% $-82 | +5% $10 | +10% $103 |
| Rate | -1.0pp $6 | -0.5pp $-37 | base $-82 | +0.5pp $-127 | +1.0pp $-173 |
UW: 25.0% down · 7.5% · 30yr · 1.5% tax · 5.0% vac · 8.0% maint · 8.0% mgmt
Financing live
Cash to close
- Down payment
- $43,750
- Closing costs
- $5,250
- Reserves months
- —
- Total cash needed
- —
Loan-product check · same deal, 3 products live
Conventional
25% down · 7.5% · 30yr
- Down + closing
- —
- Monthly P&I
- —
- Monthly cashflow
- —
- DSCR
- —
- Eligible?
- —
Personal DTI + credit; lowest rate.
DSCR
20% down · 8.5% · 30yr
- Down + closing
- —
- Monthly P&I
- —
- Monthly cashflow
- —
- DSCR
- —
- Eligible?
- —
No personal income docs; deal must DSCR.
Hard money
10% down · 12.0% · 12mo
- Down + closing
- —
- Monthly P&I
- —
- Monthly cashflow
- —
- DSCR
- —
- Eligible?
- —
Short-term bridge; refi at stabilization.
Rent comps 40 comps
| Address | Beds | Baths | Sqft | Rent | $/sqft | DOM | Units | Dist |
|---|---|---|---|---|---|---|---|---|
| 6075 N Sabal Palm Blvd #210 Tamarac, FL | 2.0 | 2.0 | 970 | $1,900 | $1.96 | 22d | 1 | 0.23mi |
| 4717 NW 58th St Tamarac, FL | 2.0 | 2.0 | 1354 | $2,600 | $1.92 | 9d | 1 | 0.26mi |
| 5780 Rock Island Rd #362 Tamarac, FL | 2.0 | 2.0 | 1030 | $1,900 | $1.84 | 26d | 1 | 0.38mi |
| 6963 SW 19th St Pompano Beach, FL | 2.0 | 1.0 | 1054 | $1,700 | $1.61 | 26d | 1 | 0.39mi |
| 1720 SW 64th Ter North Lauderdale, FL | 3.0 | 2.0 | 1248 | $3,600 | $2.88 | 13d | 1 | 0.40mi |
| 2024 Champions Way North Lauderdale, FL | 2.0 | 2.0 | 948 | $2,500 | $2.64 | 26d | 1 | 0.45mi |
| 5646 Rock Island Rd #198 Tamarac, FL | 2.0 | 2.0 | 1030 | $2,150 | $2.09 | 26d | 1 | 0.46mi |
| 1812 Adventure Pl #1812 North Lauderdale, FL | 2.0 | 1.0 | 955 | $2,200 | $2.30 | 26d | 1 | 0.46mi |
| 5628 Rock Island Rd Tamarac, FL | 1.0–2.0 | 1.0–2.0 | 867 | $2,000 | $2.31 | 7d | 2 | 0.48mi |
| 4945 NW 55th Ct Tamarac, FL | 2.0 | 2.0 | 1579 | $2,850 | $1.80 | 6d | 1 | 0.52mi |
| 1850 Adventure Pl North Lauderdale, FL | 3.0 | 2.0 | 1336 | $2,750 | $2.06 | 26d | 1 | 0.52mi |
| 4934 NW 55th Ct Tamarac, FL | 2.0 | 1.0 | 1059 | $1,895 | $1.79 | 16d | 1 | 0.52mi |
| 6056 SW 19th Pl North Lauderdale, FL | 2.0 | 2.5 | 1161 | $2,350 | $2.02 | 26d | 1 | 0.53mi |
| 1937 SW 60th Ter #1937 North Lauderdale, FL | 3.0 | 2.5 | 1640 | $2,650 | $1.62 | 26d | 1 | 0.53mi |
| 1958 SW 60th Ter Unit 1958 North Lauderdale, FL | 3.0 | 2.5 | 1640 | $2,450 | $1.49 | 0d | 1 | 0.54mi |
| 1958 SW 60th Ter Unit 1958 North Lauderdale, FL | 3.0 | 2.5 | 1640 | $2,600 | $1.59 | 26d | 1 | 0.54mi |
| 1956 SW 60th Ter Unit 1956 North Lauderdale, FL | 3.0 | 2.5 | 1640 | $2,600 | $1.59 | 14d | 1 | 0.54mi |
| 4941 NW 55th St Tamarac, FL | 2.0 | 2.0 | 1639 | $2,700 | $1.65 | 26d | 1 | 0.55mi |
| 5476 Gate Lake Rd #5476 Tamarac, FL | 3.0 | 2.5 | 1811 | $2,900 | $1.60 | 3d | 1 | 0.55mi |
| 6060 SW 19th Ct North Lauderdale, FL | 2.0 | 3.0 | 1120 | $2,200 | $1.96 | 26d | 1 | 0.55mi |
| 6872 SW 15th St Pompano Beach, FL | 2.0 | 1.0 | 919 | $2,400 | $2.61 | 15d | 1 | 0.57mi |
| 6081 SW 19th St North Lauderdale, FL | 2.0 | 2.5 | 1161 | $2,290 | $1.97 | 6d | 1 | 0.57mi |
| 6081 SW 19th St North Lauderdale, FL | 2.0 | 2.5 | 1161 | $2,499 | $2.15 | 26d | 1 | 0.57mi |
| 5424 Gate Lake Rd #5424 Tamarac, FL | 3.0 | 2.5 | 1811 | $3,000 | $1.66 | 26d | 1 | 0.58mi |
| 1984 SW 60th Ave Unit 1984 North Lauderdale, FL | 3.0 | 2.5 | 1640 | $2,650 | $1.62 | 26d | 1 | 0.62mi |
| 1962 SW 60th Ave North Lauderdale, FL | 3.0 | 3.0 | 1280 | $2,500 | $1.95 | 21d | 1 | 0.62mi |
| 1954 SW 60th Ave Unit 1 North Lauderdale, FL | 2.0 | 2.0 | 1120 | $2,550 | $2.28 | 26d | 1 | 0.62mi |
| 1908 Players Pl North Lauderdale, FL | 3.0 | 2.0 | 1336 | $1,150 | $0.86 | 26d | 1 | 0.63mi |
| 6009 SW 19th St North Lauderdale, FL | 3.0 | 2.0 | 1600 | $2,900 | $1.81 | 19d | 1 | 0.63mi |
| 1904 SW 60th Ave North Lauderdale, FL | 3.0 | 2.5 | 1640 | $2,900 | $1.77 | 5d | 1 | 0.64mi |
| 1904 SW 60th Ave North Lauderdale, FL | 3.0 | 2.0 | 1600 | $2,900 | $1.81 | 19d | 1 | 0.64mi |
| 1904 SW 60th Ave North Lauderdale, FL | 3.0 | 2.5 | 1640 | $2,900 | $1.77 | 18d | 1 | 0.64mi |
| 7174 Sportsmans Dr North Lauderdale, FL | 2.0 | 2.0 | 1186 | $2,400 | $2.02 | 26d | 1 | 0.65mi |
| 1953 Players Pl #1953 North Lauderdale, FL | 3.0 | 2.0 | 1186 | $2,400 | $2.02 | 26d | 1 | 0.66mi |
| 5843 Woodlands Blvd Unit 5843 Tamarac, FL | 3.0 | 2.5 | 1373 | $2,900 | $2.11 | 26d | 1 | 0.69mi |
| 5584 NW 59th Pl Tamarac, FL | 3.0 | 2.5 | 1488 | $2,700 | $1.81 | 26d | 1 | 0.69mi |
| 4451 Treehouse Ln Unit 18E Tamarac, FL | 3.0 | 2.0 | 1167 | $2,200 | $1.89 | 12d | 1 | 0.70mi |
| 4451 Treehouse Ln Unit 18E Tamarac, FL | 3.0 | 2.0 | 1167 | $2,225 | $1.91 | 12d | 1 | 0.70mi |
| 6711 Boulevard of Champions North Lauderdale, FL | 1.0 | 1.0 | 1216 | $1,800 | $1.48 | 26d | 1 | 0.71mi |
| 4447 Treehouse Ln Unit 17C Tamarac, FL | 2.0 | 1.0 | 1013 | $1,899 | $1.87 | 0d | 1 | 0.71mi |
HOA detail condo
- Monthly dues
- $660 · $7,920/yr
- Likely covers
- waterinternetcablelandscapinginsurancepoolsecurity
- Assessments
- None detected in remarks — confirm with the listing agent.
Listing history 26 events
-
2026-06-21days on market $175,000 Active 86 DOM
-
2026-06-18days on market $175,000 Active 83 DOM
-
2026-06-17days on market $175,000 Active 82 DOM
-
2026-06-16days on market $175,000 Active 81 DOM
-
2026-06-15days on market $175,000 Active 80 DOM
-
2026-06-13days on market $175,000 Active 78 DOM
-
2026-06-09days on market $175,000 Active 74 DOM
-
2026-06-08days on market $175,000 Active 73 DOM
-
2026-06-07days on market $175,000 Active 72 DOM
-
2026-06-04days on market $175,000 Active 69 DOM
-
2026-06-03days on market $175,000 Active 68 DOM
-
2026-06-02days on market $175,000 Active 67 DOM
-
2026-06-01days on market $175,000 Active 66 DOM
-
2026-05-31days on market $175,000 Active 65 DOM
-
2026-03-26$175,000 Active
-
2026-02-27historical
-
2026-01-31price $185,000
-
2026-01-16price $190,000
-
2026-01-14$212,000 Active
-
2025-08-13historical
-
2025-03-18status Active
-
2025-03-17price $222,000
-
2025-02-12$235,000 Active
-
2013-04-04soldstatus $45,900
-
2013-04-04soldstatus $45,900
-
1996-05-07soldstatus $51,500
ⓘ Source: listings_history table (triggers on properties + properties_extension) + one-shot
backfill from property_details.listing_events for pre-trigger history.
Tax reassessment forecast FL · Resets to sale price
- Current annual tax
- $3,341 · $278/mo
- Projected year-2 tax
- $3,341 · $278/mo
- Expected delta
- $0/yr ($0/mo · 0.0%)
ⓘ Screening estimate from a state-policy table — verify with the county assessor before closing.
Nearby sold comps map
Loading sold comps map…
Walkable amenities ~0.75 mi
Loading nearby amenities…
Taxation est. · year 1
- Rental income
- $28,057
- − Mortgage interest
- −$9,803
- − Property taxes
- −$3,341
- − Insurance
- −$875
- − Repairs & maintenance
- −$2,245
- − Management
- −$2,245
- − HOA
- −$7,920
- − Depreciation
- −$5,091
- Taxable loss
- −$3,462
- Est. tax savings @ 24.0%
- +$831
- After-tax cash flow
- $-153/yr
For passive investors: Depreciation is non-cash, so a rental often shows a tax loss while cash-flowing — sheltering income. Rental losses are passive: they offset passive income freely, and up to $25,000/yr can offset ordinary (W-2) income if you actively participate and your MAGI is under $100k (phasing out to $0 by $150k); unused losses carry forward. On sale, claimed depreciation is recaptured at up to 25%, and gains may owe capital-gains tax (a 1031 exchange can defer both). Figures are a year-1 estimate at your 24.0% rate — not tax advice; consult a CPA.
Schools (NCES district)
- District
- Broward
- NCES district ID
- 1200180
- Math proficiency
- 42% ▼ -18.00%
- Reading proficiency
- 53% ▼ -5.00%
- Median HH income
- $52,139
- Composite
- 40.88/100
- National rank
- #3621
- State rank
- #46 of 73 in FL
Livability — Tamarac
- Score
- 76/100
- State rank
- #239
- US rank
- #3785
Category grades
Schools grade is shown separately in the Schools card above.
Census & demographics
- Census place
- Tamarac, FL
- County
- Broward County · 1,963,430 people
- City population
- 105,666
- Metro
- Miami-Fort Lauderdale-Pompano Beach, FL
- Population (ZIP)
- 54,450
- Household income
- $58,388
- Rent vs Own
- Severe rent burden
- 2809.0
Population outlook (Broward County) Hauer SSP2
- Today (2025)
- 2,207,033 people
- By 2030
- 2,360,704 · +7.0%
- By 2040
- 2,661,208 · +20.6%
- By 2050
- 2,946,698 · +33.5%
- By 2075
- 3,602,273 · +63.2%
- By 2100
- 3,970,984 · +79.9%
Race, ethnicity, and origin ACS 2023
- Neighborhood character
- Diverse neighborhood (Simpson 0.58)
- Race & ethnicity
- Black 61% Hispanic / Latino 17% White 15% Two or more races 11% Asian 4%
- Hispanic origin (detail)
- Puerto Rican 4% Cuban 2% Dominican 1%
- Common ancestry
- Hispanic 13% Romanian 1% Italian 1%
- Foreign-born
- 46% · Canada, Jamaica, Vietnam
- Languages at home
- 64% English-only · Spanish 15% French/Haitian/Cajun 15% Other Indo-European 2%
Political lean MEDSL · Broward
- 2024 margin
- D (+17.0) · D 58.0% · R 41.0%
- 2008→2024 swing
- -17.8pp toward R · 2008: 34.7pp · 2024: 17.0pp
- All cycles
- 2024: D+17.0 2020: D+29.8 2016: D+35.0 2012: D+34.9 2008: D+34.7
Not yet ingested
- Civics
- —
Market trends
- HPI YoY
- ▼ -202.84%
- Current HPI
- 328.4307
- Rent YoY
- ▼ -1.38%
- Metro
- Miami-Fort Lauderdale-Pompano Beach, FL
- State GDP YoY
- ▲ 3.28%
- F500 in state
- 36
Industry mix (Fortune 500 HQ in FL)
| Industry | F500 HQs | Revenue |
|---|---|---|
| Industrial Technology | 2 | $29B |
|
||
| Insurance | 2 | $17B |
|
||
| Retail | 1 | $60B |
|
||
| Technology Distribution | 1 | $58B |
|
||
| Homebuilding | 1 | $35B |
|
||
| Technology Manufacturing | 1 | $35B |
|
||
Price history
+239.8% since first listed12 events — show timeline
- 2026-03-26 Listed $175,000 MARMLS
- 2026-02-27 Listing Removed — MARMLS
- 2026-01-31 Price Changed $185,000 MARMLS
- 2026-01-16 Price Changed $190,000 MARMLS
- 2026-01-14 Listed $212,000 MARMLS
- 2025-08-13 Listing Removed — MARMLS
- 2025-03-18 Relisted — MARMLS
- 2025-03-17 Price Changed $222,000 MARMLS
- 2025-02-12 Listed $235,000 MARMLS
- 2013-04-04 Sold (MLS) $45,900 MARMLS
- 2013-04-04 Sold (Public Records) $45,900 Public Records
- 1996-05-07 Sold (Public Records) $51,500 Public Records
Property tax history
+14.0%/yrLatest (2025): $3,341 · +5.6% YoY. Source: county tax records.
Cash-flow waterfall
monthlySold comps — $/sqft
last 12 mo · ≤1 miLoading sold comps…