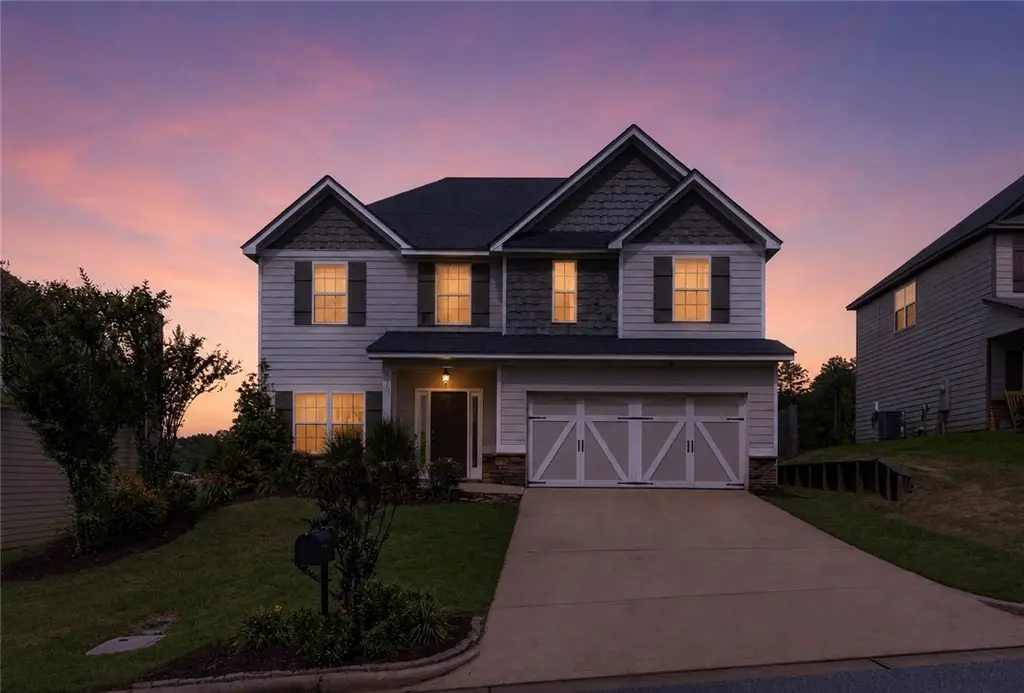
2907 Ashley Ln · Opelika, AL
Flood risk 1/10 · Minimal
- FEMA flood zone
- X (unshaded)
- Chance of flooding over 30 yrs
- 0.0%
- Est. flood insurance / yr
- $507 – $1,088
Fire risk 4/10 · Minor
- Est. fire insurance / yr
- $916 – $1,700
Heat risk 6/10 · Moderate
- Hot days now (above 104°F)
- 7 days/yr
- Hot days in 30 yrs
- 20 days/yr
Wind risk 6/10 · Moderate
- Chance of severe wind over 30 yrs
- 59.0%
Air-quality risk 2/10 · Minimal
- Unhealthy air days now
- 1 days/yr
- Unhealthy air days in 30 yrs
- 2 days/yr
Risk factors via First Street. Map © Google.
Why this score? — see what drove the C- grade
The composite is a weighted blend of 9 inputs, each scored 0–100. Each bar is that input's sub-score; the figure is the points it added to the 100-point composite (weight × sub-score).
- Cash flow +18.3/30.0
- ARV discount +9.7/15.0
- DSCR +5.7/10.0
- Rent growth +4.1/5.0
- 1% rule +3.8/10.0
- Livability +3.2/5.0
- Schools +2.9/10.0
- Condition / age +2.5/5.0
- Appreciation +0.0/10.0
$343,000
🖨 Deal sheet 📄 Offer letter ✓ Due diligence
Listing remarks MLS
Crepe Myrtle Plan - Lot 60: 4BR, 2.5Bth – Now featuring Smart Home Technology and Builder's Signature Game Day Porch with built in HDMI wiring! This plan features Granite Counters with drop-in sinks. Open Concept flows from a beautiful entry foyer with hardwoods leading to a grand kitchen boasting a huge Island, SS appliances & b’fast area open to GR! Spacious GR w. fireplace. Formal DR w. Coffered Ceiling + Wainscoting. Mudroom w. cubbies. Master Suite w. double vanities, separate shower, & garden tub. 3 Additional Spacious bedrooms upstairs that share a full hall bath. Must See!
Key facts
- 8,712 sq ft lot
- 2 garage spots
- Built 2017
Property features AI
Finance
- Other: Located in the Anderson Lakes subdivision; Directions: From I-85 take Exit 64 toward Opelika; turn onto Anderson Road, enter Lakes at Anderson Road via Anderson Lakes Road, follow to Ashley Lane, turn right and continue to 2907 Ashley Ln in the cul-de-sac.
- HOA & community: Association amenities: Other
Exterior
- Parking: Attached garage with 2 spaces
- Utilities: Sewer connected
- Home design: Two-story residential home
- Construction: Cement siding; Slab foundation
- Exterior features: Privacy fencing
Interior
- Kitchen: Convection oven; Dishwasher; Gas cooktop; Microwave
- Flooring: Carpet; Tile; Wood
- Bathrooms: 2 full bathrooms; 1 half bathroom; 2 bathrooms on the main level
- Heating & cooling: Heat pump heating; Central electric air conditioning
- Interior features: See remarks (other interior features)
Neighborhood map
What this means for you Summary
Snapshot
- This is a 4-bed/2.5-bath single-family listed at $343k.
Deal economics
- At list price, monthly cash flow is $314 ($4k/yr) — positive.
- The deal already cash-flows at list — no discount required.
- To meet the 1% rule (rent ≥ 1% of price), the offer needs to be $301k (12.3% below list).
- Recommended offer: $301k (12.3% below list) — sets the bar for 1% rule.
- Cap rate 7.4% vs local median 3.8% in Opelika — top-decile yield for the area; either an underpriced asset or a hidden risk that comps aren't pricing in. Stress-test before assuming the spread holds.
Location & tenants
- Location reads 63/100 on livability (#188 in AL) — a middle-class / working-renter tenant base. Strengths: cost of living A+, housing A+; Watch: schools C-, employment C-, crime F.
- Opelika City (urban): math 27% / reading 43% proficiency, ranked #45 of 129 in AL (top 35%) — families likely to look elsewhere, expect single-tenant / working-renter base with shorter leases; 62% free/reduced lunch — lower-income household profile, screen leases tightly.
- Market conditions: Rents rising fast (+6.2%/yr); 532 active listings in the ZIP; 4 comparable units currently listed for rent nearby; rentals lingering (median 44d on market — plan ~5-8 weeks vacancy on turnover, expect pricing pressure); 75% of comp listings sitting > 30 days — soft ceiling on asking rent; 1,858 units permitted in Lee County in 2024 (113 in 5+ unit buildings).
- At $3,008/mo this rent would consume 58% of the median local household income ($62k/yr) (locally 1025% of renters already pay >50% of income on rent) — very limited rent-growth headroom before tenants either downsize or default.
Forward outlook
- Local home prices are declining (-3.0%/yr); year-one equity from $2k of loan paydown is wiped out by about $10k of value loss. Plan a longer hold.
- Lee County population projected at +54% by 2050 — long-run rental-demand tailwind backs the buy-and-hold thesis.
Negotiation context
- Only 7 days on market — expect competitive offers; lowballing is unlikely to land.
- Current owner paid $215k; list at $343k implies a 60% gain — meaningful room to come down on a strong offer.
Risks & watch-outs
- Climate carrying-cost: major wind risk, 59% chance of damaging wind over 30y; extreme-heat days projected 7→20/yr by 2055 (HVAC capex compounding) — expect insurance premiums to compound above CPI over the hold.
Questions for the listing agent
- Is there a deadline driving the sale (1031 exchange, divorce, estate, relocation)? That informs how much negotiation room exists.
- Crime grade is F in this area — have there been break-ins, vandalism, or insurance claims at this property in the last 3 years? What carrier currently insures it and at what premium?
- What's the average days-on-market for RENTAL listings here right now (not sales)? A rising rental-DOM trend means longer vacancies and softer asking-rent achievability than the comps imply.
- What's the recent tenant-quality profile in this submarket — average credit score on applications, eviction rate, late-payment / NSF rate, and stable-employment percentage? A property-management company in the area should have these aggregated.
- How much new for-sale + rental construction is in the pipeline within 1–3 miles? Heavy new supply typically softens prices + rents 12–24 months out; constrained supply supports both.
Investment metrics
- 1% rule
- 0.88% ✗
- Cap rate
- 7.39%
- Cash-on-cash
- 3.92%
- DSCR
- 1.17
- GRM
- 9.5
CMA / ARV
- ARV (on-the-fly)
- $360,396
- Comps found
- 10
Show comp detail 10 sales within ~0.75 mi
| Address | Dist | Beds/Ba | Sqft | Sold | Price | $/sf | Match |
|---|---|---|---|---|---|---|---|
| 2907 Hannah Way | 0.07mi | 4/2.5 | 2,638 (+3%) | 12mo | $346,000 | $131 | 82 |
| 2504 Rocky Point Dr | 0.20mi | 4/2.5 | 2,331 (-9%) | 1mo | $350,000 | $150 | 75 |
| 2501 Harding Ct | 0.15mi | 4/3.0 | 2,272 (-11%) | 2mo | $368,350 | $162 | 71 |
| 2501 Harding Ct #12 | 0.18mi | 4/3.0 | 2,272 (-11%) | 2mo | $368,350 | $162 | 70 |
| 2701 Carriage House Ln | 0.29mi | 4/2.5 | 2,593 (+1%) | 20mo | $327,000 | $126 | 68 |
| 2507 Rocky Point Dr | 0.23mi | 4/2.5 | 2,516 (-2%) | 24mo | $339,900 | $135 | 67 |
| 2410 Rocky Point Dr | 0.23mi | 4/2.5 | 2,406 (-6%) | 22mo | $305,000 | $127 | 61 |
| 2513 Northtowne Dr | 0.31mi | 5/3.0 (+1) | 2,840 (+11%) | 0mo | $400,000 | $141 | 60 |
| 2705 Carriage House Ln | 0.27mi | 4/2.5 | 2,331 (-9%) | 24mo | $319,000 | $137 | 53 |
| 2097 Andrews Rd | 0.66mi | 4/2.5 | 2,923 (+14%) | 24mo | $442,000 | $151 | 25 |
Match score weights: distance 35% · size 25% · config 20% · recency 20%. Top-matched comps best support the ARV.
Projected returns pro-forma
-3.0% appreciation · 6.25% rent growth · sell at horizon
- IRR
- -7.0%
- Equity multiple
- 0.73×
- Total profit
- $-25,595
- Equity at exit
- $51,142
- IRR
- 5.9%
- Equity multiple
- 1.49×
- Total profit
- $47,408
- Equity at exit
- $29,656
Cash invested: $96,040 (down + closing). Projections, not guarantees.
Landlord ↔ Tenant lean methodology
- Overall (STATE)
- 90 Strongly Landlord-Friendly
- State Alabama
- 90 Strongly Landlord-Friendly · R+15
- County
- — inherits STATE
- City
- — inherits STATE
ZIP-level market 36801
- Home prices YoY
- -30.9%
- Rents YoY
- 6.2%
- Active inventory
- 532
- Price-to-rent
- 9.5×
Monthly cashflow live
- Estimated rent
- $3,008 medium interval (Pro) →
- Mortgage (P&I)
- −$1,799
- Tax from tax record
- −$121 /mo · $1,455/yr
- Insurance
- −$143
- HOA
- −$0
- Vacancy / Maint / Mgmt
- −$632
- Net cashflow
- $314
Break-even live
UW: 25.0% down · 7.5% · 30yr · 1.5% tax · 5.0% vac · 8.0% maint · 8.0% mgmt
Financing live
Cash to close
- Down payment
- $85,750
- Closing costs
- $10,290
- Reserves months
- —
- Total cash needed
- —
Loan-product check · same deal, 3 products live
Conventional
25% down · 7.5% · 30yr
- Down + closing
- —
- Monthly P&I
- —
- Monthly cashflow
- —
- DSCR
- —
- Eligible?
- —
Personal DTI + credit; lowest rate.
DSCR
20% down · 8.5% · 30yr
- Down + closing
- —
- Monthly P&I
- —
- Monthly cashflow
- —
- DSCR
- —
- Eligible?
- —
No personal income docs; deal must DSCR.
Hard money
10% down · 12.0% · 12mo
- Down + closing
- —
- Monthly P&I
- —
- Monthly cashflow
- —
- DSCR
- —
- Eligible?
- —
Short-term bridge; refi at stabilization.
Rent comps 4 comps
| Address | Beds | Baths | Sqft | Rent | $/sqft | DOM | Units | Dist |
|---|---|---|---|---|---|---|---|---|
| 1785 Hanson St Opelika, AL | 4.0 | 3.5 | 2561 | $3,500 | $1.37 | 13d | 1 | 1.32mi |
| 1771 Hanson St Opelika, AL | 4.0 | 3.5 | 2637 | $3,500 | $1.33 | 44d | 1 | 1.33mi |
| 1743 Hanson St Opelika, AL | 3.0 | 2.5 | 2235 | $3,050 | $1.36 | 44d | 1 | 1.35mi |
| 1729 Hanson St Opelika, AL | 3.0 | 2.5 | 2012 | $2,750 | $1.37 | 44d | 1 | 1.36mi |
Listing history 10 events
-
2026-06-19days on market $343,000 Active 7 DOM
-
2026-06-18days on market $343,000 Active 6 DOM
-
2026-06-17price $343,000 Active 5 DOM
-
2026-06-17days on market $350,000 Active 5 DOM
-
2026-06-16days on market $350,000 Active 4 DOM
-
2026-06-15days on market $350,000 Active 3 DOM
-
2026-06-14statusdays on market $350,000 Active 1 DOM
-
2026-06-13days on market $350,000 Coming Soon 3 DOM
-
2026-06-10remarks 693-char remark
-
2026-06-10$350,000 Coming Soon 1 DOM
ⓘ Source: listings_history table (triggers on properties + properties_extension) + one-shot
backfill from property_details.listing_events for pre-trigger history.
Tax reassessment forecast AL · Resets to sale price
- Current annual tax
- $1,455 · $121/mo
- Projected year-2 tax
- $1,455 · $121/mo
- Expected delta
- $0/yr ($0/mo · 0.0%)
ⓘ Screening estimate from a state-policy table — verify with the county assessor before closing.
Climate risk First Street
- Flood 1/10 Low FEMA zone X (unshaded) · 0% chance over 30 yrs
- Wildfire 4/10 Moderate
- Heat 6/10 Major 7 d/yr ≥104°F today · 20 d/yr by 30 yrs out
- Wind 6/10 Major 59% chance of damaging wind over 30 yrs
- Air quality 2/10 Low 1 unhealthy d/yr today · 2 by 30 yrs out
Nearby sold comps map
Loading sold comps map…
Walkable amenities ~0.75 mi
Loading nearby amenities…
Taxation est. · year 1
- Rental income
- $36,098
- − Mortgage interest
- −$19,213
- − Property taxes
- −$1,455
- − Insurance
- −$1,715
- − Repairs & maintenance
- −$2,888
- − Management
- −$2,888
- − Depreciation
- −$9,978
- Taxable loss
- −$2,039
- Est. tax savings @ 24.0%
- +$489
- After-tax cash flow
- $4,252/yr
For passive investors: Depreciation is non-cash, so a rental often shows a tax loss while cash-flowing — sheltering income. Rental losses are passive: they offset passive income freely, and up to $25,000/yr can offset ordinary (W-2) income if you actively participate and your MAGI is under $100k (phasing out to $0 by $150k); unused losses carry forward. On sale, claimed depreciation is recaptured at up to 25%, and gains may owe capital-gains tax (a 1031 exchange can defer both). Figures are a year-1 estimate at your 24.0% rate — not tax advice; consult a CPA.
Schools (NCES district)
- District
- Opelika City
- NCES district ID
- 0102580
- Math proficiency
- 27% ▼ -25.00%
- Reading proficiency
- 43% ▼ -1.00%
- Median HH income
- $40,081
- Composite
- 29.34/100
- National rank
- #6541
- State rank
- #45 of 129 in AL
Livability — Opelika
- Score
- 63/100
- State rank
- #188
- US rank
- #15556
Category grades
Schools grade is shown separately in the Schools card above.
Census & demographics
- Census place
- Opelika, AL
- County
- Lee County · 144,175 people
- City population
- 45,973
- Metro
- Auburn-Opelika, AL
- Population (ZIP)
- 25,438
- Household income
- $62,414
- Rent vs Own
- Severe rent burden
- 1025.0
Population outlook (Lee County) Hauer SSP2
- Today (2025)
- 196,440 people
- By 2030
- 217,417 · +10.7%
- By 2040
- 259,467 · +32.1%
- By 2050
- 301,557 · +53.5%
- By 2075
- 402,186 · +104.7%
- By 2100
- 474,503 · +141.6%
Race, ethnicity, and origin ACS 2023
- Neighborhood character
- Diverse neighborhood (Simpson 0.58)
- Race & ethnicity
- White 53% Black 37% Hispanic / Latino 8% Two or more races 3% Asian 1%
- Hispanic origin (detail)
- Mexican 2% Cuban 1%
- Common ancestry
- Slovak 3% Italian 2% Serbian 2%
- Foreign-born
- 4% · Canada, Vietnam
- Languages at home
- 94% English-only · Spanish 4% Chinese 1%
Political lean MEDSL · Lee
- 2024 margin
- Strong R (+27.8) · D 35.5% · R 63.3% · Other 1.2%
- 2008→2024 swing
- -8.1pp toward R · 2008: -19.8pp · 2024: -27.8pp
- All cycles
- 2024: R+27.8 2020: R+20.1 2016: R+23.1 2012: R+19.9 2008: R+19.8
Not yet ingested
- Civics
- —
Market trends
- HPI YoY
- ▼ -116.80%
- Current HPI
- 261.6632
- Rent YoY
- ▲ 6.25%
- Metro
- Auburn-Opelika, AL
- State GDP YoY
- ▲ 2.94%
- F500 in state
- 4
Industry mix (Fortune 500 HQ in AL)
| Industry | F500 HQs | Revenue |
|---|---|---|
| Financial Services | 1 | $8B |
|
||
| Healthcare | 1 | $5B |
|
||
Price history
+62.9% since first listed3 events — show timeline
- 2026-06-09 Coming Soon $350,000 LCMLS
- 2017-09-08 Sold (MLS) $214,900 LCMLS
- 2017-05-09 Listed $214,900 LCMLS
Property tax history
+14.6%/yrLatest (2025): $1,455 · +0.0% YoY. Source: county tax records.
Cash-flow waterfall
monthlySold comps — $/sqft
last 12 mo · ≤1 miLoading sold comps…