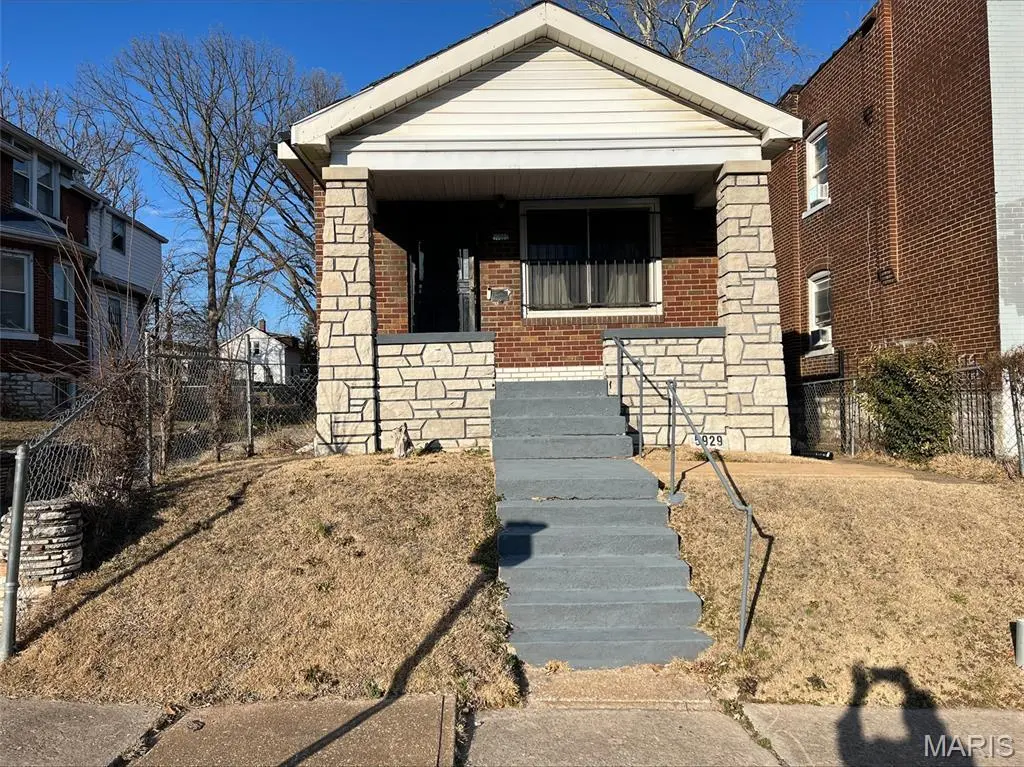
5929 Lucille Ave · St. Louis, MO
Flood risk 1/10 · Minimal
- FEMA flood zone
- X (unshaded)
- Chance of flooding over 30 yrs
- 0.0%
- Est. flood insurance / yr
- $473 – $860
Fire risk 1/10 · Minimal
- Est. fire insurance / yr
- $1,054 – $1,958
Heat risk 5/10 · Moderate
- Hot days now (above 107°F)
- 7 days/yr
- Hot days in 30 yrs
- 21 days/yr
Wind risk 2/10 · Minimal
- Chance of severe wind over 30 yrs
- 1.0%
Air-quality risk 4/10 · Minor
- Unhealthy air days now
- 4 days/yr
- Unhealthy air days in 30 yrs
- 5 days/yr
Risk factors via First Street. Map © Google.
Why this score? — see what drove the B+ grade
The composite is a weighted blend of 9 inputs, each scored 0–100. Each bar is that input's sub-score; the figure is the points it added to the 100-point composite (weight × sub-score).
- Cash flow +30.0/30.0
- 1% rule +10.0/10.0
- DSCR +10.0/10.0
- ARV discount +8.5/15.0
- Appreciation +6.9/10.0
- Rent growth +3.7/5.0
- Livability +2.5/5.0
- Condition / age +2.5/5.0
- Schools +1.2/10.0
$35,400
🖨 Deal sheet 📄 Offer letter ✓ Due diligence
Listing remarks MLS
Whether you are ready to stop renting and own something of your own, or an investor ready for your next cash flow opportunity...5929 Lucille Ave is ready for you! Affordable entry point, functional layout, with the possibility of a 2nd bedroom/office space. Located in Walnut Park West which offers the opportunity for buyers that think ahead and move smart. Starter home. Downsize opportunity. Rental potential. This is where strategy meets opportunity! Showings start now Let's get you inside to see for yourself!
Key facts
- 3,123 sq ft lot
- Built 1927
- Listed 96 days
Neighborhood map
What this means for you Summary
Snapshot
- This is a 1-bed/1.0-bath single-family listed at $35k.
Deal economics
- At list price, monthly cash flow is $614 ($7k/yr) — positive.
- The deal already cash-flows at list — no discount required.
- Meets the 1% rule at list price ($1k rent vs $35k).
- Recommended offer: $32k (9.0% below list) — sets the bar for market timing.
- Cap rate 27.1% vs local median 5.0% in St. Louis — top-decile yield for the area; either an underpriced asset or a hidden risk that comps aren't pricing in. Stress-test before assuming the spread holds.
Location & tenants
- Location reads: area grade B — affects rentability + tenant quality, not the cash-flow math above.
- St. Louis City (urban): math 10% / reading 18% proficiency, ranked #312 of 324 in MO (top 96%) — low school quality limits family demand, transient renter base, plan for 1-2y turnover; 80% free/reduced lunch — lower-income household profile, screen leases tightly.
- Market conditions: Rents rising fast (+5.0%/yr); 372 active listings in the ZIP; 37 comparable units currently listed for rent nearby; rentals at typical pace (median 24d on market — plan ~3-4 weeks tenant-placement turnaround); lower-income renter base — watch delinquency; 294 units permitted in St. Louis city in 2024 (227 in 5+ unit buildings).
- This rent runs 31% of the median local income ($41k/yr) — at the standard rent-burdened threshold; future hikes will face affordability resistance.
Forward outlook
- In year one you build about $2k of equity ($245 loan paydown + $1k appreciation (3.8% local appreciation)).
- St. Louis County population projected to shrink 6% by 2050 — rents likely to lag national; underwrite the cash flow, not the appreciation.
- At projected returns (3.8% appreciation + 5.0% rent growth), your $10k cash investment doubles in ~2 years — after that, you're playing with house money.
Negotiation context
- It's been on market 96 days — a 9% lower offer ($32k) is reasonable based on typical stale-listing flexibility.
- 2 sale attempts with the ask held roughly flat each time — persistent listings suggest the price (not the market) is what's stuck; bring a comps-based counter.
Risks & watch-outs
- Watch-outs: built in 1927 — expect roof / HVAC / electrical / plumbing capex.
- Climate carrying-cost: extreme-heat days projected 7→21/yr by 2055 (HVAC capex compounding) — expect insurance premiums to compound above CPI over the hold.
Questions for the listing agent
- It's been on market 96 days. Have you received any prior offers? Is the seller open to a 9% concession, seller financing, or rate buy-down credit?
- Built in 1927 — when were the roof, HVAC, electrical panel, plumbing, and water heater last replaced?
- Why hasn't it sold? Are there any deal-killer items the seller is aware of (foundation, flood, title, zoning, code violations)?
- Is there a deadline driving the sale (1031 exchange, divorce, estate, relocation)? That informs how much negotiation room exists.
- What's the average days-on-market for RENTAL listings here right now (not sales)? A rising rental-DOM trend means longer vacancies and softer asking-rent achievability than the comps imply.
- What's the recent tenant-quality profile in this submarket — average credit score on applications, eviction rate, late-payment / NSF rate, and stable-employment percentage? A property-management company in the area should have these aggregated.
- How much new for-sale + rental construction is in the pipeline within 1–3 miles? Heavy new supply typically softens prices + rents 12–24 months out; constrained supply supports both.
Investment metrics
- 1% rule
- 2.98% ✓
- Cap rate
- 27.11%
- Cash-on-cash
- 74.35%
- DSCR
- 4.31
- GRM
- 2.8
CMA / ARV
- ARV (median comp)
- $36,213
- List price
- $35,400
- Delta
- -2.25%
- Verdict
- FAIR
- Comps
- 20 within 1.0 mi
Show comp detail 12 sales within ~0.75 mi
| Address | Dist | Beds/Ba | Sqft | Sold | Price | $/sf | Match |
|---|---|---|---|---|---|---|---|
| 5653 Park Ln | 0.29mi | 2/1.0 (+1) | 880 (-4%) | 7mo | $35,900 | $41 | 70 |
| 5407 Genevieve Ave | 0.52mi | 2/1.0 (+1) | 920 (+1%) | 5mo | $40,000 | $43 | 65 |
| 5712 Floy Ave | 0.44mi | 2/1.0 (+1) | 966 (+6%) | 1mo | $62,000 | $64 | 64 |
| 5916 Alpha Ave | 0.58mi | 2/1.0 (+1) | 936 (+3%) | 3mo | $74,900 | $80 | 61 |
| 6111 Lalite Ave | 0.33mi | 2/1.0 (+1) | 988 (+8%) | 7mo | $75,000 | $76 | 60 |
| 5000 Plover Ave | 0.52mi | 2/1.0 (+1) | 882 (-3%) | 8mo | $34,900 | $40 | 58 |
| 5713 Goodfellow Blvd | 0.54mi | 2/1.0 (+1) | 960 (+5%) | 8mo | $75,000 | $78 | 55 |
| 5342 Hamilton Ave | 0.60mi | 2/1.0 (+1) | 960 (+5%) | 8mo | $65,000 | $68 | 52 |
| 5454 Hodiamont Ave | 0.64mi | 2/1.5 (+1) | 969 (+6%) | 6mo | $40,000 | $41 | 48 |
| 5709 Goodfellow Blvd | 0.53mi | 2/1.0 (+1) | 1,020 (+12%) | 4mo | $19,900 | $20 | 48 |
| 5052 Plover Ave | 0.47mi | 2/1.0 (+1) | 1,041 (+14%) | 5mo | $22,500 | $22 | 45 |
| 5515 Hodiamont Ave | 0.67mi | 2/1.0 (+1) | 818 (-10%) | 8mo | $60,000 | $73 | 40 |
Match score weights: distance 35% · size 25% · config 20% · recency 20%. Top-matched comps best support the ARV.
Projected returns pro-forma
3.79% appreciation · 4.97% rent growth · sell at horizon
- IRR
- 81.5%
- Equity multiple
- 5.74×
- Total profit
- $47,014
- Equity at exit
- $17,515
- IRR
- 81.0%
- Equity multiple
- 12.51×
- Total profit
- $114,132
- Equity at exit
- $28,308
Cash invested: $9,912 (down + closing). Projections, not guarantees.
Landlord ↔ Tenant lean methodology
- Overall (STATE)
- 81 Strongly Landlord-Friendly
- State Missouri
- 81 Strongly Landlord-Friendly · R+10
- County
- — inherits STATE
- City
- — inherits STATE
ZIP-level market 63136
- Home prices YoY
- 0.9%
- Rents YoY
- 5.0%
- Active inventory
- 372
- Price-to-rent
- 2.8×
Monthly cashflow live
- Estimated rent
- $1,055 high interval (Pro) →
- Mortgage (P&I)
- −$186
- Tax from tax record
- −$19 /mo · $226/yr
- Insurance
- −$15
- HOA
- −$0
- Vacancy / Maint / Mgmt
- −$222
- Net cashflow
- $614
Break-even live
UW: 25.0% down · 7.5% · 30yr · 1.5% tax · 5.0% vac · 8.0% maint · 8.0% mgmt
Financing live
Cash to close
- Down payment
- $8,850
- Closing costs
- $1,062
- Reserves months
- —
- Total cash needed
- —
Loan-product check · same deal, 3 products live
Conventional
25% down · 7.5% · 30yr
- Down + closing
- —
- Monthly P&I
- —
- Monthly cashflow
- —
- DSCR
- —
- Eligible?
- —
Personal DTI + credit; lowest rate.
DSCR
20% down · 8.5% · 30yr
- Down + closing
- —
- Monthly P&I
- —
- Monthly cashflow
- —
- DSCR
- —
- Eligible?
- —
No personal income docs; deal must DSCR.
Hard money
10% down · 12.0% · 12mo
- Down + closing
- —
- Monthly P&I
- —
- Monthly cashflow
- —
- DSCR
- —
- Eligible?
- —
Short-term bridge; refi at stabilization.
Rent comps 37 comps
| Address | Beds | Baths | Sqft | Rent | $/sqft | DOM | Units | Dist |
|---|---|---|---|---|---|---|---|---|
| 5931 Emma Ave Saint Louis, MO | 2.0 | 1.0 | 880 | $1,200 | $1.36 | 43d | 1 | 0.08mi |
| 5546 Floy Ave Saint Louis, MO | 2.0 | 2.0 | 850 | $1,273 | $1.50 | 20d | 1 | 0.39mi |
| 6150 Sherry Ave Saint Louis, MO | 2.0 | 1.0 | 1032 | $896 | $0.87 | 23d | 1 | 0.47mi |
| 5721 Floy Ave Saint Louis, MO | 2.0 | 1.0 | 1032 | $1,120 | $1.09 | 23d | 1 | 0.49mi |
| 6153 Laura Ave Saint Louis, MO | 2.0 | 1.0 | 834 | $1,000 | $1.20 | 23d | 1 | 0.49mi |
| 5741 Floy Ave Saint Louis, MO | 2.0 | 1.0 | 1000 | $1,100 | $1.10 | 23d | 1 | 0.52mi |
| 5756 Floy Ave Saint Louis, MO | 2.0 | 1.0 | 1080 | $995 | $0.92 | 43d | 1 | 0.52mi |
| 5654 Acme Ave Saint Louis, MO | 2.0 | 1.0 | 968 | $325 | $0.34 | 21d | 1 | 0.55mi |
| 5415 Hamilton Ave Unit Labs Jennings, MO | 2.0 | 1.0 | 864 | $1,100 | $1.27 | 23d | 1 | 0.62mi |
| 5662 Wilborn Dr Saint Louis, MO | 1.0 | 1.0 | 768 | $850 | $1.11 | 23d | 1 | 0.64mi |
| 5439 Hodiamont Ave Saint Louis, MO | 2.0 | 1.0 | 770 | $950 | $1.23 | 17d | 1 | 0.68mi |
| 4719 Plover Ave Saint Louis, MO | 2.0 | 1.0 | 744 | $995 | $1.34 | 4d | 1 | 0.73mi |
| 5955 Floy Ave Saint Louis, MO | 2.0 | 1.0 | 1032 | $1,050 | $1.02 | 2d | 1 | 0.74mi |
| 5635 Hodiamont Ave Saint Louis, MO | 2.0 | 1.0 | 580 | $899 | $1.55 | 20d | 1 | 0.75mi |
| 4715 Thrush Ave Unit 24 St. Louis, MO | 2.0 | 1.0 | 900 | $1,350 | $1.50 | 23d | 1 | 0.78mi |
| 7024 Idlewild Ave Saint Louis, MO | 2.0 | 1.0 | 588 | $995 | $1.69 | 43d | 1 | 0.94mi |
| 7030 Emma Ave Saint Louis, MO | 2.0 | 1.0 | 801 | $1,350 | $1.69 | 43d | 1 | 0.97mi |
| 7036 Garesche Ave Saint Louis, MO | 2.0 | 1.0 | 864 | $950 | $1.10 | 17d | 1 | 0.97mi |
| 8502 Dianthus Ln Saint Louis, MO | 2.0 | 1.0 | 1072 | $1,175 | $1.10 | 23d | 1 | 0.98mi |
| 1942 Damato Ct Saint Louis, MO | 2.0 | 1.0 | 905 | $1,100 | $1.22 | 43d | 1 | 1.03mi |
| 7131 Garesche Ave Saint Louis, MO | 2.0 | 1.0 | 918 | $1,090 | $1.19 | 3d | 1 | 1.06mi |
| 5516 Fairridge Ct Saint Louis, MO | 2.0 | 1.0 | 1110 | $995 | $0.90 | 23d | 1 | 1.15mi |
| 7142 Lamont Dr Saint Louis, MO | 2.0 | 1.0 | 750 | $1,100 | $1.47 | 17d | 1 | 1.18mi |
| 7160 Beulah Ave Saint Louis, MO | 2.0 | 1.0 | 784 | $1,059 | $1.35 | 43d | 1 | 1.21mi |
| 5615 Beldon Dr Saint Louis, MO | 2.0 | 1.0 | 850 | $950 | $1.12 | 43d | 1 | 1.21mi |
| 8828 Riverview Blvd Apt 2S St. Louis, MO | 1.0 | 1.0 | 816 | $850 | $1.04 | 43d | 1 | 1.22mi |
| 7218 Albright Ave Saint Louis, MO | 2.0 | 1.0 | 1100 | $980 | $0.89 | 23d | 1 | 1.27mi |
| 8612 Halls Ferry Rd Saint Louis, MO | 1.0–2.0 | 1.0 | 625 | $715 | $1.14 | 4d | 2 | 1.30mi |
| 7304 Albright Ave Saint Louis, MO | 2.0 | 1.0 | 800 | $1,100 | $1.38 | 43d | 1 | 1.33mi |
| 8344 Eton Pl Saint Louis, MO | 2.0 | 1.0 | 750 | $895 | $1.19 | 3d | 1 | 1.33mi |
| 8347 Eton Pl Saint Louis, MO | 2.0 | 1.0 | 750 | $1,075 | $1.43 | 43d | 1 | 1.35mi |
| 4919 Thekla Ave Saint Louis, MO | 2.0 | 1.0 | 931 | $700 | $0.75 | 43d | 1 | 1.37mi |
| 4908 W Florissant Ave Apt A St. Louis, MO | 1.0 | 1.0 | 750 | $695 | $0.93 | 43d | 1 | 1.40mi |
| 4908 W Florissant Ave Unit B St. Louis, MO | — | 1.0 | 750 | $675 | $0.90 | 43d | 1 | 1.40mi |
| 5640 Sapphire Ave Saint Louis, MO | 2.0 | 1.0 | 900 | $1,100 | $1.22 | 43d | 1 | 1.41mi |
| 1131 Canaan Ave Saint Louis, MO | 1.0 | 1.0 | 624 | $900 | $1.44 | 16d | 1 | 1.44mi |
| 8817 Shady Grove Ave Saint Louis, MO | 2.0 | 1.0 | 1085 | $1,075 | $0.99 | 23d | 1 | 1.46mi |
Listing history 10 events
-
2026-06-08days on market $35,400 Active 96 DOM
-
2026-06-05days on market $35,400 Active 93 DOM
-
2026-06-03days on market $35,400 Active 92 DOM
-
2026-06-02days on market $35,400 Active 91 DOM
-
2026-06-01days on market $35,400 Active 90 DOM
-
2026-05-31days on market $35,400 Active 89 DOM
-
2026-03-03$35,400 Active 517-char remark
Show marketing remark (517 chars)
Whether you are ready to stop renting and own something of your own, or an investor ready for your next cash flow opportunity...5929 Lucille Ave is ready for you! Affordable entry point, functional layout, with the possibility of a 2nd bedroom/office space. Located in Walnut Park West which offers the opportunity for buyers that think ahead and move smart. Starter home. Downsize opportunity. Rental potential. This is where strategy meets opportunity! Showings start now Let's get you inside to see for yourself!
-
2025-06-12price $39,900
-
2025-04-30$44,900 Active
-
2025-04-28historical
ⓘ Source: listings_history table (triggers on properties + properties_extension) + one-shot
backfill from property_details.listing_events for pre-trigger history.
Tax reassessment forecast MO · Resets to sale price
- Current annual tax
- $226 · $19/mo
- Projected year-2 tax
- $343 · $29/mo
- Expected delta
- +$117/yr (+$10/mo · 51.7%)
ⓘ Screening estimate from a state-policy table — verify with the county assessor before closing.
Climate risk First Street
- Flood 1/10 Low FEMA zone X (unshaded) · 0% chance over 30 yrs
- Wildfire 1/10 Low
- Heat 5/10 Major 7 d/yr ≥107°F today · 21 d/yr by 30 yrs out
- Wind 2/10 Low 100% chance of damaging wind over 30 yrs
- Air quality 4/10 Moderate 4 unhealthy d/yr today · 5 by 30 yrs out
Nearby sold comps map
Loading sold comps map…
Walkable amenities ~0.75 mi
Loading nearby amenities…
Taxation est. · year 1
- Rental income
- $12,659
- − Mortgage interest
- −$1,983
- − Property taxes
- −$226
- − Insurance
- −$177
- − Repairs & maintenance
- −$1,013
- − Management
- −$1,013
- − Depreciation
- −$1,030
- Taxable income
- $7,218
- Est. tax owed @ 24.0%
- −$1,732
- After-tax cash flow
- $5,638/yr
For passive investors: Depreciation is non-cash, so a rental often shows a tax loss while cash-flowing — sheltering income. Rental losses are passive: they offset passive income freely, and up to $25,000/yr can offset ordinary (W-2) income if you actively participate and your MAGI is under $100k (phasing out to $0 by $150k); unused losses carry forward. On sale, claimed depreciation is recaptured at up to 25%, and gains may owe capital-gains tax (a 1031 exchange can defer both). Figures are a year-1 estimate at your 24.0% rate — not tax advice; consult a CPA.
Schools (NCES district)
- District
- St. Louis City
- NCES district ID
- 2929280
- Math proficiency
- 10% ▼ -6.00%
- Reading proficiency
- 18% ▼ -3.00%
- Median HH income
- $35,685
- Composite
- 11.54/100
- National rank
- #9699
- State rank
- #312 of 324 in MO
Livability — St. Louis
No livability data for this city. (Only ~50 U.S. cities are tracked.)
Census & demographics
- Census place
- St. Louis, MO
- County
- Saint Louis County · 888,823 people
- Metro
- St. Louis, MO-IL
- Population (ZIP)
- 40,929
- Household income
- $41,154
- Rent vs Own
- Severe rent burden
- 3085.0
Population outlook (St. Louis County) Hauer SSP2
- Today (2025)
- 315,737 people
- By 2030
- 313,865 · -0.6%
- By 2040
- 305,439 · -3.3%
- By 2050
- 296,529 · -6.1%
- By 2075
- 271,028 · -14.2%
- By 2100
- 255,359 · -19.1%
Race, ethnicity, and origin ACS 2023
- Neighborhood character
- Predominantly Black (90%)
- Race & ethnicity
- Black 90% White 5% Two or more races 3%
- Foreign-born
- 1% · Canada
Political lean MEDSL · St. Louis
- 2024 margin
- Solid D (+64.7) · D 81.4% · R 16.7% · Other 2.0%
- 2008→2024 swing
- -3.5pp toward R · 2008: 68.2pp · 2024: 64.7pp
- All cycles
- 2024: D+64.7 2020: D+66.2 2016: D+63.7 2012: D+66.6 2008: D+68.2
Not yet ingested
- Civics
- —
Market trends
- HPI YoY
- ▲ 3.79%
- Current HPI
- 420.28
- Rent YoY
- ▲ 4.97%
- Metro
- St. Louis, MO-IL
- State GDP YoY
- ▲ 1.84%
- F500 in state
- 20
Industry mix (Fortune 500 HQ in MO)
| Industry | F500 HQs | Revenue |
|---|---|---|
| Healthcare | 1 | $163B |
|
||
| Insurance | 1 | $21B |
|
||
| Industrial Technology | 1 | $17B |
|
||
| Retail | 1 | $16B |
|
||
| Industrial Distribution | 1 | $10B |
|
||
| Utilities | 1 | $9B |
|
||
Price history
-21.2% since first listed4 events — show timeline
- 2026-03-03 Listed $35,400 MARIS as Distributed by MLS Grid
- 2025-06-12 Price Changed $39,900 MARIS as Distributed by MLS Grid
- 2025-04-30 Listed $44,900 MARIS as Distributed by MLS Grid
- 2025-04-28 Coming Soon — MARIS as Distributed by MLS Grid
Property tax history
-0.8%/yrLatest (2024): $226 · +14.6% YoY. Source: county tax records.
Cash-flow waterfall
monthlySold comps — $/sqft
last 12 mo · ≤1 miLoading sold comps…