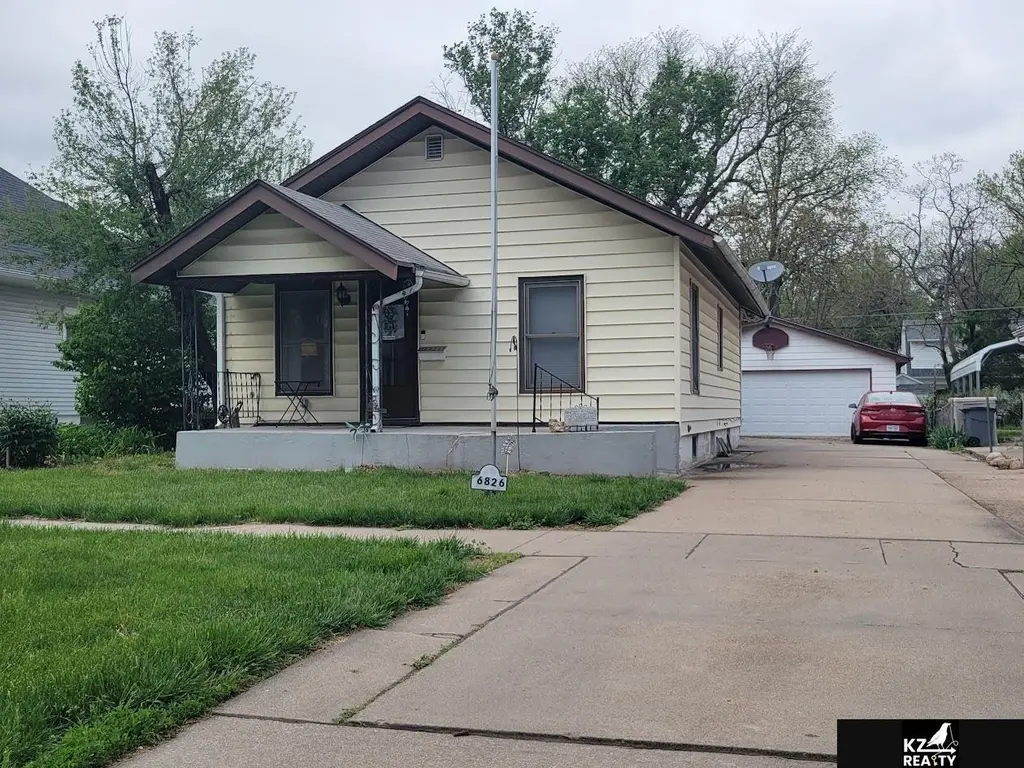
6826 Morrill Ave · Lincoln, NE
Flood risk 1/10 · Minimal
- FEMA flood zone
- X (unshaded)
- Chance of flooding over 30 yrs
- 0.0%
- Est. flood insurance / yr
- $473 – $860
Fire risk 2/10 · Minimal
- Est. fire insurance / yr
- $1,161 – $2,155
Heat risk 3/10 · Minor
- Hot days now (above 104°F)
- 7 days/yr
- Hot days in 30 yrs
- 16 days/yr
Wind risk 2/10 · Minimal
- Chance of severe wind over 30 yrs
- —
Air-quality risk 1/10 · Minimal
- Unhealthy air days now
- 0 days/yr
- Unhealthy air days in 30 yrs
- 0 days/yr
Risk factors via First Street. Map © Google.
Why this score? — see what drove the C- grade
The composite is a weighted blend of 9 inputs, each scored 0–100. Each bar is that input's sub-score; the figure is the points it added to the 100-point composite (weight × sub-score).
- ARV discount +15.0/15.0
- Cash flow +14.1/30.0
- Schools +4.4/10.0
- DSCR +4.3/10.0
- Livability +4.2/5.0
- 1% rule +3.3/10.0
- Rent growth +3.1/5.0
- Condition / age +2.5/5.0
- Appreciation +0.0/10.0
$200,000
🖨 Deal sheet (PDF) 📄 Offer letter ✓ Due diligence
Listing remarks
This 1 + 2 bedroom, 2-bath home offers comfort, flexibility, and room to spread out—inside and out. Step through the front door into a bright, open-concept living room that flows seamlessly into the informal dining area & kitchen. Also on the main floor, you’ll find a private primary suite featuring a generously sized bedroom, an en suite bath with laundry, a walk-in closet, and even a built-in ironing board for added convenience. Just off the kitchen is a versatile second living space—ideal for a cozy family room, home office, or flex area to fit your lifestyle. Downstairs, the finished basement includes a large family room, two non-conforming bedrooms, a ¾ b
Key facts
- Walk-in closet
- 6,970 sq ft lot
- 2 garage spots
Tags
Property features AI
Exterior
- Parking: Detached garage; Two covered parking spaces (2 total)
- Utilities: Public water; Public sewer
- Home design: Single-family residence; Residential property; Not new / not a model; Total living area includes finished below-grade space
- Construction: Built in 1922; Block foundation
- Exterior features: Patio; Full chain-link fencing; Up to 1/4 acre lot (approximately 140 x 50, 0.16 acres)
Interior
- Kitchen: Kitchen on main floor (approx. 7' x 10'); Range; Refrigerator; Dishwasher; Microwave; Disposal
- Bedrooms: Main floor primary bedroom (approx. 11.4' x 14.7')
- Bathrooms: Two bathrooms total — one full and one three-quarter; One main-level bathroom and one below-grade bathroom
- Heating & cooling: Natural gas forced-air heating; Central air conditioning
- Interior features: Finished basement; Exercise room; No fireplaces
- Laundry & utility: Washer; Dryer
Neighborhood map
What this means for you Summary
Snapshot
- This is a 1-bed/2.0-bath single-family listed at $200k.
Deal economics
- At list price, monthly cash flow is $28 ($336/yr) — positive.
- The deal already cash-flows at list — no discount required.
- To meet the 1% rule (rent ≥ 1% of price), the offer needs to be $165k (17.4% below list).
- Recommended offer: $165k (17.4% below list) — sets the bar for 1% rule.
- Cap rate 6.5% vs local median 3.0% in Lincoln — top-decile yield for the area; either an underpriced asset or a hidden risk that comps aren't pricing in. Stress-test before assuming the spread holds.
Location & tenants
- Location reads 85/100 on livability (#5 in NE, #545 nationally) — a professional / high-income tenant draw. Strengths: amenities A+, cost of living A+, housing A+; Watch: crime D+.
- Lincoln Public Schools (urban): math 50% / reading 53% proficiency, ranked #59 of 111 in NE (top 53%) — acceptable for families but not a draw, mixed tenant base, ~2y average lease.
- Zoned schools: Pershing Elementary School (math 52% / reading 47%, grade D, #233 of 502 statewide, top 52%, 443 students, 73% FRL); Dawes Middle School (math 32% / reading 38%, grade F, #103 of 128 statewide, top 80%, 405 students, 48% FRL); Lincoln Northeast High School (math 34% / reading 36%, grade F, #207 of 261 statewide, top 79%, 1,812 students, 62% FRL) — zoned schools average 61% FRL vs 37% district-wide (24 pts higher); higher-poverty schools than district average — tighter screening recommended.
- Market conditions: Rents rising (+2.4%/yr); 105 active listings in the ZIP; 3 comparable units currently listed for rent nearby; rentals at typical pace (median 16d on market — plan ~3-4 weeks tenant-placement turnaround); 1,940 units permitted in Lancaster County in 2024 (895 in 5+ unit buildings).
Forward outlook
- Local home prices are declining (-3.0%/yr); year-one equity from $1k of loan paydown is wiped out by about $6k of value loss. Plan a longer hold.
- Lancaster County population projected at +37% by 2050 — long-run rental-demand tailwind backs the buy-and-hold thesis.
Negotiation context
- Only 3 days on market — expect competitive offers; lowballing is unlikely to land.
- Current owner paid $99k; list at $200k implies a 102% gain — meaningful room to come down on a strong offer.
Risks & watch-outs
- Watch-outs: built in 1922 — expect roof / HVAC / electrical / plumbing capex.
Questions for the listing agent
- Built in 1922 — when were the roof, HVAC, electrical panel, plumbing, and water heater last replaced?
- Is there a deadline driving the sale (1031 exchange, divorce, estate, relocation)? That informs how much negotiation room exists.
- Schools are A-rated — typically a magnet for longer-tenancy family renters. What's the average tenant stay here, and is there a school-zone premium baked into asking?
- Crime grade is D in this area — have there been break-ins, vandalism, or insurance claims at this property in the last 3 years? What carrier currently insures it and at what premium?
- What's the average days-on-market for RENTAL listings here right now (not sales)? A rising rental-DOM trend means longer vacancies and softer asking-rent achievability than the comps imply.
- What's the recent tenant-quality profile in this submarket — average credit score on applications, eviction rate, late-payment / NSF rate, and stable-employment percentage? A property-management company in the area should have these aggregated.
- How much new for-sale + rental construction is in the pipeline within 1–3 miles? Heavy new supply typically softens prices + rents 12–24 months out; constrained supply supports both.
Investment metrics
- 1% rule
- 0.83% ✗
- Cap rate
- 6.46%
- Cash-on-cash
- 0.60%
- DSCR
- 1.03
- GRM
- 10.1
CMA / ARV
- ARV (on-the-fly)
- $259,888
- Comps found
- 5
Show comp detail 5 sales within ~0.75 mi
| Address | Dist | Beds/Ba | Sqft | Sold | Price | $/sf | Match |
|---|---|---|---|---|---|---|---|
| 6938 Ballard Ave | 0.11mi | 2/2.0 (+1) | 1,500 (-15%) | 12mo | $230,000 | $153 | 56 |
| 6934 Morrill Ave | 0.08mi | 2/2.0 (+1) | 1,539 (-12%) | 23mo | $205,000 | $133 | 52 |
| 6900 Benton St | 0.36mi | 2/2.0 (+1) | 1,515 (-14%) | 12mo | $230,000 | $152 | 45 |
| 5939 Logan Ave | 0.62mi | 2/2.0 (+1) | 1,516 (-14%) | 6mo | $225,000 | $148 | 38 |
| 3310 N 72nd St | 0.68mi | 2/1.5 (+1) | 1,940 (+10%) | 13mo | $277,000 | $143 | 33 |
Match score weights: distance 35% · size 25% · config 20% · recency 20%. Top-matched comps best support the ARV.
Projected returns pro-forma
-3.0% appreciation · 2.37% rent growth · sell at horizon
- IRR
- -16.0%
- Equity multiple
- 0.43×
- Total profit
- $-31,708
- Equity at exit
- $29,821
- IRR
- -8.8%
- Equity multiple
- 0.47×
- Total profit
- $-29,695
- Equity at exit
- $17,292
Cash invested: $56,000 (down + closing). Projections, not guarantees.
Landlord ↔ Tenant lean methodology
- Overall (STATE)
- 83 Strongly Landlord-Friendly
- State Nebraska
- 83 Strongly Landlord-Friendly · R+13
- County
- — inherits STATE
- City
- — inherits STATE
ZIP-level market 68507
- Rents YoY
- 2.4%
- Active inventory
- 105
- Price-to-rent
- 10.1×
Monthly cashflow live
- Estimated rent
- $1,652 medium interval (Pro) →
- Mortgage (P&I)
- −$1,049
- Tax from tax record
- −$145 /mo · $1,742/yr
- Insurance
- −$83
- HOA
- −$0
- Vacancy / Maint / Mgmt
- −$347
- Net cashflow
- $28
Break-even live
Sensitivity live
| Price | -10% $141 | -5% $85 | +0% $28 | +5% $-29 | +10% $-85 |
|---|---|---|---|---|---|
| Rent | -10% $-103 | -5% $-37 | +0% $28 | +5% $93 | +10% $158 |
| Rate | -1.0pp $129 | -0.5pp $79 | base $28 | +0.5pp $-24 | +1.0pp $-77 |
UW: 25.0% down · 7.5% · 30yr · 1.5% tax · 5.0% vac · 8.0% maint · 8.0% mgmt
Financing live
Cash to close
- Down payment
- $50,000
- Closing costs
- $6,000
- Reserves months
- —
- Total cash needed
- —
Loan-product check · same deal, 3 products live
Conventional
25% down · 7.5% · 30yr
- Down + closing
- —
- Monthly P&I
- —
- Monthly cashflow
- —
- DSCR
- —
- Eligible?
- —
Personal DTI + credit; lowest rate.
DSCR
20% down · 8.5% · 30yr
- Down + closing
- —
- Monthly P&I
- —
- Monthly cashflow
- —
- DSCR
- —
- Eligible?
- —
No personal income docs; deal must DSCR.
Hard money
10% down · 12.0% · 12mo
- Down + closing
- —
- Monthly P&I
- —
- Monthly cashflow
- —
- DSCR
- —
- Eligible?
- —
Short-term bridge; refi at stabilization.
Rent comps 3 comps
| Address | Beds | Baths | Sqft | Rent | $/sqft | DOM | Units | Dist |
|---|---|---|---|---|---|---|---|---|
| 6433 Platte Ave Lincoln, NE | 2.0 | 1.0 | 1386 | $1,995 | $1.44 | 23d | 1 | 0.33mi |
| 4444 N 60th St Lincoln, NE | 2.0 | 1.0 | 1248 | $1,440 | $1.15 | 15d | 1 | 0.63mi |
| 8430 Fremont St Lincoln, NE | 1.0–3.0 | 1.0–2.0 | 1050 | $1,272 | $1.21 | 3d | 22 | 1.21mi |
Listing history 3 events
-
2026-04-30status Pending
-
2026-04-27$200,000 New
-
2005-06-20soldstatus $99,000
ⓘ Source: listings_history table (triggers on properties + properties_extension) + one-shot
backfill from property_details.listing_events for pre-trigger history.
Tax reassessment forecast NE · Resets to sale price
- Current annual tax
- $1,742 · $145/mo
- Projected year-2 tax
- $3,460 · $288/mo
- Expected delta
- +$1,718/yr (+$143/mo · 98.6%)
ⓘ Screening estimate from a state-policy table — verify with the county assessor before closing.
Climate risk First Street
- Flood 1/10 Low FEMA zone X (unshaded) · 0% chance over 30 yrs
- Wildfire 2/10 Low
- Heat 3/10 Moderate 7 d/yr ≥104°F today · 16 d/yr by 30 yrs out
- Wind 2/10 Low
- Air quality 1/10 Low 0 unhealthy d/yr today · 0 by 30 yrs out
Nearby sold comps map
Loading sold comps map…
Walkable amenities ~0.75 mi
Loading nearby amenities…
Taxation est. · year 1
- Rental income
- $19,827
- − Mortgage interest
- −$11,203
- − Property taxes
- −$1,742
- − Insurance
- −$1,000
- − Repairs & maintenance
- −$1,586
- − Management
- −$1,586
- − Depreciation
- −$5,818
- Taxable loss
- −$3,108
- Est. tax savings @ 24.0%
- +$746
- After-tax cash flow
- $1,082/yr
For passive investors: Depreciation is non-cash, so a rental often shows a tax loss while cash-flowing — sheltering income. Rental losses are passive: they offset passive income freely, and up to $25,000/yr can offset ordinary (W-2) income if you actively participate and your MAGI is under $100k (phasing out to $0 by $150k); unused losses carry forward. On sale, claimed depreciation is recaptured at up to 25%, and gains may owe capital-gains tax (a 1031 exchange can defer both). Figures are a year-1 estimate at your 24.0% rate — not tax advice; consult a CPA.
Schools (NCES district)
- District
- Lincoln Public Schools
- NCES district ID
- 3172840
- Math proficiency
- 50% ▼ -6.00%
- Reading proficiency
- 53% ▼ -3.00%
- Median HH income
- $50,273
- Composite
- 44.05/100
- National rank
- #2880
- State rank
- #59 of 111 in NE
Livability — Lincoln
- Score
- 85/100
- State rank
- #5
- US rank
- #545
Category grades
Schools grade is shown separately in the Schools card above.
Census & demographics
- Census place
- Lincoln, NE
- County
- Lancaster County · 291,509 people
- City population
- 291,509
- Metro
- Lincoln, NE
- Population (ZIP)
- 16,029
- Household income
- $69,488
- Rent vs Own
- Severe rent burden
- 557.0
Population outlook (Lancaster County) Hauer SSP2
- Today (2025)
- 352,806 people
- By 2030
- 377,899 · +7.1%
- By 2040
- 428,582 · +21.5%
- By 2050
- 483,103 · +36.9%
- By 2075
- 632,390 · +79.2%
- By 2100
- 759,513 · +115.3%
Race, ethnicity, and origin ACS 2023
- Neighborhood character
- Predominantly White (82%)
- Race & ethnicity
- White 82% Two or more races 10% Hispanic / Latino 9% Black 2% Asian 1%
- Hispanic origin (detail)
- Mexican 7%
- Common ancestry
- Italian 2% Romanian 2% Lithuanian 2%
- Foreign-born
- 4% · Canada, China, Vietnam
- Languages at home
- 94% English-only · Spanish 4% Vietnamese 1% Arabic 1%
Political lean MEDSL · Lancaster
- 2024 margin
- Toss-up / Even · D 51.4% · R 47.1% · Other 1.5%
- 2008→2024 swing
- -0.7pp no change · 2008: 5.0pp · 2024: 4.3pp
- All cycles
- 2024: D+4.3 2020: D+7.8 2016: D+0.1 2012: R+1.0 2008: D+5.0
Not yet ingested
- Civics
- —
Market trends
- HPI YoY
- ▼ -273.66%
- Current HPI
- 234.3628
- Rent YoY
- ▲ 2.37%
- Metro
- Lincoln, NE
- State GDP YoY
- ▲ 0.68%
- F500 in state
- 2
Industry mix (Fortune 500 HQ in NE)
| Industry | F500 HQs | Revenue |
|---|---|---|
| Conglomerate | 1 | $371B |
|
||
Price history
+102.0% since first listed3 events — show timeline
- 2026-04-30 Pending — GPRMLS
- 2026-04-27 Listed $200,000 GPRMLS
- 2005-06-20 Sold (Public Records) $99,000 Public Records
Property tax history
-0.6%/yrLatest (2021): $1,742 · +7.1% YoY. Source: county tax records.
Cash-flow waterfall
monthlySold comps — $/sqft
last 12 mo · ≤1 miLoading sold comps…