317 Pearl St · Cumberland, MD
Flood risk 1/10 · Minimal
- FEMA flood zone
- X (unshaded)
- Chance of flooding over 30 yrs
- 0.0%
- Est. flood insurance / yr
- $473 – $860
Fire risk 3/10 · Minor
- Est. fire insurance / yr
- $755 – $1,403
Heat risk 4/10 · Minor
- Hot days now (above 101°F)
- 7 days/yr
- Hot days in 30 yrs
- 17 days/yr
Wind risk 2/10 · Minimal
- Chance of severe wind over 30 yrs
- —
Air-quality risk 2/10 · Minimal
- Unhealthy air days now
- 0 days/yr
- Unhealthy air days in 30 yrs
- 1 days/yr
Risk factors via First Street. Map © Google.
Why this score? — see what drove the B- grade
The composite is a weighted blend of 9 inputs, each scored 0–100. Each bar is that input's sub-score; the figure is the points it added to the 100-point composite (weight × sub-score).
- Cash flow +28.1/30.0
- ARV discount +11.6/15.0
- DSCR +10.0/10.0
- 1% rule +6.6/10.0
- Rent growth +5.0/5.0
- Livability +3.9/5.0
- Condition / age +2.5/5.0
- Schools +1.9/10.0
- Appreciation +0.0/10.0
$85,000
🖨 Deal sheet 📄 Offer letter ✓ Due diligence
Listing remarks MLS
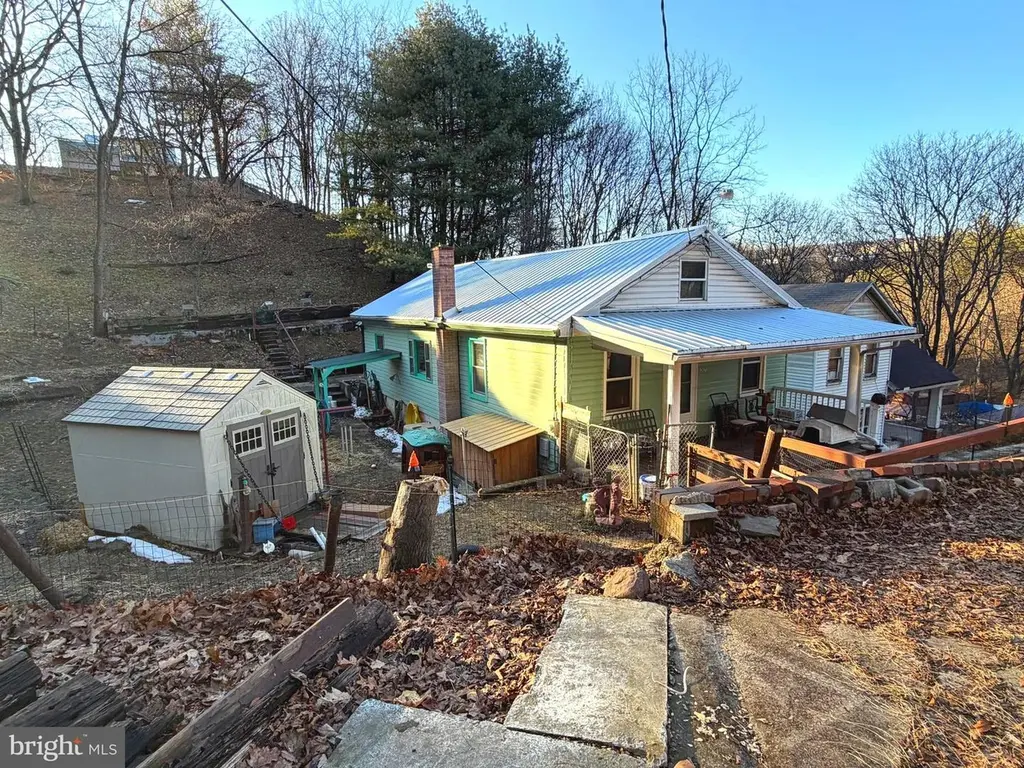
Fixer-Upper with Private Oasis Feel – Priced to Sell! Located in the city yet surrounded by trees, this property offers the best of both worlds—convenience with a peaceful, private setting that feels like your own little oasis. This home is the perfect open canvas for someone looking to make it their own. Much of the hard work has already been completed, giving you a great starting point to add your personal touches and build equity. The home currently features 2 bedrooms, with the potential for more. The full concrete basement could easily be finished to create additional bedrooms, living space, or a recreation area. Many major upgrades already completed including a 1-year-old metal roof, central A/C, backup generator, gutter guards, handicap ramp, some new windows, and all new plumbing. New toilet installed and vanity to be added. Property also features a concrete parking pad and storage shed. Great opportunity to make it your own. Priced to sell – motivated seller.
Key facts
- Some new windows
- Central a c
- Backup generator
Tags
Neighborhood map
What this means for you Summary
Snapshot
- This is a 2-bed/1.0-bath single-family listed at $85k.
Deal economics
- At list price, monthly cash flow is $268 ($3k/yr) — positive.
- The deal already cash-flows at list — no discount required.
- Meets the 1% rule at list price ($987 rent vs $85k).
- Recommended offer: $77k (9.0% below list) — sets the bar for market timing.
- Cap rate 10.1% vs local median 6.7% in Cumberland — top-decile yield for the area; either an underpriced asset or a hidden risk that comps aren't pricing in. Stress-test before assuming the spread holds.
Location & tenants
- Location reads 78/100 on livability (#64 in MD, #2,385 nationally) — a middle-class / working-renter tenant base. Strengths: amenities A+, commute A+, cost of living A+; Watch: schools D+, crime F, employment F.
- Allegany County Public Schools (other): math 15% / reading 30% proficiency, ranked #18 of 24 in MD (top 75%) — low school quality limits family demand, transient renter base, plan for 1-2y turnover.
- Market conditions: Rents rising fast (+10.9%/yr); 235 active listings in the ZIP; 4 comparable units currently listed for rent nearby; rentals lingering (median 44d on market — plan ~5-8 weeks vacancy on turnover, expect pricing pressure); 100% of comp listings sitting > 30 days — soft ceiling on asking rent; 24 units permitted in Allegany County in 2024 (0 in 5+ unit buildings).
Forward outlook
- Local home prices are declining (-3.0%/yr); year-one equity from $588 of loan paydown is wiped out by about $3k of value loss. Plan a longer hold.
- Allegany County population projected at -14% by 2050 — secular population decline; favor cash flow + early exit over multi-decade hold.
- At projected returns (-3.0% appreciation + 8.0% rent growth), your $24k cash investment doubles in ~7 years — after that, you're playing with house money.
Negotiation context
- It's been on market 107 days — a 9% lower offer ($77k) is reasonable based on typical stale-listing flexibility.
- 2 sale attempts with the ask held roughly flat each time — persistent listings suggest the price (not the market) is what's stuck; bring a comps-based counter.
- Current owner paid $40k; list at $85k implies a 112% gain — meaningful room to come down on a strong offer.
Risks & watch-outs
- Watch-outs: built in 1918 — expect roof / HVAC / electrical / plumbing capex.
Questions for the listing agent
- It's been on market 107 days. Have you received any prior offers? Is the seller open to a 9% concession, seller financing, or rate buy-down credit?
- Built in 1918 — when were the roof, HVAC, electrical panel, plumbing, and water heater last replaced?
- Why hasn't it sold? Are there any deal-killer items the seller is aware of (foundation, flood, title, zoning, code violations)?
- Is there a deadline driving the sale (1031 exchange, divorce, estate, relocation)? That informs how much negotiation room exists.
- Schools are D-rated, which usually means shorter tenancies and higher turnover. Who's the typical renter profile here, and what's been the actual vacancy rate?
- Crime grade is F in this area — have there been break-ins, vandalism, or insurance claims at this property in the last 3 years? What carrier currently insures it and at what premium?
- What's the average days-on-market for RENTAL listings here right now (not sales)? A rising rental-DOM trend means longer vacancies and softer asking-rent achievability than the comps imply.
- What's the recent tenant-quality profile in this submarket — average credit score on applications, eviction rate, late-payment / NSF rate, and stable-employment percentage? A property-management company in the area should have these aggregated.
- How much new for-sale + rental construction is in the pipeline within 1–3 miles? Heavy new supply typically softens prices + rents 12–24 months out; constrained supply supports both.
Investment metrics
- 1% rule
- 1.16% ✓
- Cap rate
- 10.08%
- Cash-on-cash
- 13.52%
- DSCR
- 1.60
- GRM
- 7.2
CMA / ARV
- ARV (median comp)
- $93,495
- List price
- $85,000
- Delta
- -9.09%
- Verdict
- FAIR
- Comps
- 20 within 1.0 mi
Show comp detail 12 sales within ~0.75 mi
| Address | Dist | Beds/Ba | Sqft | Sold | Price | $/sf | Match |
|---|---|---|---|---|---|---|---|
| 461 S Central Ave | 0.19mi | 2/1.0 | 864 (-6%) | 21mo | $25,000 | $29 | 64 |
| 472 Williams St | 0.32mi | 3/1.5 (+1) | 1,013 (+10%) | 1mo | $144,500 | $143 | 60 |
| 705 Hill Top Dr | 0.59mi | 1/1.0 (-1) | 860 (-6%) | 1mo | $109,000 | $127 | 56 |
| 715 Saint Marys Ave | 0.65mi | 3/2.0 (+1) | 920 (0%) | 8mo | $150,500 | $164 | 54 |
| 518 Baltimore Ave | 0.54mi | 2/1.0 | 808 (-12%) | 6mo | $55,000 | $68 | 50 |
| 451 Baltimore Ave | 0.31mi | 3/1.0 (+1) | 1,044 (+14%) | 10mo | $60,000 | $57 | 50 |
| 816 Memorial Ave | 0.74mi | 2/1.0 | 973 (+6%) | 9mo | $160,000 | $164 | 49 |
| 324 Reservoir Ave | 0.28mi | 3/1.0 (+1) | 784 (-15%) | 12mo | $124,900 | $159 | 47 |
| 615 Haddon Ave | 0.56mi | 2/1.0 | 1,008 (+10%) | 16mo | $185,100 | $184 | 45 |
| 617 Frederick St | 0.73mi | 3/1.0 (+1) | 848 (-8%) | 6mo | $55,000 | $65 | 43 |
| 700 Montgomery Ave | 0.54mi | 3/1.0 (+1) | 1,008 (+10%) | 13mo | $120,000 | $119 | 43 |
| 406 Warwick Ave | 0.39mi | 2/2.0 | 1,023 (+11%) | 21mo | $107,300 | $105 | 42 |
Match score weights: distance 35% · size 25% · config 20% · recency 20%. Top-matched comps best support the ARV.
Projected returns pro-forma
-3.0% appreciation · 8.0% rent growth · sell at horizon
- IRR
- 8.6%
- Equity multiple
- 1.36×
- Total profit
- $8,489
- Equity at exit
- $12,674
- IRR
- 21.4%
- Equity multiple
- 3.23×
- Total profit
- $52,987
- Equity at exit
- $7,349
Cash invested: $23,800 (down + closing). Projections, not guarantees.
Landlord ↔ Tenant lean methodology
- Overall (STATE)
- 27 Tenant-Leaning
- State Maryland
- 27 Tenant-Leaning · D+14
- County
- — inherits STATE
- City
- — inherits STATE
ZIP-level market 21502
- Home prices YoY
- -17.4%
- Rents YoY
- 10.9%
- Active inventory
- 235
- Price-to-rent
- 7.2×
Monthly cashflow live
- Estimated rent
- $987 medium interval (Pro) →
- Mortgage (P&I)
- −$446
- Tax from tax record
- −$30 /mo · $360/yr
- Insurance
- −$35
- HOA
- −$0
- Vacancy / Maint / Mgmt
- −$207
- Net cashflow
- $268
Break-even live
UW: 25.0% down · 7.5% · 30yr · 1.5% tax · 5.0% vac · 8.0% maint · 8.0% mgmt
Financing live
Cash to close
- Down payment
- $21,250
- Closing costs
- $2,550
- Reserves months
- —
- Total cash needed
- —
Loan-product check · same deal, 3 products live
Conventional
25% down · 7.5% · 30yr
- Down + closing
- —
- Monthly P&I
- —
- Monthly cashflow
- —
- DSCR
- —
- Eligible?
- —
Personal DTI + credit; lowest rate.
DSCR
20% down · 8.5% · 30yr
- Down + closing
- —
- Monthly P&I
- —
- Monthly cashflow
- —
- DSCR
- —
- Eligible?
- —
No personal income docs; deal must DSCR.
Hard money
10% down · 12.0% · 12mo
- Down + closing
- —
- Monthly P&I
- —
- Monthly cashflow
- —
- DSCR
- —
- Eligible?
- —
Short-term bridge; refi at stabilization.
Rent comps 4 comps
| Address | Beds | Baths | Sqft | Rent | $/sqft | DOM | Units | Dist |
|---|---|---|---|---|---|---|---|---|
| 418 N Mechanic St Unit 1B Cumberland, MD | 2.0 | 1.0 | 1000 | $1,195 | $1.20 | 44d | 1 | 0.98mi |
| 424 N Mechanic St Unit 1 Cumberland, MD | 1.0 | 1.0 | 600 | $950 | $1.58 | 44d | 1 | 0.99mi |
| 529 N Centre St Unit Rear Cumberland, MD | 2.0 | 1.0 | 982 | $850 | $0.87 | 44d | 1 | 1.13mi |
| 623 Columbia Ave Unit C Cumberland, MD | 1.0 | 1.0 | 600 | $635 | $1.06 | 44d | 1 | 1.26mi |
Listing history 20 events
-
2026-06-19days on market $85,000 Active 107 DOM
-
2026-06-18days on market $85,000 Active 106 DOM
-
2026-06-17days on market $85,000 Active 105 DOM
-
2026-06-16days on market $85,000 Active 104 DOM
-
2026-06-15days on market $85,000 Active 103 DOM
-
2026-06-14days on market $85,000 Active 101 DOM
-
2026-06-12days on market $85,000 Active 100 DOM
-
2026-06-09days on market $85,000 Active 97 DOM
-
2026-06-08days on market $85,000 Active 96 DOM
-
2026-06-07days on market $85,000 Active 95 DOM
-
2026-06-02days on market $85,000 Active 90 DOM
-
2026-06-01days on market $85,000 Active 89 DOM
-
2026-05-31days on market $85,000 Active 88 DOM
-
2026-05-30days on market $85,000 Active 87 DOM
-
2026-03-04$85,000 Active 1000-char remark
Show marketing remark (1000 chars)
Fixer-Upper with Private Oasis Feel – Priced to Sell! Located in the city yet surrounded by trees, this property offers the best of both worlds—convenience with a peaceful, private setting that feels like your own little oasis. This home is the perfect open canvas for someone looking to make it their own. Much of the hard work has already been completed, giving you a great starting point to add your personal touches and build equity. The home currently features 2 bedrooms, with the potential for more. The full concrete basement could easily be finished to create additional bedrooms, living space, or a recreation area. Many major upgrades already completed including a 1-year-old metal roof, central A/C, backup generator, gutter guards, handicap ramp, some new windows, and all new plumbing. New toilet installed and vanity to be added. Property also features a concrete parking pad and storage shed. Great opportunity to make it your own. Priced to sell – motivated seller.
-
2026-02-11historical
-
2025-12-30price $88,000
-
2025-12-03price $92,000
-
2025-11-23$94,500 Active
-
2023-03-17soldstatus $40,000
ⓘ Source: listings_history table (triggers on properties + properties_extension) + one-shot
backfill from property_details.listing_events for pre-trigger history.
Tax reassessment forecast MD · Partial reset (capped growth)
- Current annual tax
- $360 · $30/mo
- Projected year-2 tax
- $643 · $54/mo
- Expected delta
- +$283/yr (+$24/mo · 78.7%)
ⓘ Screening estimate from a state-policy table — verify with the county assessor before closing.
Climate risk First Street
- Flood 1/10 Low FEMA zone X (unshaded) · 0% chance over 30 yrs
- Wildfire 3/10 Moderate
- Heat 4/10 Moderate 7 d/yr ≥101°F today · 17 d/yr by 30 yrs out
- Wind 2/10 Low
- Air quality 2/10 Low 0 unhealthy d/yr today · 1 by 30 yrs out
Nearby sold comps map
Loading sold comps map…
Walkable amenities ~0.75 mi
Loading nearby amenities…
Taxation est. · year 1
- Rental income
- $11,838
- − Mortgage interest
- −$4,761
- − Property taxes
- −$360
- − Insurance
- −$425
- − Repairs & maintenance
- −$947
- − Management
- −$947
- − Depreciation
- −$2,473
- Taxable income
- $1,925
- Est. tax owed @ 24.0%
- −$462
- After-tax cash flow
- $2,756/yr
For passive investors: Depreciation is non-cash, so a rental often shows a tax loss while cash-flowing — sheltering income. Rental losses are passive: they offset passive income freely, and up to $25,000/yr can offset ordinary (W-2) income if you actively participate and your MAGI is under $100k (phasing out to $0 by $150k); unused losses carry forward. On sale, claimed depreciation is recaptured at up to 25%, and gains may owe capital-gains tax (a 1031 exchange can defer both). Figures are a year-1 estimate at your 24.0% rate — not tax advice; consult a CPA.
Schools (NCES district)
- District
- Allegany County Public Schools
- NCES district ID
- 2400030
- Math proficiency
- 15% ▼ -26.00%
- Reading proficiency
- 30% ▼ -20.00%
- Median HH income
- $39,760
- Composite
- 18.95/100
- National rank
- #8854
- State rank
- #18 of 24 in MD
Livability — Cumberland
- Score
- 78/100
- State rank
- #64
- US rank
- #2385
Category grades
Schools grade is shown separately in the Schools card above.
Census & demographics
- Census place
- Cumberland, MD
- County
- Allegany County · 41,015 people
- City population
- 41,015
- Metro
- Cumberland, MD-WV
- Population (ZIP)
- 41,015
- Household income
- $60,725
- Rent vs Own
- Severe rent burden
- 824.0
Population outlook (Allegany County) Hauer SSP2
- Today (2025)
- 68,778 people
- By 2030
- 66,766 · -2.9%
- By 2040
- 62,784 · -8.7%
- By 2050
- 59,179 · -14.0%
- By 2075
- 50,732 · -26.2%
- By 2100
- 40,837 · -40.6%
Race, ethnicity, and origin ACS 2023
- Neighborhood character
- Predominantly White (83%)
- Race & ethnicity
- White 83% Black 9% Two or more races 5% Hispanic / Latino 2%
- Common ancestry
- Slovak 3% Romanian 2% Italian 1%
- Foreign-born
- 2% · Canada
- Languages at home
- 96% English-only · Spanish 2%
Political lean MEDSL · Allegany
- 2024 margin
- Solid R (+40.3) · D 28.9% · R 69.2% · Other 2.0%
- 2008→2024 swing
- -14.4pp toward R · 2008: -25.9pp · 2024: -40.3pp
- All cycles
- 2024: R+40.3 2020: R+38.3 2016: R+48.0 2012: R+32.9 2008: R+25.9
Not yet ingested
- Civics
- —
Market trends
- HPI YoY
- ▼ -54.33%
- Current HPI
- 258.6676
- Rent YoY
- ▲ 10.88%
- Metro
- Cumberland, MD-WV
- State GDP YoY
- ▲ 2.97%
- F500 in state
- 12
Industry mix (Fortune 500 HQ in MD)
| Industry | F500 HQs | Revenue |
|---|---|---|
| Aerospace / Defense | 1 | $71B |
|
||
| Utilities | 1 | $25B |
|
||
| Hotels | 1 | $24B |
|
||
| Consumer Goods | 1 | $7B |
|
||
| Real Estate | 1 | $6B |
|
||
| Chemicals | 1 | $2B |
|
||
Price history
+112.5% since first listed6 events — show timeline
- 2026-03-04 Listed $85,000 BRIGHT MLS
- 2026-02-11 Listing Removed — BRIGHT MLS
- 2025-12-30 Price Changed $88,000 BRIGHT MLS
- 2025-12-03 Price Changed $92,000 BRIGHT MLS
- 2025-11-23 Listed $94,500 BRIGHT MLS
- 2023-03-17 Sold (Public Records) $40,000 Public Records
Property tax history
+0.4%/yrLatest (2025): $360 · +2.9% YoY. Source: county tax records.
Cash-flow waterfall
monthlySold comps — $/sqft
last 12 mo · ≤1 miLoading sold comps…