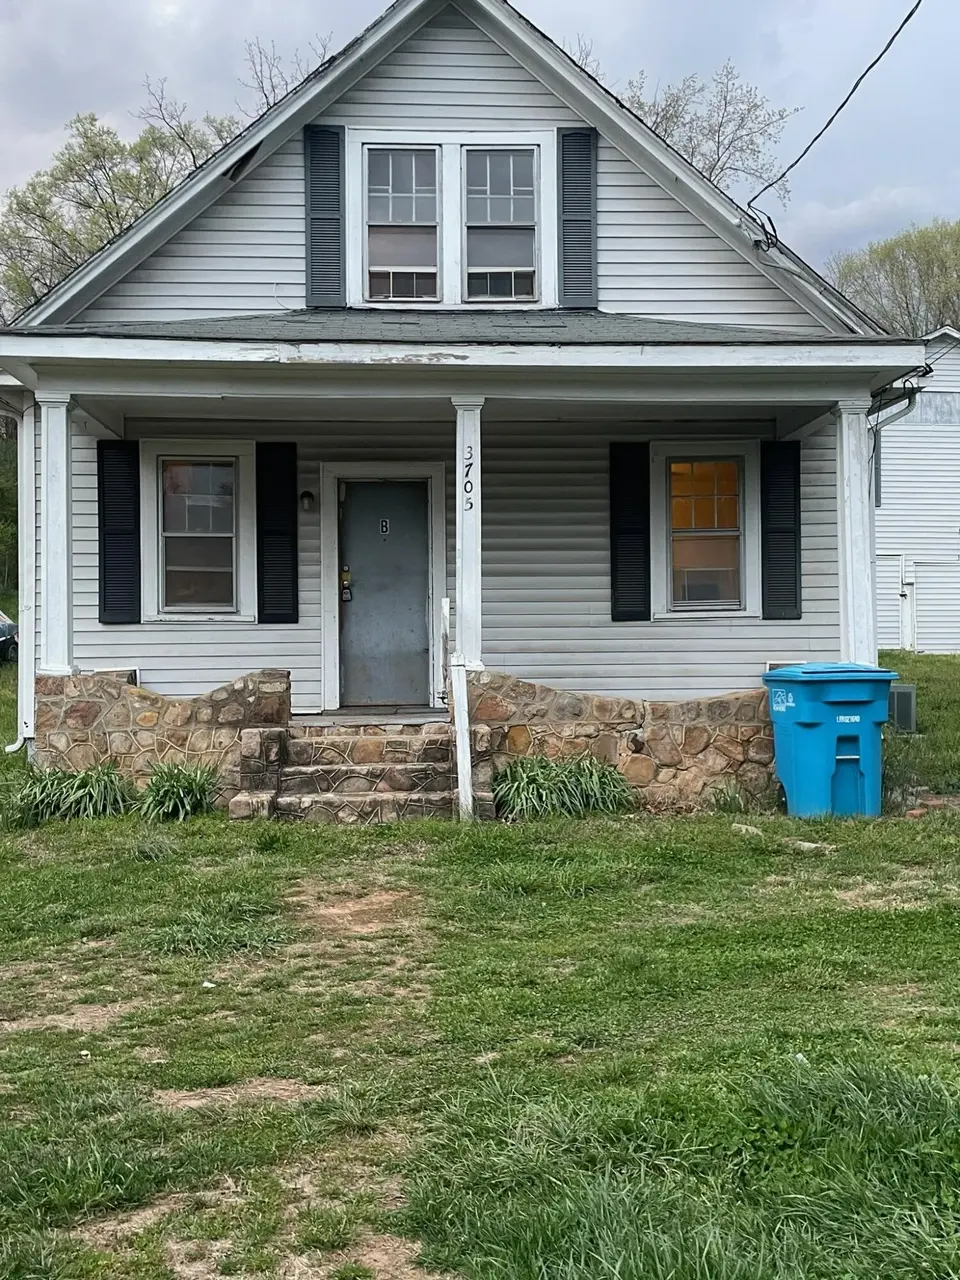
3705 Salem Tpke NW · Roanoke, VA
Flood risk 8/10 · Major
- FEMA flood zone
- X (unshaded)
- Chance of flooding over 30 yrs
- 0.98%
- Est. flood insurance / yr
- $473 – $860
Fire risk 1/10 · Minimal
- Est. fire insurance / yr
- $666 – $1,236
Heat risk 5/10 · Moderate
- Hot days now (above 101°F)
- 7 days/yr
- Hot days in 30 yrs
- 18 days/yr
Wind risk 2/10 · Minimal
- Chance of severe wind over 30 yrs
- 1.0%
Air-quality risk 1/10 · Minimal
- Unhealthy air days now
- 0 days/yr
- Unhealthy air days in 30 yrs
- 0 days/yr
Risk factors via First Street. Map © Google.
Why this score? — see what drove the B- grade
The composite is a weighted blend of 9 inputs, each scored 0–100. Each bar is that input's sub-score; the figure is the points it added to the 100-point composite (weight × sub-score).
- Cash flow +23.7/30.0
- ARV discount +15.0/15.0
- DSCR +7.6/10.0
- 1% rule +5.9/10.0
- Schools +4.1/10.0
- Rent growth +3.9/5.0
- Livability +3.7/5.0
- Condition / age +2.5/5.0
- Appreciation +0.0/10.0
$115,000
🖨 Deal sheet (PDF) 📄 Offer letter ✓ Due diligence
Listing remarks MLS
1 BEDROOM EFFICIENCY APARTMENT OVER THE GARAGE. GREAT FOR OCCUPANT AND RENT OUT THE GARAGE, OR RENT OUT BOTH. HOME SHOULD RENT FOR MIN. $450. AND EFFICIENCY RENT $250 TO $300 - $750 INCOME.
Key facts
- 0.25 acre lot
- Built 1933
Property features AI
Finance
- Other: Lot is approximately 0.25 acre
Exterior
- Home design: Residential property; Built in 1933
- Construction: Built in 1933
- Exterior features: Front porch
Interior
- Bedrooms: 3 bedrooms total, 2 on the main level
- Flooring: Laminate and wood flooring
- Bathrooms: 1 full bathroom, located on the main level
- Heating & cooling: Forced air gas heating; Home has cooling
- Interior features: 3 total rooms
Neighborhood map
What this means for you Summary
Snapshot
- This is a 3-bed/1.0-bath single-family listed at $115k.
Deal economics
- At list price, monthly cash flow is $162 ($2k/yr) — positive.
- The deal already cash-flows at list — no discount required.
- Meets the 1% rule at list price ($1k rent vs $115k).
- Cap rate 8.6% vs local median 4.2% in Roanoke — top-decile yield for the area; either an underpriced asset or a hidden risk that comps aren't pricing in. Stress-test before assuming the spread holds.
Location & tenants
- Location reads 73/100 on livability (#163 in VA) — a middle-class / working-renter tenant base. Strengths: cost of living A+, health & safety A+, housing A; Watch: amenities C-, employment D, crime F.
- Roanoke City Public School District (urban): math 40% / reading 58% proficiency, ranked #102 of 131 in VA (top 78%) — families likely to look elsewhere, expect single-tenant / working-renter base with shorter leases; 67% free/reduced lunch — lower-income household profile, screen leases tightly.
- Zoned schools: Fairview Elementary (math 46% / reading 58%, grade C-, #696 of 1,108 statewide, top 66%, 505 students, 100% FRL); Woodrow Wilson Middle (math 38% / reading 63%, grade C, #226 of 342 statewide, top 67%, 642 students, 99% FRL); William Fleming High (math 66% / reading 68%, grade B, #185 of 319 statewide, top 61%, 1,911 students, 96% FRL) — zoned schools average 98% FRL vs 67% district-wide (32 pts higher); higher-poverty schools than district average — tighter screening recommended.
- Market conditions: Rents rising fast (+5.7%/yr); 152 active listings in the ZIP; 17 comparable units currently listed for rent nearby; rentals at typical pace (median 22d on market — plan ~3-4 weeks tenant-placement turnaround); 47% of comp listings sitting > 30 days — soft ceiling on asking rent; 113 units permitted in Roanoke city in 2024 (0 in 5+ unit buildings).
- This rent runs 32% of the median local income ($47k/yr) — at the standard rent-burdened threshold; future hikes will face affordability resistance.
Forward outlook
- Local home prices are declining (-3.0%/yr); year-one equity from $795 of loan paydown is wiped out by about $3k of value loss. Plan a longer hold.
- Roanoke County population projected at +11% by 2050 — modest demand growth; plan on rents tracking national, not racing it.
- At projected returns (-3.0% appreciation + 5.7% rent growth), your $32k cash investment doubles in ~10 years — after that, you're playing with house money.
Negotiation context
- Only 1 days on market — expect competitive offers; lowballing is unlikely to land.
- 4 sale attempts since 24y ago with the ask held roughly flat each time — persistent listings suggest the price (not the market) is what's stuck; bring a comps-based counter.
- Current owner paid $60k; list at $115k implies a 92% gain — meaningful room to come down on a strong offer.
Risks & watch-outs
- Watch-outs: flood insurance adds $56/mo; built in 1933 — expect roof / HVAC / electrical / plumbing capex.
- Climate carrying-cost: severe flood risk; extreme-heat days projected 7→18/yr by 2055 (HVAC capex compounding) — expect insurance premiums to compound above CPI over the hold.
Questions for the listing agent
- Built in 1933 — when were the roof, HVAC, electrical panel, plumbing, and water heater last replaced?
- What's the actual annual flood-insurance premium (NFIP or private), and is the property in a SFHA with mandatory coverage?
- Is there a deadline driving the sale (1031 exchange, divorce, estate, relocation)? That informs how much negotiation room exists.
- Schools are A-rated — typically a magnet for longer-tenancy family renters. What's the average tenant stay here, and is there a school-zone premium baked into asking?
- Crime grade is F in this area — have there been break-ins, vandalism, or insurance claims at this property in the last 3 years? What carrier currently insures it and at what premium?
- What's the average days-on-market for RENTAL listings here right now (not sales)? A rising rental-DOM trend means longer vacancies and softer asking-rent achievability than the comps imply.
- What's the recent tenant-quality profile in this submarket — average credit score on applications, eviction rate, late-payment / NSF rate, and stable-employment percentage? A property-management company in the area should have these aggregated.
- How much new for-sale + rental construction is in the pipeline within 1–3 miles? Heavy new supply typically softens prices + rents 12–24 months out; constrained supply supports both.
Investment metrics
- 1% rule
- 1.09% ✓
- Cap rate
- 8.57%
- Cash-on-cash
- 8.12%
- DSCR
- 1.36
- GRM
- 7.6
CMA / ARV
- ARV (on-the-fly)
- $159,805
- Comps found
- 12
Show comp detail 12 sales within ~0.75 mi
| Address | Dist | Beds/Ba | Sqft | Sold | Price | $/sf | Match |
|---|---|---|---|---|---|---|---|
| 3809 Woodleigh Rd NW | 0.25mi | 3/1.0 | 1,000 (-3%) | 3mo | $95,000 | $95 | 81 |
| 553 Westwood Blvd NW | 0.34mi | 3/1.0 | 1,000 (-3%) | 2mo | $156,000 | $156 | 78 |
| 3768 Wilmont Ave NW | 0.36mi | 3/1.0 | 1,008 (-2%) | 2mo | $142,000 | $141 | 78 |
| 3726 Rolling Hill Ave NW | 0.35mi | 3/1.0 | 961 (-7%) | 10mo | $150,000 | $156 | 64 |
| 919 Glenn Ridge Rd NW | 0.69mi | 3/1.0 | 1,000 (-3%) | 2mo | $130,000 | $130 | 61 |
| 3664 Rolling Hills Ave NW | 0.34mi | 3/1.0 | 961 (-7%) | 16mo | $174,000 | $181 | 59 |
| 549 Westwood Blvd NW | 0.35mi | 3/1.0 | 968 (-6%) | 20mo | $149,950 | $155 | 57 |
| 539 Crowmoor St NW | 0.40mi | 2/1.0 (-1) | 1,164 (+13%) | 4mo | $149,000 | $128 | 52 |
| 4024 Michigan Ave NW | 0.50mi | 2/1.0 (-1) | 1,080 (+5%) | 21mo | $127,000 | $118 | 46 |
| 3540 Norway Ave NW | 0.60mi | 3/1.0 | 941 (-9%) | 15mo | $175,000 | $186 | 45 |
| 3658 Shenandoah Ave NW | 0.43mi | 3/2.0 | 1,120 (+9%) | 22mo | $185,000 | $165 | 44 |
| 4029 Michigan Ave NW | 0.54mi | 2/1.0 (-1) | 913 (-11%) | 13mo | $111,000 | $122 | 39 |
Match score weights: distance 35% · size 25% · config 20% · recency 20%. Top-matched comps best support the ARV.
Projected returns pro-forma
-3.0% appreciation · 5.71% rent growth · sell at horizon
- IRR
- -3.8%
- Equity multiple
- 0.85×
- Total profit
- $-4,737
- Equity at exit
- $17,147
- IRR
- 8.8%
- Equity multiple
- 1.76×
- Total profit
- $24,609
- Equity at exit
- $9,943
Cash invested: $32,200 (down + closing). Projections, not guarantees.
Landlord ↔ Tenant lean methodology
- Overall (STATE)
- 55 Moderately Landlord-Leaning
- State Virginia
- 55 Moderately Landlord-Leaning · D+2
- County
- — inherits STATE
- City
- — inherits STATE
ZIP-level market 24017
- Home prices YoY
- -28.3%
- Rents YoY
- 5.7%
- Active inventory
- 152
- Price-to-rent
- 7.6×
Monthly cashflow live
- Estimated rent
- $1,256 high interval (Pro) →
- Mortgage (P&I)
- −$603
- Tax from tax record
- −$123 /mo · $1,477/yr
- Insurance
- −$48
- Flood insurance flood zone
- −$56 /mo · $666/yr
- HOA
- −$0
- Vacancy / Maint / Mgmt
- −$264
- Net cashflow
- $162
Break-even live
Sensitivity live
| Price | -10% $227 | -5% $195 | +0% $162 | +5% $130 | +10% $97 |
|---|---|---|---|---|---|
| Rent | -10% $63 | -5% $113 | +0% $162 | +5% $212 | +10% $262 |
| Rate | -1.0pp $220 | -0.5pp $192 | base $162 | +0.5pp $133 | +1.0pp $102 |
UW: 25.0% down · 7.5% · 30yr · 1.5% tax · 5.0% vac · 8.0% maint · 8.0% mgmt
Financing live
Cash to close
- Down payment
- $28,750
- Closing costs
- $3,450
- Reserves months
- —
- Total cash needed
- —
Loan-product check · same deal, 3 products live
Conventional
25% down · 7.5% · 30yr
- Down + closing
- —
- Monthly P&I
- —
- Monthly cashflow
- —
- DSCR
- —
- Eligible?
- —
Personal DTI + credit; lowest rate.
DSCR
20% down · 8.5% · 30yr
- Down + closing
- —
- Monthly P&I
- —
- Monthly cashflow
- —
- DSCR
- —
- Eligible?
- —
No personal income docs; deal must DSCR.
Hard money
10% down · 12.0% · 12mo
- Down + closing
- —
- Monthly P&I
- —
- Monthly cashflow
- —
- DSCR
- —
- Eligible?
- —
Short-term bridge; refi at stabilization.
Rent comps 17 comps
| Address | Beds | Baths | Sqft | Rent | $/sqft | DOM | Units | Dist |
|---|---|---|---|---|---|---|---|---|
| 3802 Panorama Ave NW #6 Roanoke, VA | 2.0 | 1.0 | 900 | $1,050 | $1.17 | 44d | 1 | 0.21mi |
| 3802 Panorama Ave NW #12 Roanoke, VA | 3.0 | 1.0 | 1100 | $995 | $0.90 | 44d | 1 | 0.21mi |
| 3802 Panorama Ave NW #2 Roanoke, VA | 2.0 | 1.0 | 900 | $995 | $1.11 | 44d | 1 | 0.21mi |
| 4626 Autumn Ln NW Roanoke, VA | 3.0 | 2.5 | 1408 | $1,999 | $1.42 | 14d | 1 | 0.83mi |
| 733 29th St NW Roanoke, VA | 2.0–3.0 | 2.0 | 1022 | $1,625 | $1.59 | 14d | 4 | 0.90mi |
| 4310 Tyree Rd NW Roanoke, VA | 3.0 | 1.0 | 913 | $1,650 | $1.81 | 14d | 1 | 0.93mi |
| 2744 Melrose Ave NW Roanoke, VA | 1.0–2.0 | 1.0–1.5 | 936 | $1,045 | $1.12 | 14d | 7 | 0.96mi |
| 1331 Dudley St NW Roanoke, VA | 2.0 | 1.0 | 700 | $1,500 | $2.14 | 14d | 1 | 1.29mi |
| 900 Camelot Dr Salem, VA | 1.0–3.0 | 1.0–1.5 | 905 | $1,760 | $1.94 | 14d | 10 | 1.32mi |
| 3340 Hershberger Rd NW Roanoke, VA | 2.0 | 1.0 | 924 | $1,050 | $1.14 | 44d | 1 | 1.34mi |
| 1301 Burks St SW Unit 204 Roanoke, VA | 2.0 | 1.0 | 794 | $890 | $1.12 | 44d | 1 | 1.35mi |
| 2633 Westover Ave SW Roanoke, VA | 2.0 | 1.0 | 828 | $1,045 | $1.26 | 14d | 1 | 1.36mi |
| 2633 Westover Ave SW Unit 1 Roanoke, VA | 2.0 | 1.0 | 828 | $1,045 | $1.26 | 22d | 1 | 1.36mi |
| 2627 Westover Ave SW Roanoke, VA | 2.0 | 1.0 | 828 | $1,015 | $1.23 | 45d | 1 | 1.37mi |
| 2601 Westover Ave SW Roanoke, VA | 2.0 | 1.0 | 828 | $940 | $1.14 | 45d | 1 | 1.39mi |
| 2251 Mountain View Ter SW Roanoke, VA | 2.0 | 1.0 | 830 | $988 | $1.19 | 44d | 1 | 1.41mi |
| 2608 Florida Ave NW Roanoke, VA | 3.0 | 1.0 | 1394 | $1,600 | $1.15 | 22d | 1 | 1.48mi |
Listing history 11 events
-
2026-05-20status Pending
-
2026-05-20$115,000 Active
-
2021-03-25soldstatus $60,000
-
2021-02-02historical
-
2021-01-26$79,950
-
2003-04-30soldstatus $45,000 189-char remark
Show marketing remark (189 chars)
1 BEDROOM EFFICIENCY APARTMENT OVER THE GARAGE. GREAT FOR OCCUPANT AND RENT OUT THE GARAGE, OR RENT OUT BOTH. HOME SHOULD RENT FOR MIN. $450. AND EFFICIENCY RENT $250 TO $300 - $750 INCOME.
-
2003-04-25soldstatus $45,000
-
2003-01-17$47,500 189-char remark
Show marketing remark (189 chars)
1 BEDROOM EFFICIENCY APARTMENT OVER THE GARAGE. GREAT FOR OCCUPANT AND RENT OUT THE GARAGE, OR RENT OUT BOTH. HOME SHOULD RENT FOR MIN. $450. AND EFFICIENCY RENT $250 TO $300 - $750 INCOME.
-
2002-05-29historical
-
2002-05-16$55,950
-
1985-11-19soldstatus $14,000
ⓘ Source: listings_history table (triggers on properties + properties_extension) + one-shot
backfill from property_details.listing_events for pre-trigger history.
Tax reassessment forecast VA · Resets to sale price
- Current annual tax
- $1,477 · $123/mo
- Projected year-2 tax
- $1,477 · $123/mo
- Expected delta
- $0/yr ($0/mo · 0.0%)
ⓘ Screening estimate from a state-policy table — verify with the county assessor before closing.
Climate risk First Street
- Flood 8/10 Severe FEMA zone X (unshaded) · 98% chance over 30 yrs
- Wildfire 1/10 Low
- Heat 5/10 Major 7 d/yr ≥101°F today · 18 d/yr by 30 yrs out
- Wind 2/10 Low 100% chance of damaging wind over 30 yrs
- Air quality 1/10 Low 0 unhealthy d/yr today · 0 by 30 yrs out
Nearby sold comps map
Loading sold comps map…
Walkable amenities ~0.75 mi
Loading nearby amenities…
Taxation est. · year 1
- Rental income
- $15,068
- − Mortgage interest
- −$6,442
- − Property taxes
- −$1,477
- − Insurance
- −$1,242
- − Repairs & maintenance
- −$1,205
- − Management
- −$1,205
- − Depreciation
- −$3,345
- Taxable income
- $151
- Est. tax owed @ 24.0%
- −$36
- After-tax cash flow
- $1,912/yr
For passive investors: Depreciation is non-cash, so a rental often shows a tax loss while cash-flowing — sheltering income. Rental losses are passive: they offset passive income freely, and up to $25,000/yr can offset ordinary (W-2) income if you actively participate and your MAGI is under $100k (phasing out to $0 by $150k); unused losses carry forward. On sale, claimed depreciation is recaptured at up to 25%, and gains may owe capital-gains tax (a 1031 exchange can defer both). Figures are a year-1 estimate at your 24.0% rate — not tax advice; consult a CPA.
Schools (NCES district)
- District
- Roanoke City Public School District
- NCES district ID
- 5103300
- Math proficiency
- 40% ▼ -38.00%
- Reading proficiency
- 58% ▼ -12.00%
- Median HH income
- $38,592
- Composite
- 40.8/100
- National rank
- #3639
- State rank
- #102 of 131 in VA
Livability — Roanoke
- Score
- 73/100
- State rank
- #163
- US rank
- #5055
Category grades
Schools grade is shown separately in the Schools card above.
Census & demographics
- Census place
- Roanoke, VA
- County
- Roanoke City · 101,625 people
- City population
- 168,930
- Metro
- Roanoke, VA
- Population (ZIP)
- 23,678
- Household income
- $47,360
- Rent vs Own
- Severe rent burden
- 913.0
Population outlook (Roanoke County) Hauer SSP2
- Today (2025)
- 106,094 people
- By 2030
- 108,927 · +2.7%
- By 2040
- 114,104 · +7.5%
- By 2050
- 118,032 · +11.3%
- By 2075
- 123,363 · +16.3%
- By 2100
- 116,827 · +10.1%
Race, ethnicity, and origin ACS 2023
- Neighborhood character
- Diverse neighborhood (Simpson 0.58)
- Race & ethnicity
- Black 59% White 25% Hispanic / Latino 9% Asian 4% Two or more races 4%
- Hispanic origin (detail)
- Mexican 2% Cuban 1%
- Common ancestry
- Slovak 1% Romanian 1% Lithuanian 1%
- Foreign-born
- 9% · Canada, China, Vietnam
- Languages at home
- 87% English-only · Spanish 8% Other Indo-European 3% German/W. Germanic 1%
Political lean MEDSL · Roanoke
- 2024 margin
- Strong D (+23.6) · D 61.1% · R 37.5% · Other 1.4%
- 2008→2024 swing
- +0.2pp no change · 2008: 23.4pp · 2024: 23.6pp
- All cycles
- 2024: D+23.6 2020: D+25.8 2016: D+17.6 2012: D+21.5 2008: D+23.4
Not yet ingested
- Civics
- —
Market trends
- HPI YoY
- ▼ -78.29%
- Current HPI
- 198.5991
- Rent YoY
- ▲ 5.71%
- Metro
- Roanoke, VA
- State GDP YoY
- ▲ 2.40%
- F500 in state
- 50
Industry mix (Fortune 500 HQ in VA)
| Industry | F500 HQs | Revenue |
|---|---|---|
| Aerospace / Defense | 4 | $236B |
|
||
| Technology / Defense | 3 | $32B |
|
||
| Financial Services | 2 | $176B |
|
||
| Utilities | 2 | $27B |
|
||
| Insurance | 2 | $25B |
|
||
| Technology | 2 | $15B |
|
||
Price history
+721.4% since first listed11 events — show timeline
- 2026-05-20 Pending — MLSRV
- 2026-05-20 Listed $115,000 MLSRV
- 2021-03-25 Sold (Public Records) $60,000 Public Records
- 2021-02-02 Listing Removed — MLSRV
- 2021-01-26 Listed $79,950 MLSRV
- 2003-04-30 Sold (MLS) $45,000 MLSRV
- 2003-04-25 Sold (Public Records) $45,000 Public Records
- 2003-01-17 Listed $47,500 MLSRV
- 2002-05-29 Listing Removed — MLSRV
- 2002-05-16 Listed $55,950 MLSRV
- 1985-11-19 Sold (Public Records) $14,000 Public Records
Property tax history
+6.9%/yrLatest (2025): $1,477 · +16.3% YoY. Source: county tax records.
Cash-flow waterfall
monthlySold comps — $/sqft
last 12 mo · ≤1 miLoading sold comps…