127 Clearview Dr · Mount Washington, KY
Flood risk 9/10 · Severe
- FEMA flood zone
- X (unshaded)
- Chance of flooding over 30 yrs
- 0.99%
- Est. flood insurance / yr
- $507 – $1,088
Fire risk 3/10 · Minor
- Est. fire insurance / yr
- $839 – $1,559
Heat risk 5/10 · Moderate
- Hot days now (above 105°F)
- 7 days/yr
- Hot days in 30 yrs
- 19 days/yr
Wind risk 2/10 · Minimal
- Chance of severe wind over 30 yrs
- 3.0%
Air-quality risk 3/10 · Minor
- Unhealthy air days now
- 2 days/yr
- Unhealthy air days in 30 yrs
- 3 days/yr
Risk factors via First Street. Map © Google.
Why this score? — see what drove the C+ grade
The composite is a weighted blend of 9 inputs, each scored 0–100. Each bar is that input's sub-score; the figure is the points it added to the 100-point composite (weight × sub-score).
- Cash flow +21.5/30.0
- ARV discount +15.0/15.0
- DSCR +6.9/10.0
- 1% rule +5.1/10.0
- Livability +3.5/5.0
- Schools +3.1/10.0
- Rent growth +2.5/5.0
- Condition / age +2.5/5.0
- Appreciation +0.0/10.0
$199,000
🖨 Deal sheet 📄 Offer letter ✓ Due diligence
Listing remarks
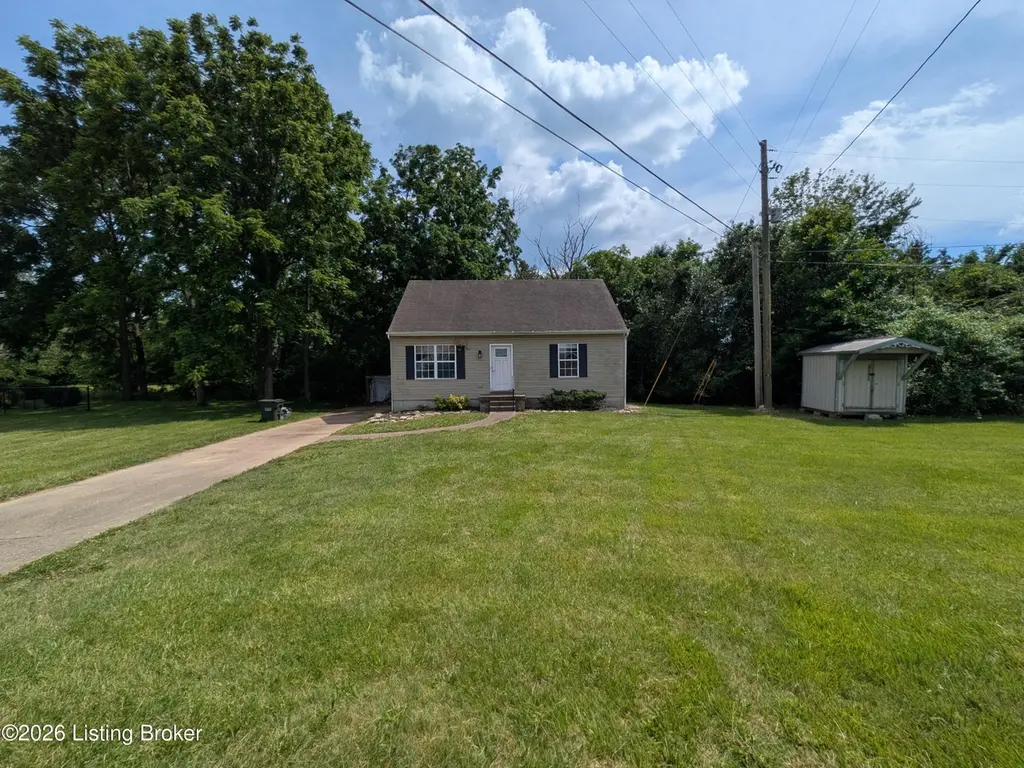
Opportunity awaits on this private . 88-acre lot in an established Mount Washington neighborhood. Whether you're a homeowner looking to create your ideal space or an investor seeking your next project, this 3-bedroom, 2-bath home offers tremendous potential. The functional floor plan provides a solid foundation for updates and improvements, while the spacious lot delivers privacy, room to roam, and a peaceful creek just beyond the back deck. Enjoy the feeling of a secluded retreat with the convenience of nearby shopping, dining, and schools. Being sold as-is, this property presents an excellent chance to add value and make it your own. The home currently is not connected to electricity and
Key facts
- Private lot
- Creek
- Back deck
Tags
Property features AI
Finance
- Other: Subdivision: CLEARVIEW ACRES
- HOA & community: No association fee
Exterior
- Parking: Driveway
- Utilities: Electricity connected
- Home design: Single-family Cape Cod; Two stories; Above-grade finished living area reported as 1,326
- Construction: Vinyl siding; Shingle roof; Crawl space foundation; Year built reported as 1000
- Exterior features: Corner lot; Waterfront property; No fencing
Interior
- Kitchen: Kitchen on the first floor
- Bedrooms: Three bedrooms total; One bedroom on the first floor; Two bedrooms on the second floor
- Bathrooms: Two full bathrooms; Full bathrooms located on the second floor
- Heating & cooling: Heat pump heating (electric); Central air conditioning
- Interior features: Six total rooms; Five closets; No basement; Living room on the first floor
- Laundry & utility: First-floor laundry
Neighborhood map
What this means for you Summary
Snapshot
- This is a 3-bed/2.0-bath single-family listed at $199k.
Deal economics
- At list price, monthly cash flow is $231 ($3k/yr) — positive.
- The deal already cash-flows at list — no discount required.
- Meets the 1% rule at list price ($2k rent vs $199k).
- Cap rate 8.1% vs local median 3.1% in Mount Washington — top-decile yield for the area; either an underpriced asset or a hidden risk that comps aren't pricing in. Stress-test before assuming the spread holds.
Location & tenants
- Location reads 70/100 on livability (#158 in KY) — a middle-class / working-renter tenant base. Strengths: crime A+, cost of living A+, housing A+; Watch: amenities F, commute F, health & safety F.
- Bullitt County (suburban): math 29% / reading 41% proficiency, ranked #55 of 165 in KY (top 33%) — families likely to look elsewhere, expect single-tenant / working-renter base with shorter leases.
- Market conditions: 295 active listings in the ZIP; 6 comparable units currently listed for rent nearby; rentals at typical pace (median 24d on market — plan ~3-4 weeks tenant-placement turnaround); solid renter incomes; 380 units permitted in Bullitt County in 2024 (8 in 5+ unit buildings).
Forward outlook
- Local home prices are declining (-3.0%/yr); year-one equity from $1k of loan paydown is wiped out by about $6k of value loss. Plan a longer hold.
- Bullitt County population projected at +22% by 2050 — long-run rental-demand tailwind backs the buy-and-hold thesis.
Negotiation context
- Only 9 days on market — expect competitive offers; lowballing is unlikely to land.
Risks & watch-outs
- Watch-outs: flood insurance adds $66/mo; built in 1000 — expect roof / HVAC / electrical / plumbing capex.
- Climate carrying-cost: severe flood risk; extreme-heat days projected 7→19/yr by 2055 (HVAC capex compounding) — expect insurance premiums to compound above CPI over the hold.
Questions for the listing agent
- Built in 1000 — when were the roof, HVAC, electrical panel, plumbing, and water heater last replaced?
- What's the actual annual flood-insurance premium (NFIP or private), and is the property in a SFHA with mandatory coverage?
- Is there a deadline driving the sale (1031 exchange, divorce, estate, relocation)? That informs how much negotiation room exists.
- What's the average days-on-market for RENTAL listings here right now (not sales)? A rising rental-DOM trend means longer vacancies and softer asking-rent achievability than the comps imply.
- What's the recent tenant-quality profile in this submarket — average credit score on applications, eviction rate, late-payment / NSF rate, and stable-employment percentage? A property-management company in the area should have these aggregated.
- How much new for-sale + rental construction is in the pipeline within 1–3 miles? Heavy new supply typically softens prices + rents 12–24 months out; constrained supply supports both.
Investment metrics
- 1% rule
- 1.01% ✓
- Cap rate
- 8.09%
- Cash-on-cash
- 6.42%
- DSCR
- 1.29
- GRM
- 8.2
CMA / ARV
- ARV (on-the-fly)
- $287,742
- Comps found
- 12
Show comp detail 12 sales within ~0.75 mi
| Address | Dist | Beds/Ba | Sqft | Sold | Price | $/sf | Match |
|---|---|---|---|---|---|---|---|
| 267 Louis Ln | 0.21mi | 3/2.0 | 1,305 (-2%) | 1mo | $276,500 | $212 | 87 |
| 309 Meadowcrest Dr | 0.26mi | 3/2.0 | 1,270 (-4%) | 1mo | $275,000 | $217 | 80 |
| 268 Spencer Ln | 0.32mi | 3/2.0 | 1,230 (-7%) | 1mo | $270,000 | $220 | 72 |
| 188 Meadowcrest Dr | 0.19mi | 3/2.0 | 1,482 (+12%) | 4mo | $300,000 | $202 | 68 |
| 137 Meadow Park Ct | 0.03mi | 2/2.0 (-1) | 1,130 (-15%) | 4mo | $230,000 | $204 | 66 |
| 186 Kevin Pl | 0.63mi | 3/2.0 | 1,360 (+3%) | 2mo | $291,000 | $214 | 65 |
| 106 Willow Creek Dr | 0.22mi | 3/2.0 | 1,128 (-15%) | 2mo | $249,900 | $222 | 63 |
| 819 Justin Trl | 0.34mi | 3/2.0 | 1,176 (-11%) | 3mo | $275,000 | $234 | 63 |
| 214 Spencer Ln | 0.36mi | 3/2.0 | 1,171 (-12%) | 3mo | $305,000 | $260 | 61 |
| 418 Oak Run Dr | 0.40mi | 3/2.0 | 1,178 (-11%) | 4mo | $276,400 | $235 | 60 |
| 134 Lincoln Dr | 0.56mi | 3/1.0 | 1,200 (-10%) | 1mo | $245,000 | $204 | 53 |
| 225 Adams Dr | 0.58mi | 3/1.0 | 1,209 (-9%) | 3mo | $250,000 | $207 | 52 |
Match score weights: distance 35% · size 25% · config 20% · recency 20%. Top-matched comps best support the ARV.
Projected returns pro-forma
-3.0% appreciation · 3.0% rent growth · sell at horizon
- IRR
- -8.5%
- Equity multiple
- 0.69×
- Total profit
- $-17,487
- Equity at exit
- $29,672
- IRR
- 1.0%
- Equity multiple
- 1.07×
- Total profit
- $3,830
- Equity at exit
- $17,206
Cash invested: $55,720 (down + closing). Projections, not guarantees.
Landlord ↔ Tenant lean methodology
- Overall (STATE)
- 83 Strongly Landlord-Friendly
- State Kentucky
- 83 Strongly Landlord-Friendly · R+16
- County
- — inherits STATE
- City
- — inherits STATE
ZIP-level market 40047
- Home prices YoY
- -18.8%
- Active inventory
- 295
- Price-to-rent
- 8.2×
Monthly cashflow live
- Estimated rent
- $2,011 high interval (Pro) →
- Mortgage (P&I)
- −$1,044
- Tax from tax record
- −$164 /mo · $1,969/yr
- Insurance
- −$83
- Flood insurance flood zone
- −$66 /mo · $798/yr
- HOA
- −$0
- Vacancy / Maint / Mgmt
- −$422
- Net cashflow
- $231
Break-even live
UW: 25.0% down · 7.5% · 30yr · 1.5% tax · 5.0% vac · 8.0% maint · 8.0% mgmt
Financing live
Cash to close
- Down payment
- $49,750
- Closing costs
- $5,970
- Reserves months
- —
- Total cash needed
- —
Loan-product check · same deal, 3 products live
Conventional
25% down · 7.5% · 30yr
- Down + closing
- —
- Monthly P&I
- —
- Monthly cashflow
- —
- DSCR
- —
- Eligible?
- —
Personal DTI + credit; lowest rate.
DSCR
20% down · 8.5% · 30yr
- Down + closing
- —
- Monthly P&I
- —
- Monthly cashflow
- —
- DSCR
- —
- Eligible?
- —
No personal income docs; deal must DSCR.
Hard money
10% down · 12.0% · 12mo
- Down + closing
- —
- Monthly P&I
- —
- Monthly cashflow
- —
- DSCR
- —
- Eligible?
- —
Short-term bridge; refi at stabilization.
Rent comps 6 comps
| Address | Beds | Baths | Sqft | Rent | $/sqft | DOM | Units | Dist |
|---|---|---|---|---|---|---|---|---|
| 235 Ables Way Mt Washington, KY | 2.0 | 1.0 | 992 | $1,190 | $1.20 | 1d | 5 | 0.62mi |
| 9495 Highway 44 E Mount Washington, KY | 3.0 | 1.5 | 1508 | $2,998 | $1.99 | 43d | 1 | 0.94mi |
| 113 Taylor Ct Mount Washington, KY | 3.0 | 2.0 | 1448 | $2,320 | $1.60 | 1d | 1 | 0.96mi |
| 398 Deer Park Way Mount Washington, KY | 3.0 | 2.0 | 1198 | $1,800 | $1.50 | 23d | 1 | 1.26mi |
| 202 Harvest Point Way Mount Washington, KY | 3.0 | 2.5 | 1657 | $2,275 | $1.37 | 23d | 1 | 1.31mi |
| 189 Deer Park Way Mount Washington, KY | 3.0 | 2.0 | 1300 | $2,065 | $1.59 | 1d | 1 | 1.37mi |
Listing history 9 events
-
2026-06-16status $199,000 Pending 9 DOM
-
2026-06-15days on market $199,000 Active 9 DOM
-
2026-06-13days on market $199,000 Active 7 DOM
-
2026-06-10days on market $199,000 Active 4 DOM
-
2026-06-09days on market $199,000 Active 3 DOM
-
2026-06-08days on market $199,000 Active 2 DOM
-
2026-06-08remarks 699-char remark
-
2026-06-07remarks 689-char remark
-
2026-06-07$199,000 Active 1 DOM
ⓘ Source: listings_history table (triggers on properties + properties_extension) + one-shot
backfill from property_details.listing_events for pre-trigger history.
Tax reassessment forecast KY · Resets to sale price
- Current annual tax
- $1,969 · $164/mo
- Projected year-2 tax
- $1,969 · $164/mo
- Expected delta
- $0/yr ($0/mo · -0.0%)
ⓘ Screening estimate from a state-policy table — verify with the county assessor before closing.
Climate risk First Street
- Flood 9/10 Extreme FEMA zone X (unshaded) · 99% chance over 30 yrs
- Wildfire 3/10 Moderate
- Heat 5/10 Major 7 d/yr ≥105°F today · 19 d/yr by 30 yrs out
- Wind 2/10 Low 3% chance of damaging wind over 30 yrs
- Air quality 3/10 Moderate 2 unhealthy d/yr today · 3 by 30 yrs out
Nearby sold comps map
Loading sold comps map…
Walkable amenities ~0.75 mi
Loading nearby amenities…
Taxation est. · year 1
- Rental income
- $24,129
- − Mortgage interest
- −$11,147
- − Property taxes
- −$1,969
- − Insurance
- −$1,792
- − Repairs & maintenance
- −$1,930
- − Management
- −$1,930
- − Depreciation
- −$5,789
- Taxable loss
- −$430
- Est. tax savings @ 24.0%
- +$103
- After-tax cash flow
- $2,880/yr
For passive investors: Depreciation is non-cash, so a rental often shows a tax loss while cash-flowing — sheltering income. Rental losses are passive: they offset passive income freely, and up to $25,000/yr can offset ordinary (W-2) income if you actively participate and your MAGI is under $100k (phasing out to $0 by $150k); unused losses carry forward. On sale, claimed depreciation is recaptured at up to 25%, and gains may owe capital-gains tax (a 1031 exchange can defer both). Figures are a year-1 estimate at your 24.0% rate — not tax advice; consult a CPA.
Schools (NCES district)
- District
- Bullitt County
- NCES district ID
- 2100750
- Math proficiency
- 29% ▼ -15.00%
- Reading proficiency
- 41% ▼ -14.00%
- Median HH income
- $55,009
- Composite
- 30.78/100
- National rank
- #6151
- State rank
- #55 of 165 in KY
Livability — Mount Washington
- Score
- 70/100
- State rank
- #158
- US rank
- #7984
Category grades
Schools grade is shown separately in the Schools card above.
Census & demographics
- Census place
- Mount Washington, KY
- County
- Bullitt County · 62,065 people
- City population
- 23,662
- Metro
- Louisville/Jefferson County, KY-IN
- Population (ZIP)
- 23,662
- Household income
- $99,124
- Rent vs Own
- Severe rent burden
- 90.0
Population outlook (Bullitt County) Hauer SSP2
- Today (2025)
- 89,555 people
- By 2030
- 94,389 · +5.4%
- By 2040
- 102,759 · +14.7%
- By 2050
- 108,955 · +21.7%
- By 2075
- 121,898 · +36.1%
- By 2100
- 126,383 · +41.1%
Race, ethnicity, and origin ACS 2023
- Neighborhood character
- Predominantly White (92%)
- Race & ethnicity
- White 92% Two or more races 5% Hispanic / Latino 3%
- Common ancestry
- Lithuanian 3% Slovak 2% Iranian 2%
- Foreign-born
- 2% · Canada
- Languages at home
- 97% English-only · Spanish 2%
Political lean MEDSL · Bullitt
- 2024 margin
- Solid R (+51.0) · D 23.8% · R 74.8% · Other 1.4%
- 2008→2024 swing
- -18.7pp toward R · 2008: -32.3pp · 2024: -51.0pp
- All cycles
- 2024: R+51.0 2020: R+48.0 2016: R+49.8 2012: R+35.7 2008: R+32.3
Not yet ingested
- Civics
- —
Market trends
- HPI YoY
- ▼ -61.20%
- Current HPI
- 264.3563
- Rent YoY
- —
- Metro
- Louisville/Jefferson County, KY-IN
- State GDP YoY
- ▲ 1.81%
- F500 in state
- 4
Industry mix (Fortune 500 HQ in KY)
| Industry | F500 HQs | Revenue |
|---|---|---|
| Healthcare | 1 | $118B |
|
||
| Food / Beverage | 1 | $7B |
|
||
Price history
1 event — show timeline
- 2026-06-06 Listed $199,000 Metro Search MLS
Property tax history
+2.8%/yrLatest (2025): $1,969 · -0.8% YoY. Source: county tax records.
Cash-flow waterfall
monthlySold comps — $/sqft
last 12 mo · ≤1 miLoading sold comps…