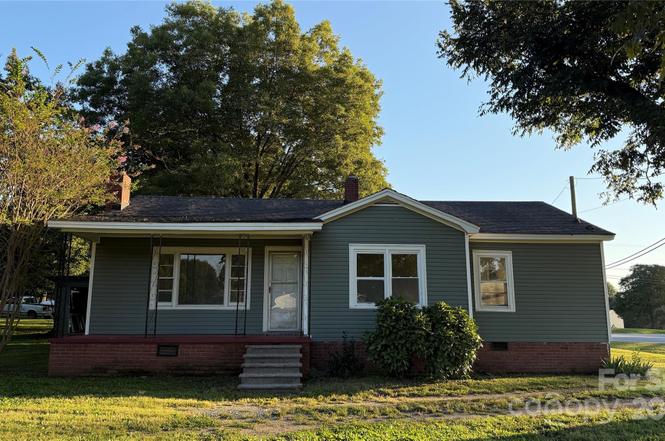
3839 W Dixon Blvd · Shelby, NC
Flood risk 1/10 · Minimal
- FEMA flood zone
- X (unshaded)
- Chance of flooding over 30 yrs
- 0.0%
- Est. flood insurance / yr
- $507 – $1,088
Fire risk 4/10 · Minor
- Est. fire insurance / yr
- $906 – $1,684
Heat risk 6/10 · Moderate
- Hot days now (above 104°F)
- 7 days/yr
- Hot days in 30 yrs
- 17 days/yr
Wind risk 2/10 · Minimal
- Chance of severe wind over 30 yrs
- 3.0%
Air-quality risk 3/10 · Minor
- Unhealthy air days now
- 3 days/yr
- Unhealthy air days in 30 yrs
- 3 days/yr
Risk factors via First Street. Map © Google.
Why this score? — see what drove the D+ grade
The composite is a weighted blend of 9 inputs, each scored 0–100. Each bar is that input's sub-score; the figure is the points it added to the 100-point composite (weight × sub-score).
- Cash flow +15.8/30.0
- ARV discount +11.8/15.0
- DSCR +4.9/10.0
- Schools +4.0/10.0
- Livability +3.8/5.0
- 1% rule +3.2/10.0
- Rent growth +2.5/5.0
- Condition / age +2.5/5.0
- Appreciation +0.0/10.0
$154,999
🖨 Deal sheet (PDF) 📄 Offer letter ✓ Due diligence
Listing remarks
Fantastic home on a corner lot. Located on Highway 74 with ease of access to downtown Shelby and Forest City two bedroom one bath with a third room that could be used as an office or media room brand new heating and cooling system. This is a charming little home with ample front yard, and move-in ready. Schedule your tour today!
Key facts
- Move-in ready
- Corner lot
- Ease of access
Tags
Property features AI
Finance
- HOA & community: No HOA
Exterior
- Parking: Driveway
- Utilities: County water; Septic system installed; Cable available; Electricity connected
- Home design: Single-family residence; Site-built property; One story; Crawl space foundation
- Construction: Vinyl exterior
- Exterior features: Cleared, corner lot; Roads are dirt and paved; publicly maintained road
Interior
- Kitchen: No appliances included
- Bedrooms: 2 bedrooms (both on the main level)
- Flooring: Vinyl flooring; Wood flooring
- Bathrooms: 1 full bathroom (main level)
- Heating & cooling: Central heating; Central air conditioning
- Interior features: Vinyl and wood flooring; 1 total room
- Laundry & utility: Inside laundry with electric dryer hookup in a utility room
Neighborhood map
What this means for you Summary
Snapshot
- This is a 2-bed/1.0-bath single-family listed at $155k.
Deal economics
- At list price, monthly cash flow is $71 ($856/yr) — positive.
- The deal already cash-flows at list — no discount required.
- To meet the 1% rule (rent ≥ 1% of price), the offer needs to be $127k (18.2% below list).
- Recommended offer: $127k (18.2% below list) — sets the bar for 1% rule.
- Cap rate 6.8% vs local median 2.9% in Shelby — top-decile yield for the area; either an underpriced asset or a hidden risk that comps aren't pricing in. Stress-test before assuming the spread holds.
Location & tenants
- Location reads 75/100 on livability (#52 in NC, #4,349 nationally) — a middle-class / working-renter tenant base. Strengths: commute A+, cost of living A+, housing A+; Watch: crime F, employment F.
- Cleveland County Schools (rural): math 47% / reading 49% proficiency, ranked #76 of 178 in NC (top 43%) — families likely to look elsewhere, expect single-tenant / working-renter base with shorter leases.
- Zoned schools: Springmore Elementary (math 53% / reading 56%, grade C, #302 of 1,410 statewide, top 23%, 553 students, 64% FRL); Crest Middle (math 49% / reading 47%, grade C-, #134 of 475 statewide, top 29%, 849 students, 66% FRL); Crest High (math 61% / reading 57%, grade C+, #233 of 535 statewide, top 44%, 1,114 students, 54% FRL) — zoned schools at 61% FRL track the district average.
- Market conditions: 199 active listings in the ZIP; 461 units permitted in Cleveland County in 2024 (38 in 5+ unit buildings).
Forward outlook
- Local home prices are declining (-3.0%/yr); year-one equity from $1k of loan paydown is wiped out by about $5k of value loss. Plan a longer hold.
- Cleveland County population projected at -15% by 2050 — secular population decline; favor cash flow + early exit over multi-decade hold.
Negotiation context
- It's been on market 272 days — a 12% lower offer ($136k) is reasonable based on typical stale-listing flexibility.
Risks & watch-outs
- Watch-outs: built in 1949 — expect roof / HVAC / electrical / plumbing capex.
- Climate carrying-cost: extreme-heat days projected 7→17/yr by 2055 (HVAC capex compounding) — expect insurance premiums to compound above CPI over the hold.
Questions for the listing agent
- It's been on market 272 days. Have you received any prior offers? Is the seller open to a 18% concession, seller financing, or rate buy-down credit?
- Built in 1949 — when were the roof, HVAC, electrical panel, plumbing, and water heater last replaced?
- Why hasn't it sold? Are there any deal-killer items the seller is aware of (foundation, flood, title, zoning, code violations)?
- Is there a deadline driving the sale (1031 exchange, divorce, estate, relocation)? That informs how much negotiation room exists.
- Schools are D-rated, which usually means shorter tenancies and higher turnover. Who's the typical renter profile here, and what's been the actual vacancy rate?
- Crime grade is F in this area — have there been break-ins, vandalism, or insurance claims at this property in the last 3 years? What carrier currently insures it and at what premium?
- The area grade is low — what's the realistic commute time and amenity access for the typical tenant pool here? Any planned neighborhood developments (good or bad) we should know about?
- What's the average days-on-market for RENTAL listings here right now (not sales)? A rising rental-DOM trend means longer vacancies and softer asking-rent achievability than the comps imply.
- What's the recent tenant-quality profile in this submarket — average credit score on applications, eviction rate, late-payment / NSF rate, and stable-employment percentage? A property-management company in the area should have these aggregated.
- How much new for-sale + rental construction is in the pipeline within 1–3 miles? Heavy new supply typically softens prices + rents 12–24 months out; constrained supply supports both.
Investment metrics
- 1% rule
- 0.82% ✗
- Cap rate
- 6.85%
- Cash-on-cash
- 1.97%
- DSCR
- 1.09
- GRM
- 10.2
CMA / ARV
- ARV (on-the-fly)
- $171,444
- Comps found
- 1
Show comp detail 1 sale within ~0.75 mi
| Address | Dist | Beds/Ba | Sqft | Sold | Price | $/sf | Match |
|---|---|---|---|---|---|---|---|
| 3924 W Sunset Blvd | 0.25mi | 2/2.0 | 1,112 (+2%) | 6mo | $175,000 | $157 | 77 |
Match score weights: distance 35% · size 25% · config 20% · recency 20%. Top-matched comps best support the ARV.
Projected returns pro-forma
-3.0% appreciation · 3.0% rent growth · sell at horizon
- IRR
- -13.2%
- Equity multiple
- 0.52×
- Total profit
- $-20,638
- Equity at exit
- $23,111
- IRR
- -4.3%
- Equity multiple
- 0.71×
- Total profit
- $-12,392
- Equity at exit
- $13,401
Cash invested: $43,400 (down + closing). Projections, not guarantees.
Landlord ↔ Tenant lean methodology
- Overall (STATE)
- 85 Strongly Landlord-Friendly
- State North Carolina
- 85 Strongly Landlord-Friendly · R+3
- County
- — inherits STATE
- City
- — inherits STATE
ZIP-level market 28152
- Home prices YoY
- -34.4%
- Active inventory
- 199
- Price-to-rent
- 10.2×
Monthly cashflow live
- Estimated rent
- $1,268 medium interval (Pro) →
- Mortgage (P&I)
- −$813
- Tax from tax record
- −$53 /mo · $637/yr
- Insurance
- −$65
- HOA
- −$0
- Vacancy / Maint / Mgmt
- −$266
- Net cashflow
- $71
Break-even live
Sensitivity live
| Price | -10% $159 | -5% $115 | +0% $71 | +5% $27 | +10% $-16 |
|---|---|---|---|---|---|
| Rent | -10% $-29 | -5% $21 | +0% $71 | +5% $121 | +10% $172 |
| Rate | -1.0pp $149 | -0.5pp $111 | base $71 | +0.5pp $31 | +1.0pp $-10 |
UW: 25.0% down · 7.5% · 30yr · 1.5% tax · 5.0% vac · 8.0% maint · 8.0% mgmt
Financing live
Cash to close
- Down payment
- $38,750
- Closing costs
- $4,650
- Reserves months
- —
- Total cash needed
- —
Loan-product check · same deal, 3 products live
Conventional
25% down · 7.5% · 30yr
- Down + closing
- —
- Monthly P&I
- —
- Monthly cashflow
- —
- DSCR
- —
- Eligible?
- —
Personal DTI + credit; lowest rate.
DSCR
20% down · 8.5% · 30yr
- Down + closing
- —
- Monthly P&I
- —
- Monthly cashflow
- —
- DSCR
- —
- Eligible?
- —
No personal income docs; deal must DSCR.
Hard money
10% down · 12.0% · 12mo
- Down + closing
- —
- Monthly P&I
- —
- Monthly cashflow
- —
- DSCR
- —
- Eligible?
- —
Short-term bridge; refi at stabilization.
Listing history 21 events
-
2026-06-22days on market $154,999 Active 272 DOM
-
2026-06-19days on market $154,999 Active 270 DOM
-
2026-06-18days on market $154,999 Active 269 DOM
-
2026-06-17days on market $154,999 Active 268 DOM
-
2026-06-16days on market $154,999 Active 267 DOM
-
2026-06-15days on market $154,999 Active 266 DOM
-
2026-06-14days on market $154,999 Active 264 DOM
-
2026-06-13days on market $154,999 Active 263 DOM
-
2026-06-10days on market $154,999 Active 261 DOM
-
2026-06-09days on market $154,999 Active 260 DOM
-
2026-06-08days on market $154,999 Active 259 DOM
-
2026-06-07days on market $154,999 Active 258 DOM
-
2026-06-05days on market $154,999 Active 255 DOM
-
2026-06-03days on market $154,999 Active 254 DOM
-
2026-06-02days on market $154,999 Active 253 DOM
-
2026-06-01days on market $154,999 Active 252 DOM
-
2026-05-31days on market $154,999 Active 251 DOM
-
2026-05-30days on market $154,999 Active 250 DOM
-
2026-04-03price $158,000
-
2026-01-21price $159,000
-
2025-09-22$165,000 Active
ⓘ Source: listings_history table (triggers on properties + properties_extension) + one-shot
backfill from property_details.listing_events for pre-trigger history.
Tax reassessment forecast NC · Resets to sale price
- Current annual tax
- $637 · $53/mo
- Projected year-2 tax
- $1,271 · $106/mo
- Expected delta
- +$634/yr (+$53/mo · 99.6%)
ⓘ Screening estimate from a state-policy table — verify with the county assessor before closing.
Climate risk First Street
- Flood 1/10 Low FEMA zone X (unshaded) · 0% chance over 30 yrs
- Wildfire 4/10 Moderate
- Heat 6/10 Major 7 d/yr ≥104°F today · 17 d/yr by 30 yrs out
- Wind 2/10 Low 3% chance of damaging wind over 30 yrs
- Air quality 3/10 Moderate 3 unhealthy d/yr today · 3 by 30 yrs out
Nearby sold comps map
Loading sold comps map…
Walkable amenities ~0.75 mi
Loading nearby amenities…
Taxation est. · year 1
- Rental income
- $15,218
- − Mortgage interest
- −$8,682
- − Property taxes
- −$637
- − Insurance
- −$775
- − Repairs & maintenance
- −$1,217
- − Management
- −$1,217
- − Depreciation
- −$4,509
- Taxable loss
- −$1,820
- Est. tax savings @ 24.0%
- +$437
- After-tax cash flow
- $1,293/yr
For passive investors: Depreciation is non-cash, so a rental often shows a tax loss while cash-flowing — sheltering income. Rental losses are passive: they offset passive income freely, and up to $25,000/yr can offset ordinary (W-2) income if you actively participate and your MAGI is under $100k (phasing out to $0 by $150k); unused losses carry forward. On sale, claimed depreciation is recaptured at up to 25%, and gains may owe capital-gains tax (a 1031 exchange can defer both). Figures are a year-1 estimate at your 24.0% rate — not tax advice; consult a CPA.
Schools (NCES district)
- District
- Cleveland County Schools
- NCES district ID
- 3700900
- Math proficiency
- 47% ▬ 0.00%
- Reading proficiency
- 49% ▲ 4.00%
- Median HH income
- $38,501
- Composite
- 40.03/100
- National rank
- #3823
- State rank
- #76 of 178 in NC
Livability — Shelby
- Score
- 75/100
- State rank
- #52
- US rank
- #4349
Category grades
Schools grade is shown separately in the Schools card above.
Census & demographics
- County
- Cleveland County · 83,736 people
- City population
- 26,134
- Metro
- Shelby, NC
- Population (ZIP)
- 26,134
- Household income
- $57,806
- Rent vs Own
- Severe rent burden
- 768.0
Population outlook (Cleveland County) Hauer SSP2
- Today (2025)
- 93,671 people
- By 2030
- 91,157 · -2.7%
- By 2040
- 85,519 · -8.7%
- By 2050
- 79,708 · -14.9%
- By 2075
- 68,317 · -27.1%
- By 2100
- 57,145 · -39.0%
Race, ethnicity, and origin ACS 2023
- Neighborhood character
- Predominantly White (65%)
- Race & ethnicity
- White 65% Black 22% Two or more races 9% Hispanic / Latino 3%
- Common ancestry
- Slovak 2% Lithuanian 2% Serbian 1%
- Foreign-born
- 2% · Canada
- Languages at home
- 96% English-only · Spanish 3% Other Indo-European 1%
Political lean MEDSL · Cleveland
- 2024 margin
- Solid R (+35.0) · D 32.2% · R 67.2%
- 2008→2024 swing
- -15.1pp toward R · 2008: -19.9pp · 2024: -35.0pp
- All cycles
- 2024: R+35.0 2020: R+32.8 2016: R+30.6 2012: R+20.5 2008: R+19.9
Not yet ingested
- Civics
- —
Market trends
- HPI YoY
- ▼ -116.69%
- Current HPI
- 223.0302
- Rent YoY
- —
- Metro
- Shelby, NC
- State GDP YoY
- ▲ 3.28%
- F500 in state
- 26
Industry mix (Fortune 500 HQ in NC)
| Industry | F500 HQs | Revenue |
|---|---|---|
| Financial Services | 2 | $213B |
|
||
| Retail | 2 | $95B |
|
||
| Industrial Conglomerate | 1 | $38B |
|
||
| Metals / Steel | 1 | $35B |
|
||
| Utilities | 1 | $30B |
|
||
| Industrial Machinery | 1 | $19B |
|
||
Price history
-4.2% since first listed3 events — show timeline
- 2026-04-03 Price Changed $158,000 CANOPYMLS as Distributed by MLS Grid
- 2026-01-21 Price Changed $159,000 CANOPYMLS as Distributed by MLS Grid
- 2025-09-22 Listed $165,000 CANOPYMLS as Distributed by MLS Grid
Property tax history
+3.7%/yrLatest (2025): $637 · +45.2% YoY. Source: county tax records.
Cash-flow waterfall
monthlySold comps — $/sqft
last 12 mo · ≤1 miLoading sold comps…