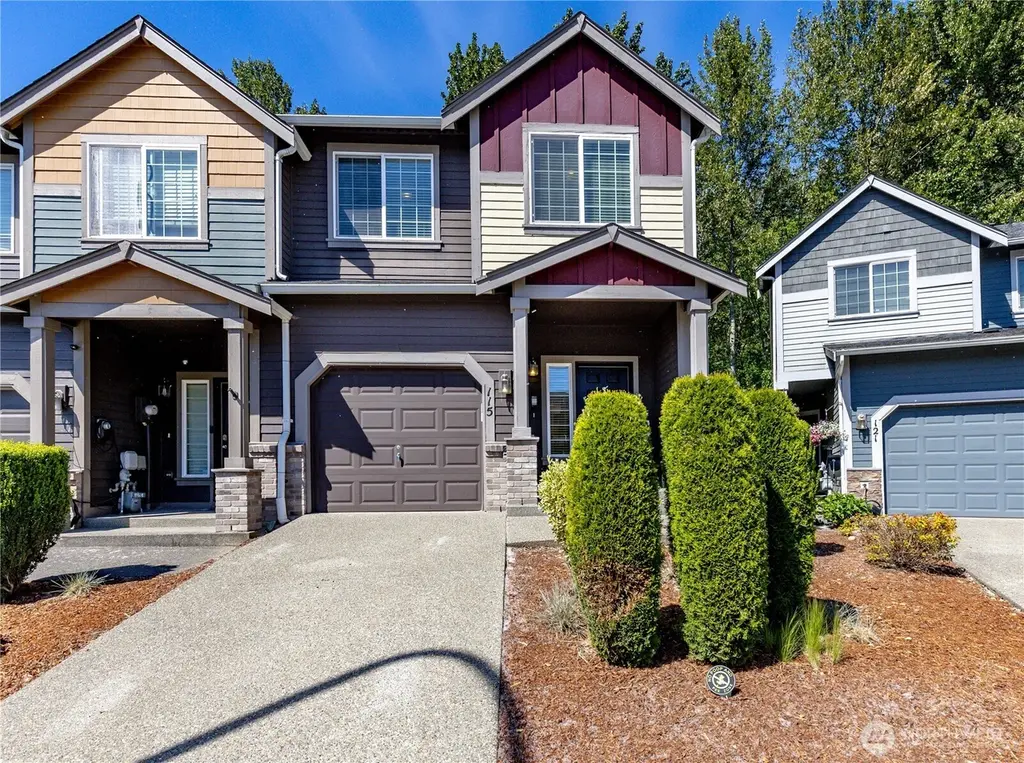
115 60th St SE · Auburn, WA
Flood risk 1/10 · Minimal
- FEMA flood zone
- X (unshaded)
- Chance of flooding over 30 yrs
- 0.0%
- Est. flood insurance / yr
- $507 – $1,088
Fire risk 1/10 · Minimal
- Est. fire insurance / yr
- $604 – $1,122
Heat risk 3/10 · Minor
- Hot days now (above 88°F)
- 7 days/yr
- Hot days in 30 yrs
- 15 days/yr
Wind risk 1/10 · Minimal
- Chance of severe wind over 30 yrs
- —
Air-quality risk 7/10 · Major
- Unhealthy air days now
- 10 days/yr
- Unhealthy air days in 30 yrs
- 11 days/yr
Risk factors via First Street. Map © Google.
Why this score? — see what drove the D grade
The composite is a weighted blend of 9 inputs, each scored 0–100. Each bar is that input's sub-score; the figure is the points it added to the 100-point composite (weight × sub-score).
- Appreciation +10.0/10.0
- ARV discount +9.2/15.0
- Schools +7.1/10.0
- Cash flow +5.7/30.0
- Livability +4.0/5.0
- Condition / age +2.5/5.0
- Rent growth +2.4/5.0
- 1% rule +0.7/10.0
- DSCR +0.1/10.0
$479,950
🖨 Deal sheet (PDF) 📄 Offer letter ✓ Due diligence
Listing remarks
Rare opportunity to own a beautifully maintained Townhome in the highly sought-after Lakeland Hills area with exceptionally low and stable HOA dues of just $57/month. Conveniently located near Lakeland Town Center, HWY 167, parks, schools, and commuter routes, this home combines comfort, practicality, and prime location. The open-concept main level features updated engineered wood flooring, new carpet throughout upper levels, a spacious kitchen with eating bar, dining area, and inviting living room with cozy gas fireplace, plus a convenient 1/2 bath. Enjoy outdoor entertaining in the generously sized private backyard. Upstairs offers a spacious primary suite with 5-piece en suite bath and w
Key facts
- Cozy gas fireplace
- Open concept living
- New carpet
Tags
Property features AI
Finance
- Other: Zoning: AUB; Lot number 4
- Financial info: Accepted financing: Cash, Conventional, FHA, VA
- HOA & community: HOA with monthly fee of $57 (includes common area maintenance); Community governed by CCRs
Exterior
- Parking: Attached garage; 1 covered parking space; 1 uncovered parking space
- Security: Fully fenced yard
- Utilities: Public water (City of Auburn); Sewer connected (City of Auburn); Power by PSE; Natural gas energy source
- Home design: Townhouse (attached/zero lot line); Multi/split levels; Main entry; Has a view; Condition: Good
- Construction: Built in 2010 (effective year); Brick, cement, and wood construction materials; Composition roof; Poured concrete foundation; Builder: Soundbuilt Townhomes
- Exterior features: Brick, cement/concrete, and wood exterior; Fully fenced; Garden space; Cable TV available; Gas available; Curbs, paved streets, and sidewalks
Interior
- Kitchen: Dishwasher; Refrigerator; Stove/Range
- Bedrooms: 3 bedrooms (all on upper level)
- Flooring: Engineered hardwood; Carpet
- Bathrooms: 2 full bathrooms; 1 half bathroom; 2 bathtubs; 2 showers; One main-level bathroom
- Heating & cooling: Forced air heating; No central cooling
- Interior features: Fireplace (gas); Walk-in closet(s); Water heater
- Laundry & utility: Washer; Dryer; Water heater located in garage (gas)
Neighborhood map
What this means for you Summary
Snapshot
- This is a 3-bed/3.0-bath townhouse listed at $480k.
Deal economics
- At list price, monthly cash flow is $-985 ($-12k/yr) — negative.
- To cash-flow at today's rent, offer at most $306k (36.3% below list).
- To meet the 1% rule (rent ≥ 1% of price), the offer needs to be $273k (43.1% below list).
- Recommended offer: $273k (43.1% below list) — sets the bar for 1% rule.
- Cap rate 3.8% vs local median 2.7% in Auburn — top-decile yield for the area; either an underpriced asset or a hidden risk that comps aren't pricing in. Stress-test before assuming the spread holds.
Location & tenants
- Location reads 81/100 on livability (#75 in WA, #1,371 nationally) — a professional / high-income tenant draw. Strengths: amenities A+, commute A+, employment A+; Watch: crime F, cost of living F.
- Dieringer School District (suburban): math 74% / reading 81% proficiency, ranked #6 of 291 in WA (top 2%) — strong family-tenant draw, lease renewals of 3-5y typical; only 9% free/reduced lunch — higher-income household profile.
- Zoned schools: Lake Tapps Elementary (450 students, 22% FRL); North Tapps Middle School (520 students, 24% FRL).
- Market conditions: Rents soft (-0.5%/yr); 298 active listings in the ZIP; 13 comparable units currently listed for rent nearby; rentals leasing fast (median 1d on market — plan ~1-2 weeks tenant-placement turnaround); high-income renter base; 3,209 units permitted in Pierce County in 2024 (1,269 in 5+ unit buildings).
Forward outlook
- In year one you build about $51k of equity ($3k loan paydown + $48k appreciation (10.0% local appreciation)).
- Pierce County population projected at +26% by 2050 — long-run rental-demand tailwind backs the buy-and-hold thesis.
- By year 2, paydown + projected appreciation supports a ~$82k cash-out refi (75% LTV) — recoverable capital for the next deal without selling this one.
Negotiation context
- It's been on market 38 days — a 3% lower offer ($466k) is reasonable based on typical stale-listing flexibility.
- 2 sale attempts since 16y ago with the ask held roughly flat each time — persistent listings suggest the price (not the market) is what's stuck; bring a comps-based counter.
- Current owner paid $195k; list at $480k implies a 146% gain — meaningful room to come down on a strong offer.
Questions for the listing agent
- What do current leases actually rent for vs. the listed asking? Can we see a recent rent roll and the last 12 months of T-12 income?
- It's been on market 38 days. Have you received any prior offers? Is the seller open to a 43% concession, seller financing, or rate buy-down credit?
- What does the HOA fee cover, when was the last increase, and are there any pending special assessments or reserve-fund shortfalls?
- Is there a deadline driving the sale (1031 exchange, divorce, estate, relocation)? That informs how much negotiation room exists.
- Crime grade is F in this area — have there been break-ins, vandalism, or insurance claims at this property in the last 3 years? What carrier currently insures it and at what premium?
- The area grade is low — what's the realistic commute time and amenity access for the typical tenant pool here? Any planned neighborhood developments (good or bad) we should know about?
- What's the average days-on-market for RENTAL listings here right now (not sales)? A rising rental-DOM trend means longer vacancies and softer asking-rent achievability than the comps imply.
- What's the recent tenant-quality profile in this submarket — average credit score on applications, eviction rate, late-payment / NSF rate, and stable-employment percentage? A property-management company in the area should have these aggregated.
- How much new for-sale + rental construction is in the pipeline within 1–3 miles? Heavy new supply typically softens prices + rents 12–24 months out; constrained supply supports both.
Investment metrics
- 1% rule
- 0.57% ✗
- Cap rate
- 3.83%
- Cash-on-cash
- -8.80%
- DSCR
- 0.61
- GRM
- 14.6
CMA / ARV
- ARV (median comp)
- $498,432
- List price
- $479,950
- Delta
- -3.71%
- Verdict
- FAIR
- Comps
- 20 within 1.0 mi
Show comp detail 12 sales within ~0.75 mi
| Address | Dist | Beds/Ba | Sqft | Sold | Price | $/sf | Match |
|---|---|---|---|---|---|---|---|
| 1105 63RD St SE Unit C | 0.66mi | 3/2.5 | 1,372 (-6%) | 3mo | $375,000 | $273 | 54 |
| 1111 62nd St SE Unit 23C | 0.64mi | 3/2.5 | 1,372 (-6%) | 14mo | $399,950 | $292 | 46 |
| 1207 62nd St SE Unit A | 0.71mi | 3/2.5 | 1,511 (+3%) | 17mo | $465,000 | $308 | 45 |
| 6618 Elizabeth Ave SE | 0.54mi | 3/2.5 | 1,305 (-11%) | 11mo | $549,950 | $421 | 45 |
| 6221 Kennedy Ave SE Unit C | 0.64mi | 3/2.5 | 1,510 (+3%) | 22mo | $449,000 | $297 | 45 |
| 911 67th St SE | 0.67mi | 3/2.5 | 1,562 (+7%) | 16mo | $590,000 | $378 | 42 |
| 1210 63rd St SE Unit B | 0.74mi | 3/2.5 | 1,548 (+6%) | 15mo | $437,450 | $283 | 41 |
| 1131 62nd St SE Unit A | 0.69mi | 2/2.5 (-1) | 1,282 (-12%) | 4mo | $393,450 | $307 | 37 |
| 1125 63rd St SE Unit 14-B | 0.69mi | 2/2.5 (-1) | 1,359 (-7%) | 16mo | $415,000 | $305 | 36 |
| 6633 Francis Ave SE | 0.59mi | 3/2.5 | 1,675 (+14%) | 15mo | $589,990 | $352 | 34 |
| 1133 63rd St SE Unit A | 0.70mi | 2/2.5 (-1) | 1,282 (-12%) | 11mo | $399,950 | $312 | 31 |
| 1137 63rd St SE Unit A | 0.70mi | 2/2.5 (-1) | 1,282 (-12%) | 22mo | $420,900 | $328 | 21 |
Match score weights: distance 35% · size 25% · config 20% · recency 20%. Top-matched comps best support the ARV.
Projected returns pro-forma
10.0% appreciation · 0.0% rent growth · sell at horizon
- IRR
- 17.4%
- Equity multiple
- 2.42×
- Total profit
- $190,583
- Equity at exit
- $432,377
- IRR
- 16.0%
- Equity multiple
- 5.44×
- Total profit
- $596,106
- Equity at exit
- $932,437
Cash invested: $134,386 (down + closing). Projections, not guarantees.
Landlord ↔ Tenant lean methodology
- Overall (STATE)
- 28 Tenant-Leaning
- State Washington
- 28 Tenant-Leaning · D+8
- County
- — inherits STATE
- City
- — inherits STATE
ZIP-level market 98092
- Home prices YoY
- 3.3%
- Rents YoY
- -0.5%
- Active inventory
- 298
- Price-to-rent
- 14.6×
Monthly cashflow live
- Estimated rent
- $2,732 high interval (Pro) →
- Mortgage (P&I)
- −$2,517
- Tax from tax record
- −$369 /mo · $4,434/yr
- Insurance
- −$200
- HOA
- −$57
- Vacancy / Maint / Mgmt
- −$574
- Net cashflow
- $-985
Break-even live
Sensitivity live
| Price | -10% $-713 | -5% $-849 | +0% $-985 | +5% $-1,121 | +10% $-1,257 |
|---|---|---|---|---|---|
| Rent | -10% $-1,201 | -5% $-1,093 | +0% $-985 | +5% $-877 | +10% $-769 |
| Rate | -1.0pp $-743 | -0.5pp $-863 | base $-985 | +0.5pp $-1,109 | +1.0pp $-1,236 |
UW: 25.0% down · 7.5% · 30yr · 1.5% tax · 5.0% vac · 8.0% maint · 8.0% mgmt
Financing live
Cash to close
- Down payment
- $119,988
- Closing costs
- $14,398
- Reserves months
- —
- Total cash needed
- —
Loan-product check · same deal, 3 products live
Conventional
25% down · 7.5% · 30yr
- Down + closing
- —
- Monthly P&I
- —
- Monthly cashflow
- —
- DSCR
- —
- Eligible?
- —
Personal DTI + credit; lowest rate.
DSCR
20% down · 8.5% · 30yr
- Down + closing
- —
- Monthly P&I
- —
- Monthly cashflow
- —
- DSCR
- —
- Eligible?
- —
No personal income docs; deal must DSCR.
Hard money
10% down · 12.0% · 12mo
- Down + closing
- —
- Monthly P&I
- —
- Monthly cashflow
- —
- DSCR
- —
- Eligible?
- —
Short-term bridge; refi at stabilization.
Rent comps 13 comps
| Address | Beds | Baths | Sqft | Rent | $/sqft | DOM | Units | Dist |
|---|---|---|---|---|---|---|---|---|
| 6106 Alexander Ave SE Auburn, WA | 3.0 | 2.5 | 1541 | $2,800 | $1.82 | 0d | 1 | 0.01mi |
| 6106 Alexander Ave SE Auburn, WA | 3.0 | 2.5 | 1541 | $2,800 | $1.82 | 1d | 1 | 0.01mi |
| 6170 Terrace View Ln SE Auburn, WA | 1.0–3.0 | 1.0–2.0 | 956 | $2,551 | $2.67 | 0d | 36 | 0.16mi |
| 5909 Panorama Dr SE Unit 11-103 Auburn, WA | 2.0 | 2.5 | 1727 | $2,750 | $1.59 | 45d | 1 | 0.56mi |
| 1105 63rd St SE Unit C Auburn, WA | 3.0 | 2.5 | 1372 | $4,000 | $2.92 | 0d | 1 | 0.66mi |
| 1115 62nd St SE Unit 18B Auburn, WA | 2.0 | 1.5 | 1285 | $2,695 | $2.10 | 3d | 1 | 0.66mi |
| 508 4th Ave SE Pacific, WA | 2.0 | 1.0 | 885 | $2,100 | $2.37 | 26d | 1 | 0.78mi |
| 7101 Lindsay Ave SE Auburn, WA | 1.0–2.0 | 1.0–1.5 | 853 | $2,053 | $2.41 | 0d | 20 | 0.95mi |
| 703 47th St SE Auburn, WA | 2.0 | 1.0–2.0 | 781 | $1,970 | $2.52 | 3d | 7 | 0.99mi |
| 4716 Mill Pond Dr SE Apt 1001 Auburn, WA | 3.0 | 2.5 | 1673 | $2,900 | $1.73 | 12d | 1 | 1.12mi |
| 4704 Mill Pond Dr SE #213 Auburn, WA | 2.0 | 2.0 | 1142 | $2,750 | $2.41 | 4d | 1 | 1.14mi |
| 102 Hawthorne Ave S Pacific, WA | 3.0 | 1.0 | 1285 | $2,950 | $2.30 | 0d | 1 | 1.25mi |
| 6821 Udall Pl SE Auburn, WA | 1.0–3.0 | 1.0–2.0 | 923 | $2,635 | $2.85 | 0d | 28 | 1.38mi |
HOA detail
- Monthly dues
- $57 · $684/yr
- Likely covers
- gas
Listing history 20 events
-
2026-06-21days on market $479,950 Active 38 DOM
-
2026-06-18days on market $479,950 Active 35 DOM
-
2026-06-17days on market $479,950 Active 34 DOM
-
2026-06-16days on market $479,950 Active 33 DOM
-
2026-06-15days on market $479,950 Active 32 DOM
-
2026-06-13days on market $479,950 Active 30 DOM
-
2026-06-13days on market $479,950 Active 29 DOM
-
2026-06-09days on market $479,950 Active 26 DOM
-
2026-06-08days on market $479,950 Active 25 DOM
-
2026-06-07days on market $479,950 Active 24 DOM
-
2026-06-04days on market $479,950 Active 21 DOM
-
2026-06-03days on market $479,950 Active 20 DOM
-
2026-06-02days on market $479,950 Active 19 DOM
-
2026-06-02price $479,950 Active 18 DOM
-
2026-06-01days on market $495,000 Active 18 DOM
-
2026-05-31days on market $495,000 Active 17 DOM
-
2026-05-14$495,000 Active
-
2010-10-08soldstatus $195,172 Sold
-
2010-09-07status Pending
-
2010-08-04$189,950 Active
ⓘ Source: listings_history table (triggers on properties + properties_extension) + one-shot
backfill from property_details.listing_events for pre-trigger history.
Tax reassessment forecast WA · Resets to sale price
- Current annual tax
- $4,434 · $369/mo
- Projected year-2 tax
- $4,704 · $392/mo
- Expected delta
- +$270/yr (+$22/mo · 6.1%)
ⓘ Screening estimate from a state-policy table — verify with the county assessor before closing.
Climate risk First Street
- Flood 1/10 Low FEMA zone X (unshaded) · 0% chance over 30 yrs
- Wildfire 1/10 Low
- Heat 3/10 Moderate 7 d/yr ≥88°F today · 15 d/yr by 30 yrs out
- Wind 1/10 Low
- Air quality 7/10 Severe 10 unhealthy d/yr today · 11 by 30 yrs out
Nearby sold comps map
Loading sold comps map…
Walkable amenities ~0.75 mi
Loading nearby amenities…
Taxation est. · year 1
- Rental income
- $32,784
- − Mortgage interest
- −$26,885
- − Property taxes
- −$4,434
- − Insurance
- −$2,400
- − Repairs & maintenance
- −$2,623
- − Management
- −$2,623
- − HOA
- −$684
- − Depreciation
- −$13,962
- Taxable loss
- −$20,825
- Est. tax savings @ 24.0%
- +$4,998
- After-tax cash flow
- $-6,823/yr
For passive investors: Depreciation is non-cash, so a rental often shows a tax loss while cash-flowing — sheltering income. Rental losses are passive: they offset passive income freely, and up to $25,000/yr can offset ordinary (W-2) income if you actively participate and your MAGI is under $100k (phasing out to $0 by $150k); unused losses carry forward. On sale, claimed depreciation is recaptured at up to 25%, and gains may owe capital-gains tax (a 1031 exchange can defer both). Figures are a year-1 estimate at your 24.0% rate — not tax advice; consult a CPA.
Schools (NCES district)
- District
- Dieringer School District
- NCES district ID
- 5302130
- Math proficiency
- 74% ▬ 0.00%
- Reading proficiency
- 81% ▲ 3.00%
- Median HH income
- $94,738
- Composite
- 70.73/100
- National rank
- #511
- State rank
- #6 of 291 in WA
Livability — Auburn
- Score
- 81/100
- State rank
- #75
- US rank
- #1371
Category grades
Schools grade is shown separately in the Schools card above.
Census & demographics
- Census place
- Auburn, WA
- County
- King County · 2,251,916 people
- City population
- 74,969
- Metro
- Seattle-Tacoma-Bellevue, WA
- Population (ZIP)
- 50,224
- Household income
- $122,300
- Rent vs Own
- Severe rent burden
- 1041.0
Population outlook (Pierce County) Hauer SSP2
- Today (2025)
- 956,648 people
- By 2030
- 1,010,862 · +5.7%
- By 2040
- 1,113,170 · +16.4%
- By 2050
- 1,206,524 · +26.1%
- By 2075
- 1,436,425 · +50.2%
- By 2100
- 1,563,654 · +63.5%
Race, ethnicity, and origin ACS 2023
- Neighborhood character
- Diverse neighborhood (Simpson 0.66)
- Race & ethnicity
- White 54% Hispanic / Latino 15% Asian 14% Two or more races 13% Native American 4% Black 3% Pacific Islander 2%
- Hispanic origin (detail)
- Mexican 12%
- Common ancestry
- Portuguese 4% Italian 3% Subsaharan African 3%
- Foreign-born
- 20% · Canada, South Korea, Vietnam
- Languages at home
- 73% English-only · Spanish 9% Russian/Polish/Slavic 4% Other Indo-European 3%
Political lean MEDSL · Pierce
- 2024 margin
- D (+10.8) · D 53.9% · R 43.1% · Other 3.0%
- 2008→2024 swing
- -1.4pp toward R · 2008: 12.2pp · 2024: 10.8pp
- All cycles
- 2024: D+10.8 2020: D+11.2 2016: D+7.5 2012: D+11.0 2008: D+12.2
Not yet ingested
- Civics
- —
Market trends
- HPI YoY
- ▲ 49.75%
- Current HPI
- 1554.06
- Rent YoY
- ▼ -0.46%
- Metro
- Seattle-Tacoma-Bellevue, WA
- State GDP YoY
- ▲ 4.65%
- F500 in state
- 22
Industry mix (Fortune 500 HQ in WA)
| Industry | F500 HQs | Revenue |
|---|---|---|
| Retail | 2 | $269B |
|
||
| Technology / Retail | 1 | $638B |
|
||
| Technology | 1 | $245B |
|
||
| Telecommunications | 1 | $38B |
|
||
| Food / Beverage | 1 | $36B |
|
||
| Automotive / Trucks | 1 | $34B |
|
||
Price history
+152.7% since first listed5 events — show timeline
- 2026-06-01 Price Changed $479,950 NWMLS as Distributed by MLS Grid
- 2026-05-14 Listed $495,000 NWMLS as Distributed by MLS Grid
- 2010-10-08 Sold (MLS) $195,172 NWMLS as Distributed by MLS Grid
- 2010-09-07 Pending — NWMLS as Distributed by MLS Grid
- 2010-08-04 Listed $189,950 NWMLS as Distributed by MLS Grid
Property tax history
+11.9%/yrLatest (2026): $4,434 · +1.7% YoY. Source: county tax records.
Cash-flow waterfall
monthlySold comps — $/sqft
last 12 mo · ≤1 miLoading sold comps…