5383 SW 40th Ave #103 · Dania Beach, FL
Flood risk No data
- FEMA flood zone
- —
- Chance of flooding over 30 yrs
- —
- Est. flood insurance / yr
- —
Fire risk No data
- Est. fire insurance / yr
- —
Heat risk No data
- Hot days now (above threshold)
- —
- Hot days in 30 yrs
- —
Wind risk No data
- Chance of severe wind over 30 yrs
- —
Air-quality risk No data
- Unhealthy air days now
- —
- Unhealthy air days in 30 yrs
- —
Risk factors via First Street. Map © Google.
Why this score? — see what drove the C- grade
The composite is a weighted blend of 9 inputs, each scored 0–100. Each bar is that input's sub-score; the figure is the points it added to the 100-point composite (weight × sub-score).
- Cash flow +18.0/30.0
- ARV discount +7.5/15.0
- 1% rule +6.6/10.0
- DSCR +5.6/10.0
- Schools +4.1/10.0
- Livability +3.9/5.0
- Rent growth +2.9/5.0
- Condition / age +2.5/5.0
- Appreciation +0.0/10.0
$200,000
🖨 Deal sheet (PDF) 📄 Offer letter ✓ Due diligence
Listing remarks
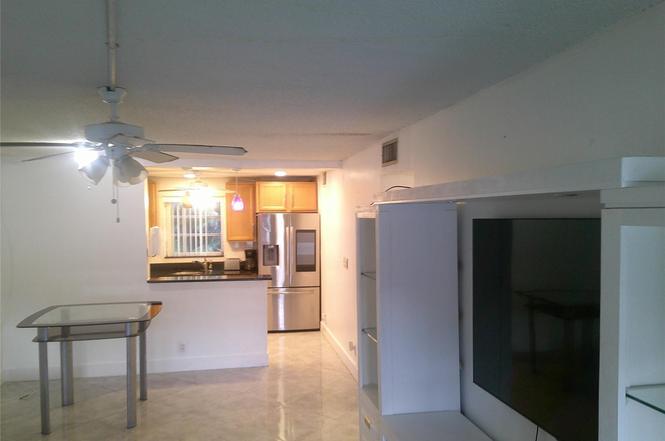
HOME SWEET HOME. THIS LOVELY 2 BEDROOM 2 BATHROOM FIRST FLOOR UNIT IS CLOSE TO HARD ROCK HOTEL, TURNPIKE I-95, FTL AIRPORT. TWO PARKING SPACE IN FRONT OF THE UNIT. LOW MAINTENANCE FEE THAT COVER INSURANCE AND ROOF. BEST PRICE IN THE COMMUNITY.
Key facts
- $350 HOA
- Community pool
- Built 1981
Property features AI
Finance
- HOA & community: Monthly HOA fee of $350; HOA covers insurance, grounds and structure maintenance, sewer, trash, water, common areas, roof repairs, pool service, and parking; Association provides maintenance services
Exterior
- Parking: Association-managed parking
- Security: Owned security system
- Utilities: Sewer service included in association; Water service included in association; Electric service
- Home design: Condominium; Resale property; Two-story building; First-floor entry
- Construction: Block construction
- Exterior features: Screened porch; Porch; Not waterfront
Interior
- Kitchen: Electric range; Dishwasher; Microwave; Refrigerator; Electric water heater
- Bedrooms: One bedroom on the main level
- Flooring: Vinyl flooring; Other flooring
- Bathrooms: Two full bathrooms (one on the main level)
- Heating & cooling: Central heating; Central air; Ceiling fans; Electric cooling
- Interior features: Walk-in closet(s)
Neighborhood map
What this means for you Summary
Snapshot
- This is a 2-bed/2.0-bath condo listed at $200k.
Deal economics
- At list price, monthly cash flow is $171 ($2k/yr) — positive.
- The deal already cash-flows at list — no discount required.
- Meets the 1% rule at list price ($2k rent vs $200k).
- Recommended offer: $182k (9.0% below list) — sets the bar for market timing.
- Cap rate 7.3% vs local median 3.8% in Dania Beach — top-decile yield for the area; either an underpriced asset or a hidden risk that comps aren't pricing in. Stress-test before assuming the spread holds.
Location & tenants
- Location reads 77/100 on livability (#180 in FL, #2,806 nationally) — a middle-class / working-renter tenant base. Strengths: commute A+, cost of living A, housing A; Watch: schools D, employment D, amenities F.
- Broward (suburban): math 42% / reading 53% proficiency, ranked #46 of 73 in FL (top 63%) — families likely to look elsewhere, expect single-tenant / working-renter base with shorter leases.
- Market conditions: Rents rising (+1.4%/yr); 186 active listings in the ZIP; 40 comparable units currently listed for rent nearby; rentals at typical pace (median 15d on market — plan ~3-4 weeks tenant-placement turnaround); 2,111 units permitted in Broward County in 2024 (1,265 in 5+ unit buildings).
- This rent runs 42% of the median local income ($66k/yr) — at the standard rent-burdened threshold; future hikes will face affordability resistance.
Forward outlook
- Local home prices are declining (-3.0%/yr); year-one equity from $1k of loan paydown is wiped out by about $6k of value loss. Plan a longer hold.
- Broward County population projected at +34% by 2050 — long-run rental-demand tailwind backs the buy-and-hold thesis.
Negotiation context
- It's been on market 102 days — a 9% lower offer ($182k) is reasonable based on typical stale-listing flexibility.
- 2 sale attempts since 2y ago with the ask held roughly flat each time — persistent listings suggest the price (not the market) is what's stuck; bring a comps-based counter.
- Current owner paid $125k; list at $200k implies a 60% gain — meaningful room to come down on a strong offer.
Questions for the listing agent
- It's been on market 102 days. Have you received any prior offers? Is the seller open to a 9% concession, seller financing, or rate buy-down credit?
- What does the HOA fee cover, when was the last increase, and are there any pending special assessments or reserve-fund shortfalls?
- Any open or pending special assessments — roof, HVAC, plumbing, elevator, façade? What's the per-unit balance and payoff schedule, and is the seller paying it off at close or rolling it to the buyer?
- Why hasn't it sold? Are there any deal-killer items the seller is aware of (foundation, flood, title, zoning, code violations)?
- Is there a deadline driving the sale (1031 exchange, divorce, estate, relocation)? That informs how much negotiation room exists.
- Schools are D-rated, which usually means shorter tenancies and higher turnover. Who's the typical renter profile here, and what's been the actual vacancy rate?
- What's the average days-on-market for RENTAL listings here right now (not sales)? A rising rental-DOM trend means longer vacancies and softer asking-rent achievability than the comps imply.
- What's the recent tenant-quality profile in this submarket — average credit score on applications, eviction rate, late-payment / NSF rate, and stable-employment percentage? A property-management company in the area should have these aggregated.
- How much new apartment / multifamily construction is in the pipeline within 1–3 miles? Heavy new supply (>2% of stock underway) typically softens rents 12–24 months out; light construction supports rent growth.
Investment metrics
- 1% rule
- 1.16% ✓
- Cap rate
- 7.32%
- Cash-on-cash
- 3.66%
- DSCR
- 1.16
- GRM
- 7.2
CMA / ARV
No comps found within radius.
Projected returns pro-forma
-3.0% appreciation · 1.45% rent growth · sell at horizon
- IRR
- -12.5%
- Equity multiple
- 0.56×
- Total profit
- $-24,883
- Equity at exit
- $29,821
- IRR
- -6.3%
- Equity multiple
- 0.63×
- Total profit
- $-20,963
- Equity at exit
- $17,292
Cash invested: $56,000 (down + closing). Projections, not guarantees.
Landlord ↔ Tenant lean methodology
- Overall (STATE)
- 87 Strongly Landlord-Friendly
- State Florida
- 87 Strongly Landlord-Friendly · R+3
- County
- — inherits STATE
- City
- — inherits STATE
ZIP-level market 33314
- Rents YoY
- 1.4%
- Active inventory
- 186
- Price-to-rent
- 7.2×
Monthly cashflow live
- Estimated rent
- $2,311 high interval (Pro) →
- Mortgage (P&I)
- −$1,049
- Tax from tax record
- −$173 /mo · $2,074/yr
- Insurance
- −$83
- HOA
- −$350
- Vacancy / Maint / Mgmt
- −$485
- Net cashflow
- $171
Break-even live
Sensitivity live
| Price | -10% $284 | -5% $227 | +0% $171 | +5% $114 | +10% $57 |
|---|---|---|---|---|---|
| Rent | -10% $-12 | -5% $79 | +0% $171 | +5% $262 | +10% $353 |
| Rate | -1.0pp $271 | -0.5pp $222 | base $171 | +0.5pp $119 | +1.0pp $66 |
UW: 25.0% down · 7.5% · 30yr · 1.5% tax · 5.0% vac · 8.0% maint · 8.0% mgmt
Financing live
Cash to close
- Down payment
- $50,000
- Closing costs
- $6,000
- Reserves months
- —
- Total cash needed
- —
Loan-product check · same deal, 3 products live
Conventional
25% down · 7.5% · 30yr
- Down + closing
- —
- Monthly P&I
- —
- Monthly cashflow
- —
- DSCR
- —
- Eligible?
- —
Personal DTI + credit; lowest rate.
DSCR
20% down · 8.5% · 30yr
- Down + closing
- —
- Monthly P&I
- —
- Monthly cashflow
- —
- DSCR
- —
- Eligible?
- —
No personal income docs; deal must DSCR.
Hard money
10% down · 12.0% · 12mo
- Down + closing
- —
- Monthly P&I
- —
- Monthly cashflow
- —
- DSCR
- —
- Eligible?
- —
Short-term bridge; refi at stabilization.
Rent comps 40 comps
| Address | Beds | Baths | Sqft | Rent | $/sqft | DOM | Units | Dist |
|---|---|---|---|---|---|---|---|---|
| 5269 SW 40th Ter #21 Fort Lauderdale, FL | 2.0 | 2.0 | 1060 | $2,400 | $2.26 | 25d | 1 | 0.15mi |
| 5259 SW 40th Ave #26 Fort Lauderdale, FL | 2.0 | 2.0 | 1060 | $2,750 | $2.59 | 9d | 1 | 0.16mi |
| 5259 SW 40th Ave #26 Fort Lauderdale, FL | 2.0 | 2.0 | 1060 | $2,900 | $2.74 | 14d | 1 | 0.16mi |
| 4471 SW 54th Ct Unit 1A-2B Fort Lauderdale, FL | 1.0 | 1.0 | 600 | $1,350 | $2.25 | 25d | 1 | 0.17mi |
| 4528 SW 54th St Unit 302 B Fort Lauderdale, FL | 2.0 | 2.0 | 950 | $2,200 | $2.32 | 25d | 1 | 0.22mi |
| 4137 Stirling Rd Davie, FL | 2.0 | 1.5–2.0 | 966 | $2,150 | $2.23 | 9d | 2 | 0.27mi |
| 4137 Stirling Rd Davie, FL | 2.0 | 1.5–2.0 | 1002 | $2,150 | $2.15 | 18d | 5 | 0.27mi |
| 4137 Stirling Rd Davie, FL | 2.0 | 1.5–2.0 | 1002 | $2,150 | $2.15 | 16d | 5 | 0.27mi |
| 4174 SW 51st St Unit 2 Fort Lauderdale, FL | 3.0 | 2.0 | 1100 | $2,650 | $2.41 | 15d | 1 | 0.30mi |
| 4174 SW 51st St Unit 2 Fort Lauderdale, FL | 3.0 | 3.0 | 1104 | $2,650 | $2.40 | 9d | 1 | 0.30mi |
| 5140 SW 40th Ave Unit 26C Fort Lauderdale, FL | 2.0 | 2.0 | 1060 | $2,100 | $1.98 | 9d | 1 | 0.34mi |
| 5050 SW 40th Ave Unit 4 Fort Lauderdale, FL | 2.0 | 1.0 | 750 | $1,800 | $2.40 | 20d | 1 | 0.38mi |
| 4121 Stirling Rd #401 Davie, FL | 2.0 | 2.0 | 1015 | $2,200 | $2.17 | 18d | 1 | 0.39mi |
| 4242 SW 49th Ct Unit 4242 Fort Lauderdale, FL | 3.0 | 2.0 | 1050 | $2,500 | $2.38 | 25d | 1 | 0.42mi |
| 4147 Stirling Rd Fort Lauderdale, FL | 1.0–2.0 | 1.5–2.0 | 916 | $2,300 | $2.51 | 6d | 9 | 0.44mi |
| 4111 Stirling Rd Davie, FL | 2.0 | 1.5–2.0 | 980 | $2,250 | $2.30 | 22d | 3 | 0.44mi |
| 4111 Stirling Rd Davie, FL | 1.0–2.0 | 1.0–1.5 | 945 | $2,000 | $2.12 | 0d | 3 | 0.44mi |
| 4917 SW 43rd Ter Unit B Fort Lauderdale, FL | 1.0 | 1.0 | 975 | $1,150 | $1.18 | 25d | 1 | 0.49mi |
| 4917 SW 43rd Ter Unit A Fort Lauderdale, FL | 3.0 | 2.0 | 975 | $2,850 | $2.92 | 22d | 1 | 0.49mi |
| 4285 SW 48th Ct Unit 4285 Fort Lauderdale, FL | 3.0 | 2.0 | 1055 | $2,950 | $2.80 | 25d | 1 | 0.58mi |
| 4000 N 56th Ave Hollywood, FL | 2.0 | 1.0–2.0 | 779 | $2,195 | $2.82 | 0d | 7 | 0.63mi |
| 4465 Griffin Rd Fort Lauderdale, FL | 2.0–3.0 | 2.0 | 1102 | $2,799 | $2.54 | 0d | 24 | 0.68mi |
| 3700 N 56th Ave #1015 Hollywood, FL | 1.0 | 1.0 | 659 | $1,900 | $2.88 | 9d | 1 | 0.70mi |
| 3700 N 56th Ave Hollywood, FL | 1.0–2.0 | 1.0 | 704 | $2,100 | $2.98 | 25d | 3 | 0.70mi |
| 4781 SW 39th Way Fort Lauderdale, FL | 2.0–3.0 | 2.5–3.0 | 1356 | $2,687 | $1.98 | 0d | 11 | 0.71mi |
| 3690 N 56th Ave Hollywood, FL | 1.0–2.0 | 1.0 | 771 | $2,200 | $2.85 | 4d | 2 | 0.74mi |
| 3690 N 56th Ave #912 Hollywood, FL | 2.0 | 1.0 | 884 | $2,200 | $2.49 | 25d | 1 | 0.74mi |
| 3690 N 56th Ave #912 Hollywood, FL | 2.0 | 1.0 | 884 | $2,200 | $2.49 | 9d | 1 | 0.74mi |
| 3610 N 56th Ave Hollywood, FL | 1.0–2.0 | 1.0 | 771 | $2,100 | $2.72 | 9d | 2 | 0.75mi |
| 3610 N 56th Ave Hollywood, FL | 2.0 | 1.0 | 884 | $2,050 | $2.32 | 23d | 2 | 0.75mi |
| 3610 N 56th Ave #205 Hollywood, FL | 2.0 | 1.0 | 884 | $2,100 | $2.38 | 12d | 1 | 0.78mi |
| 3680 N 56th Ave Hollywood, FL | 2.0 | 1.0 | 816 | $1,925 | $2.36 | 13d | 2 | 0.80mi |
| 4681 SW 43rd Ter Unit 2 Fort Lauderdale, FL | 3.0 | 1.0 | 1100 | $2,600 | $2.36 | 4d | 1 | 0.80mi |
| 3680 N 56th Ave #823 Hollywood, FL | 2.0 | 1.0 | 749 | $2,500 | $3.34 | 6d | 1 | 0.80mi |
| 4671 SW 43rd Ter Unit 2 Fort Lauderdale, FL | 2.0 | 1.0 | 960 | $3,200 | $3.33 | 25d | 1 | 0.81mi |
| 3640 N 56th Ave #401 Hollywood, FL | 2.0 | 1.0 | 749 | $1,900 | $2.54 | 22d | 1 | 0.86mi |
| 3640 N 56th Ave #401 Hollywood, FL | 2.0 | 1.0 | 749 | $1,900 | $2.54 | 3d | 1 | 0.86mi |
| 3640 N 56th Ave #412 Hollywood, FL | 2.0 | 1.0 | 884 | $2,200 | $2.49 | 25d | 1 | 0.86mi |
| 3660 N 56th Ave #609 Hollywood, FL | 1.0 | 1.0 | 659 | $1,725 | $2.62 | 0d | 1 | 0.87mi |
| 3660 N 56th Ave #609 Hollywood, FL | 1.0 | 1.0 | 659 | $1,725 | $2.62 | 19d | 1 | 0.87mi |
HOA detail condo
- Monthly dues
- $350 · $4,200/yr
- Assessments
- None detected in remarks — confirm with the listing agent.
Listing history 23 events
-
2026-06-21days on market $200,000 Active 102 DOM
-
2026-06-18days on market $200,000 Active 99 DOM
-
2026-06-17days on market $200,000 Active 98 DOM
-
2026-06-16days on market $200,000 Active 97 DOM
-
2026-06-15days on market $200,000 Active 96 DOM
-
2026-06-13days on market $200,000 Active 94 DOM
-
2026-06-09days on market $200,000 Active 90 DOM
-
2026-06-07days on market $200,000 Active 88 DOM
-
2026-06-04days on market $200,000 Active 85 DOM
-
2026-06-03days on market $200,000 Active 84 DOM
-
2026-06-02days on market $200,000 Active 83 DOM
-
2026-06-01days on market $200,000 Active 82 DOM
-
2026-05-31days on market $200,000 Active 81 DOM
-
2026-01-29$200,000 Active
-
2025-01-23historical
-
2024-11-26price $225,000
-
2024-01-25$230,000 Active
-
2021-03-04soldstatus $125,000
-
2006-12-18soldstatus $135,000
-
2003-07-10soldstatus $72,000
-
1995-06-21soldstatus $39,500
-
1981-11-01soldstatus $47,000
-
1981-11-01soldstatus $47,000
ⓘ Source: listings_history table (triggers on properties + properties_extension) + one-shot
backfill from property_details.listing_events for pre-trigger history.
Tax reassessment forecast FL · Resets to sale price
- Current annual tax
- $2,074 · $173/mo
- Projected year-2 tax
- $2,074 · $173/mo
- Expected delta
- $0/yr ($0/mo · 0.0%)
ⓘ Screening estimate from a state-policy table — verify with the county assessor before closing.
Nearby sold comps map
Loading sold comps map…
Walkable amenities ~0.75 mi
Loading nearby amenities…
Taxation est. · year 1
- Rental income
- $27,732
- − Mortgage interest
- −$11,203
- − Property taxes
- −$2,074
- − Insurance
- −$1,000
- − Repairs & maintenance
- −$2,219
- − Management
- −$2,219
- − HOA
- −$4,200
- − Depreciation
- −$5,818
- Taxable loss
- −$1,000
- Est. tax savings @ 24.0%
- +$240
- After-tax cash flow
- $2,289/yr
For passive investors: Depreciation is non-cash, so a rental often shows a tax loss while cash-flowing — sheltering income. Rental losses are passive: they offset passive income freely, and up to $25,000/yr can offset ordinary (W-2) income if you actively participate and your MAGI is under $100k (phasing out to $0 by $150k); unused losses carry forward. On sale, claimed depreciation is recaptured at up to 25%, and gains may owe capital-gains tax (a 1031 exchange can defer both). Figures are a year-1 estimate at your 24.0% rate — not tax advice; consult a CPA.
Schools (NCES district)
- District
- Broward
- NCES district ID
- 1200180
- Math proficiency
- 42% ▼ -18.00%
- Reading proficiency
- 53% ▼ -5.00%
- Median HH income
- $52,139
- Composite
- 40.88/100
- National rank
- #3621
- State rank
- #46 of 73 in FL
Livability — Dania Beach
- Score
- 77/100
- State rank
- #180
- US rank
- #2806
Category grades
Schools grade is shown separately in the Schools card above.
Census & demographics
- Census place
- Dania Beach, FL
- County
- Broward County · 1,963,430 people
- City population
- 17,094
- Metro
- Miami-Fort Lauderdale-Pompano Beach, FL
- Population (ZIP)
- 31,067
- Household income
- $66,100
- Rent vs Own
- Severe rent burden
- 2205.0
Population outlook (Broward County) Hauer SSP2
- Today (2025)
- 2,207,033 people
- By 2030
- 2,360,704 · +7.0%
- By 2040
- 2,661,208 · +20.6%
- By 2050
- 2,946,698 · +33.5%
- By 2075
- 3,602,273 · +63.2%
- By 2100
- 3,970,984 · +79.9%
Race, ethnicity, and origin ACS 2023
- Neighborhood character
- Diverse neighborhood (Simpson 0.66)
- Race & ethnicity
- Hispanic / Latino 49% Two or more races 30% White 29% Black 13% Asian 6%
- Hispanic origin (detail)
- Mexican 6% Puerto Rican 7% Cuban 7% Dominican 3%
- Common ancestry
- Hispanic 4% Romanian 1% Estonian 1%
- Foreign-born
- 38% · Canada, Jamaica, Vietnam
- Languages at home
- 45% English-only · Spanish 42% French/Haitian/Cajun 4% Other Indo-European 3%
Political lean MEDSL · Broward
- 2024 margin
- D (+17.0) · D 58.0% · R 41.0%
- 2008→2024 swing
- -17.8pp toward R · 2008: 34.7pp · 2024: 17.0pp
- All cycles
- 2024: D+17.0 2020: D+29.8 2016: D+35.0 2012: D+34.9 2008: D+34.7
Not yet ingested
- Civics
- —
Market trends
- HPI YoY
- ▼ -346.31%
- Current HPI
- 433.1148
- Rent YoY
- ▲ 1.45%
- Metro
- Miami-Fort Lauderdale-Pompano Beach, FL
- State GDP YoY
- ▲ 3.28%
- F500 in state
- 36
Industry mix (Fortune 500 HQ in FL)
| Industry | F500 HQs | Revenue |
|---|---|---|
| Industrial Technology | 2 | $29B |
|
||
| Insurance | 2 | $17B |
|
||
| Retail | 1 | $60B |
|
||
| Technology Distribution | 1 | $58B |
|
||
| Homebuilding | 1 | $35B |
|
||
| Technology Manufacturing | 1 | $35B |
|
||
Price history
+325.5% since first listed10 events — show timeline
- 2026-01-29 Listed $200,000 Beaches MLS
- 2025-01-23 Listing Removed — MARMLS
- 2024-11-26 Price Changed $225,000 MARMLS
- 2024-01-25 Listed $230,000 MARMLS
- 2021-03-04 Sold (Public Records) $125,000 Public Records
- 2006-12-18 Sold (Public Records) $135,000 Public Records
- 2003-07-10 Sold (Public Records) $72,000 Public Records
- 1995-06-21 Sold (Public Records) $39,500 Public Records
- 1981-11-01 Sold (Public Records) $47,000 Public Records
- 1981-11-01 Sold (Public Records) $47,000 Public Records
Property tax history
+13.3%/yrLatest (2025): $2,074 · +4.6% YoY. Source: county tax records.
Cash-flow waterfall
monthlySold comps — $/sqft
last 12 mo · ≤1 miLoading sold comps…