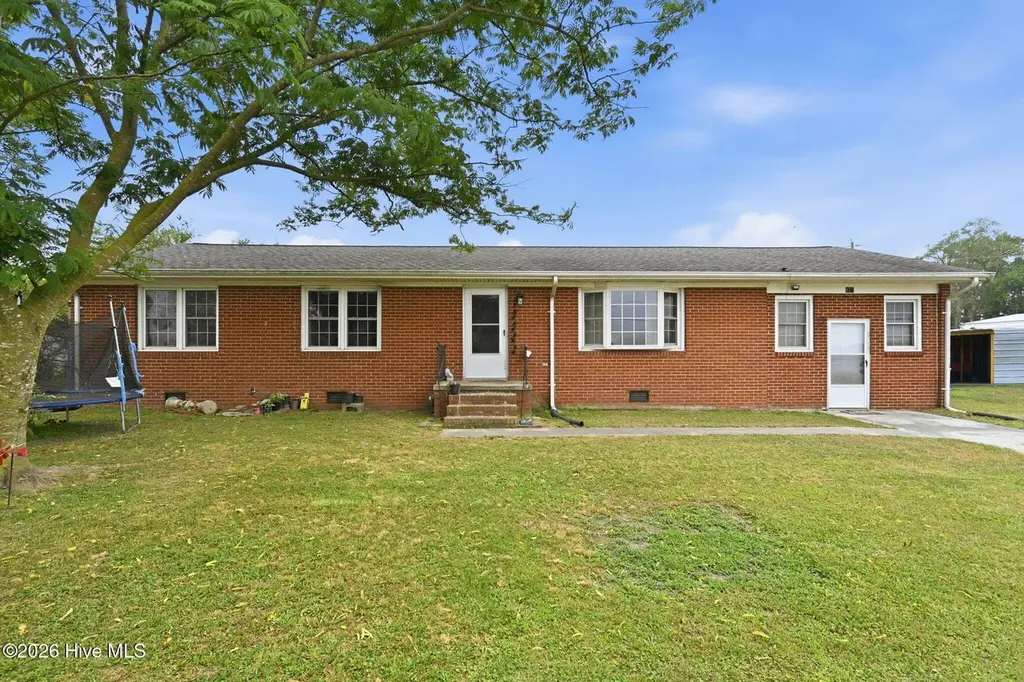
873 Huffmantown Rd · Richlands, NC
Flood risk 1/10 · Minimal
- FEMA flood zone
- X (unshaded)
- Chance of flooding over 30 yrs
- 0.0%
- Est. flood insurance / yr
- $507 – $1,088
Fire risk 4/10 · Minor
- Est. fire insurance / yr
- $906 – $1,684
Heat risk 8/10 · Major
- Hot days now (above 106°F)
- 7 days/yr
- Hot days in 30 yrs
- 18 days/yr
Wind risk 8/10 · Major
- Chance of severe wind over 30 yrs
- 80.0%
Air-quality risk 2/10 · Minimal
- Unhealthy air days now
- 0 days/yr
- Unhealthy air days in 30 yrs
- 1 days/yr
Risk factors via First Street. Map © Google.
Why this score? — see what drove the D+ grade
The composite is a weighted blend of 9 inputs, each scored 0–100. Each bar is that input's sub-score; the figure is the points it added to the 100-point composite (weight × sub-score).
- Cash flow +18.8/30.0
- ARV discount +7.5/15.0
- DSCR +5.9/10.0
- Schools +3.9/10.0
- 1% rule +3.8/10.0
- Livability +3.5/5.0
- Rent growth +2.5/5.0
- Condition / age +2.5/5.0
- Appreciation +0.0/10.0
$210,000
🖨 Deal sheet (PDF) 📄 Offer letter ✓ Due diligence
Listing remarks
Welcome home to the perfect blend of classic durability and serene country living. This charming 3-bedroom, 2-bathroom brick home offers a peaceful escape from the hustle and bustle, while providing all the comfort and character you've been searching for. Imagine sipping your morning coffee on the front stoop, feeling the gentle country breeze and gathering your thoughts. This isn't just a house, it's a lifestyle.
Key facts
- 0.48 acre lot
- Built 1961
- Listed 23 days
Property features AI
Exterior
- Parking: Concrete parking
- Utilities: Water connected
- Home design: Single-family residence; One-story (entry level on 1)
- Construction: Brick veneer and frame construction; Brick/mortar permanent foundation
- Exterior features: Shingle roof; Shed on the property; Paved road access; Has a view; No patio or porch; No fencing
Interior
- Bedrooms: Total rooms: 5
- Bathrooms: 2 full bathrooms
- Heating & cooling: Central air conditioning; Electric heating with heat pump
- Interior features: Master suite on the main level; Ceiling fans; Electric water heater
Neighborhood map
What this means for you Summary
Snapshot
- This is a 4-bed/1.0-bath single-family listed at $210k.
Deal economics
- At list price, monthly cash flow is $213 ($3k/yr) — positive.
- The deal already cash-flows at list — no discount required.
- To meet the 1% rule (rent ≥ 1% of price), the offer needs to be $184k (12.3% below list).
- Recommended offer: $184k (12.3% below list) — sets the bar for 1% rule.
- Cap rate 7.5% vs local median 4.0% in Richlands — top-decile yield for the area; either an underpriced asset or a hidden risk that comps aren't pricing in. Stress-test before assuming the spread holds.
Location & tenants
- Location reads 69/100 on livability (#151 in NC) — a middle-class / working-renter tenant base. Strengths: crime A+, cost of living A+, housing A+; Watch: employment D, amenities F, commute F.
- Onslow County Schools (other): math 42% / reading 49% proficiency, ranked #84 of 178 in NC (top 47%) — families likely to look elsewhere, expect single-tenant / working-renter base with shorter leases.
- Zoned schools: Richlands Elementary (math 44% / reading 40%, grade F, #633 of 1,410 statewide, top 48%, 642 students, 52% FRL); Trexler Middle (math 37% / reading 46%, grade F, #206 of 475 statewide, top 44%, 825 students, 45% FRL); Richlands High (math 52% / reading 67%, grade C+, #216 of 535 statewide, top 43%, 960 students, 40% FRL).
- Market conditions: 204 active listings in the ZIP; 1,246 units permitted in Onslow County in 2024 (0 in 5+ unit buildings).
- This rent runs 33% of the median local income ($67k/yr) — at the standard rent-burdened threshold; future hikes will face affordability resistance.
Forward outlook
- Local home prices are declining (-3.0%/yr); year-one equity from $1k of loan paydown is wiped out by about $6k of value loss. Plan a longer hold.
Negotiation context
- It's been on market 23 days — a 2% lower offer ($207k) is reasonable based on typical stale-listing flexibility.
- 3 sale attempts since 3y ago with the ask held roughly flat each time — persistent listings suggest the price (not the market) is what's stuck; bring a comps-based counter.
- Current owner paid $127k; list at $210k implies a 65% gain — meaningful room to come down on a strong offer.
Risks & watch-outs
- Climate carrying-cost: severe wind risk, 80% chance of damaging wind over 30y; extreme-heat days projected 7→18/yr by 2055 (HVAC capex compounding) — expect insurance premiums to compound above CPI over the hold.
Questions for the listing agent
- Built in 1961 — when were the roof, HVAC, electrical panel, plumbing, and water heater last replaced?
- Is there a deadline driving the sale (1031 exchange, divorce, estate, relocation)? That informs how much negotiation room exists.
- The area grade is low — what's the realistic commute time and amenity access for the typical tenant pool here? Any planned neighborhood developments (good or bad) we should know about?
- What's the average days-on-market for RENTAL listings here right now (not sales)? A rising rental-DOM trend means longer vacancies and softer asking-rent achievability than the comps imply.
- What's the recent tenant-quality profile in this submarket — average credit score on applications, eviction rate, late-payment / NSF rate, and stable-employment percentage? A property-management company in the area should have these aggregated.
- How much new for-sale + rental construction is in the pipeline within 1–3 miles? Heavy new supply typically softens prices + rents 12–24 months out; constrained supply supports both.
Investment metrics
- 1% rule
- 0.88% ✗
- Cap rate
- 7.51%
- Cash-on-cash
- 4.34%
- DSCR
- 1.19
- GRM
- 9.5
CMA / ARV
No comps found within radius.
Projected returns pro-forma
-3.0% appreciation · 3.0% rent growth · sell at horizon
- IRR
- -9.6%
- Equity multiple
- 0.65×
- Total profit
- $-20,579
- Equity at exit
- $31,312
- IRR
- -0.2%
- Equity multiple
- 0.99×
- Total profit
- $-881
- Equity at exit
- $18,157
Cash invested: $58,800 (down + closing). Projections, not guarantees.
Landlord ↔ Tenant lean methodology
- Overall (STATE)
- 85 Strongly Landlord-Friendly
- State North Carolina
- 85 Strongly Landlord-Friendly · R+3
- County
- — inherits STATE
- City
- — inherits STATE
ZIP-level market 28574
- Home prices YoY
- -8.9%
- Active inventory
- 204
- Price-to-rent
- 9.5×
Monthly cashflow live
- Estimated rent
- $1,841 medium interval (Pro) →
- Mortgage (P&I)
- −$1,101
- Tax from tax record
- −$53 /mo · $632/yr
- Insurance
- −$88
- HOA
- −$0
- Vacancy / Maint / Mgmt
- −$387
- Net cashflow
- $213
Break-even live
Sensitivity live
| Price | -10% $332 | -5% $272 | +0% $213 | +5% $153 | +10% $94 |
|---|---|---|---|---|---|
| Rent | -10% $67 | -5% $140 | +0% $213 | +5% $285 | +10% $358 |
| Rate | -1.0pp $319 | -0.5pp $266 | base $213 | +0.5pp $158 | +1.0pp $103 |
UW: 25.0% down · 7.5% · 30yr · 1.5% tax · 5.0% vac · 8.0% maint · 8.0% mgmt
Financing live
Cash to close
- Down payment
- $52,500
- Closing costs
- $6,300
- Reserves months
- —
- Total cash needed
- —
Loan-product check · same deal, 3 products live
Conventional
25% down · 7.5% · 30yr
- Down + closing
- —
- Monthly P&I
- —
- Monthly cashflow
- —
- DSCR
- —
- Eligible?
- —
Personal DTI + credit; lowest rate.
DSCR
20% down · 8.5% · 30yr
- Down + closing
- —
- Monthly P&I
- —
- Monthly cashflow
- —
- DSCR
- —
- Eligible?
- —
No personal income docs; deal must DSCR.
Hard money
10% down · 12.0% · 12mo
- Down + closing
- —
- Monthly P&I
- —
- Monthly cashflow
- —
- DSCR
- —
- Eligible?
- —
Short-term bridge; refi at stabilization.
Listing history 18 events
-
2026-06-21days on market $210,000 Active 23 DOM
-
2026-06-19days on market $210,000 Active 21 DOM
-
2026-06-18days on market $210,000 Active 20 DOM
-
2026-06-17days on market $210,000 Active 19 DOM
-
2026-06-16days on market $210,000 Active 18 DOM
-
2026-06-15days on market $210,000 Active 17 DOM
-
2026-06-14days on market $210,000 Active 15 DOM
-
2026-06-13days on market $210,000 Active 14 DOM
-
2026-06-10days on market $210,000 Active 12 DOM
-
2026-06-09days on market $210,000 Active 11 DOM
-
2026-06-09days on market $210,000 Active 10 DOM
-
2026-06-07days on market $210,000 Active 9 DOM
-
2026-06-03days on market $210,000 Active 5 DOM
-
2026-06-02days on market $210,000 Active 4 DOM
-
2026-06-01days on market $210,000 Active 3 DOM
-
2026-05-31days on market $210,000 Active 2 DOM
-
2026-05-30remarks 417-char remark
-
2026-05-30$210,000 Active 1 DOM
ⓘ Source: listings_history table (triggers on properties + properties_extension) + one-shot
backfill from property_details.listing_events for pre-trigger history.
Tax reassessment forecast NC · Resets to sale price
- Current annual tax
- $632 · $53/mo
- Projected year-2 tax
- $1,722 · $144/mo
- Expected delta
- +$1,090/yr (+$91/mo · 172.4%)
ⓘ Screening estimate from a state-policy table — verify with the county assessor before closing.
Climate risk First Street
- Flood 1/10 Low FEMA zone X (unshaded) · 0% chance over 30 yrs
- Wildfire 4/10 Moderate
- Heat 8/10 Severe 7 d/yr ≥106°F today · 18 d/yr by 30 yrs out
- Wind 8/10 Severe 80% chance of damaging wind over 30 yrs
- Air quality 2/10 Low 0 unhealthy d/yr today · 1 by 30 yrs out
Nearby sold comps map
Loading sold comps map…
Walkable amenities ~0.75 mi
Loading nearby amenities…
Taxation est. · year 1
- Rental income
- $22,089
- − Mortgage interest
- −$11,763
- − Property taxes
- −$632
- − Insurance
- −$1,050
- − Repairs & maintenance
- −$1,767
- − Management
- −$1,767
- − Depreciation
- −$6,109
- Taxable loss
- −$999
- Est. tax savings @ 24.0%
- +$240
- After-tax cash flow
- $2,793/yr
For passive investors: Depreciation is non-cash, so a rental often shows a tax loss while cash-flowing — sheltering income. Rental losses are passive: they offset passive income freely, and up to $25,000/yr can offset ordinary (W-2) income if you actively participate and your MAGI is under $100k (phasing out to $0 by $150k); unused losses carry forward. On sale, claimed depreciation is recaptured at up to 25%, and gains may owe capital-gains tax (a 1031 exchange can defer both). Figures are a year-1 estimate at your 24.0% rate — not tax advice; consult a CPA.
Schools (NCES district)
- District
- Onslow County Schools
- NCES district ID
- 3703450
- Math proficiency
- 42% ▲ 6.00%
- Reading proficiency
- 49% ▲ 5.00%
- Median HH income
- $46,076
- Composite
- 38.66/100
- National rank
- #4148
- State rank
- #84 of 178 in NC
Livability — Richlands
- Score
- 69/100
- State rank
- #151
- US rank
- #8426
Category grades
Schools grade is shown separately in the Schools card above.
Census & demographics
- County
- Onslow County · 164,453 people
- City population
- 20,990
- Metro
- Jacksonville, NC
- Population (ZIP)
- 20,990
- Household income
- $67,416
- Rent vs Own
- Severe rent burden
- 287.0
Population outlook (Onslow County) Hauer SSP2
- Today (2025)
- 189,789 people
- By 2030
- 194,463 · +2.5%
- By 2040
- 193,629 · +2.0%
- By 2050
- 193,248 · +1.8%
- By 2075
- 196,995 · +3.8%
- By 2100
- 201,513 · +6.2%
Race, ethnicity, and origin ACS 2023
- Neighborhood character
- Predominantly White (74%)
- Race & ethnicity
- White 74% Two or more races 13% Hispanic / Latino 8% Black 7%
- Hispanic origin (detail)
- Mexican 4% Puerto Rican 2%
- Common ancestry
- Slovak 3% Romanian 2% Lithuanian 1%
- Foreign-born
- 2% · Canada
- Languages at home
- 92% English-only · Spanish 6%
Political lean MEDSL · Onslow
- 2024 margin
- Solid R (+35.9) · D 31.5% · R 67.5% · Other 1.0%
- 2008→2024 swing
- -14.5pp toward R · 2008: -21.5pp · 2024: -35.9pp
- All cycles
- 2024: R+35.9 2020: R+30.2 2016: R+34.6 2012: R+27.0 2008: R+21.5
Not yet ingested
- Civics
- —
Market trends
- HPI YoY
- ▼ -21.07%
- Current HPI
- 215.4574
- Rent YoY
- —
- Metro
- Jacksonville, NC
- State GDP YoY
- ▲ 3.28%
- F500 in state
- 26
Industry mix (Fortune 500 HQ in NC)
| Industry | F500 HQs | Revenue |
|---|---|---|
| Financial Services | 2 | $213B |
|
||
| Retail | 2 | $95B |
|
||
| Industrial Conglomerate | 1 | $38B |
|
||
| Metals / Steel | 1 | $35B |
|
||
| Utilities | 1 | $30B |
|
||
| Industrial Machinery | 1 | $19B |
|
||
Price history
+65.4% since first listed8 events — show timeline
- 2026-05-29 Listed $210,000 Hive MLS
- 2024-04-15 Listing Removed — Hive MLS
- 2023-10-05 Price Changed $210,000 Hive MLS
- 2023-09-30 Relisted — Hive MLS
- 2023-09-20 Listing Removed — Hive MLS
- 2023-08-29 Price Changed $220,000 Hive MLS
- 2023-08-02 Listed $230,000 Hive MLS
- 2006-08-23 Sold (Public Records) $127,000 Public Records
Property tax history
+2.3%/yrLatest (2025): $632 · +0.0% YoY. Source: county tax records.
Cash-flow waterfall
monthlySold comps — $/sqft
last 12 mo · ≤1 miLoading sold comps…