8444 W Jennifer Ct · Crystal River, FL
Flood risk 7/10 · Major
- FEMA flood zone
- X (unshaded)
- Chance of flooding over 30 yrs
- 0.68%
- Est. flood insurance / yr
- $507 – $1,088
Fire risk 7/10 · Major
- Est. fire insurance / yr
- $947 – $1,759
Heat risk 9/10 · Severe
- Hot days now (above 109°F)
- 7 days/yr
- Hot days in 30 yrs
- 24 days/yr
Wind risk 9/10 · Severe
- Chance of severe wind over 30 yrs
- 99.0%
Air-quality risk 1/10 · Minimal
- Unhealthy air days now
- 0 days/yr
- Unhealthy air days in 30 yrs
- 0 days/yr
Risk factors via First Street. Map © Google.
Why this score? — see what drove the D+ grade
The composite is a weighted blend of 9 inputs, each scored 0–100. Each bar is that input's sub-score; the figure is the points it added to the 100-point composite (weight × sub-score).
- Cash flow +20.2/30.0
- DSCR +6.4/10.0
- 1% rule +4.4/10.0
- Schools +4.1/10.0
- Livability +3.3/5.0
- Rent growth +2.5/5.0
- Condition / age +2.5/5.0
- ARV discount +2.4/15.0
- Appreciation +0.0/10.0
$218,000
🖨 Deal sheet (PDF) 📄 Offer letter ✓ Due diligence
Listing remarks
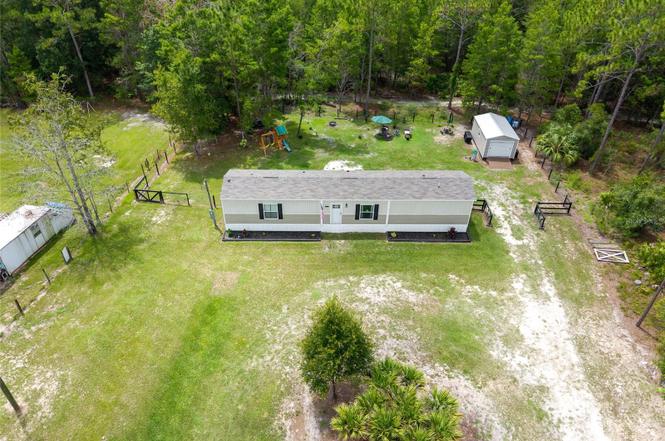
Welcome to your peaceful retreat in Crystal River! Situated on 1.03 acres of open space, this charming 2-bedroom, 2-bath manufactured home offers comfort, functionality, and privacy. Step inside to an inviting open floor plan filled with natural light, perfect for everyday living and entertaining. The kitchen features ample cabinetry, modern finishes, and flows seamlessly into the living dining area. A bonus room offers flexible use as extra storage, a pantry, or a small office. The water filtration system ensures fresh, clean water throughout the home. Both bedrooms are generously sized, with the primary suite offering its own private bath complete with his and hers sinks. Enjoy the outdoo
Key facts
- Flexible use room
- Ample cabinetry
- Storage shed
Tags
Property features AI
Exterior
- Utilities: Well water; Septic tank; Electricity connected; Cable available; Water connected
- Home design: Manufactured single-wide home; One story; West-facing
- Construction: Vinyl siding; Shingle roof; Block foundation; Built on a single level
- Exterior features: Storage; Dirt road access
Interior
- Kitchen: Dishwasher; Range; Range hood; Refrigerator; Water filtration system
- Bedrooms: 2 bedrooms
- Bathrooms: 2 full bathrooms
- Heating & cooling: Central heating; Central air conditioning
- Interior features: Kitchen/family room combo; Storage
- Laundry & utility: Dedicated laundry room; Washer; Dryer
Neighborhood map
What this means for you Summary
Snapshot
- This is a 3-bed/2.0-bath manufactured listed at $218k.
Deal economics
- At list price, monthly cash flow is $211 ($3k/yr) — positive.
- The deal already cash-flows at list — no discount required.
- To meet the 1% rule (rent ≥ 1% of price), the offer needs to be $204k (6.4% below list).
- Recommended offer: $192k (12.0% below list) — sets the bar for market timing.
- Cap rate 7.8% vs local median 2.1% in Crystal River — top-decile yield for the area; either an underpriced asset or a hidden risk that comps aren't pricing in. Stress-test before assuming the spread holds.
Location & tenants
- Location reads 66/100 on livability (#603 in FL) — a middle-class / working-renter tenant base. Strengths: crime A+, cost of living A+; Watch: health & safety C-, amenities F, commute F.
- Citrus (rural): math 49% / reading 50% proficiency, ranked #44 of 73 in FL (top 60%) — families likely to look elsewhere, expect single-tenant / working-renter base with shorter leases.
- Zoned schools: Crystal River Primary School (math 45% / reading 55%, grade D+, #1,070 of 2,144 statewide, top 51%, 654 students, 70% FRL); Crystal River High School (math 31% / reading 44%, grade F, #336 of 667 statewide, top 51%, 1,249 students, 56% FRL).
- Market conditions: 322 active listings in the ZIP; 2,443 units permitted in Citrus County in 2024 (0 in 5+ unit buildings).
- At $2,040/mo this rent would consume 48% of the median local household income ($51k/yr) (locally 264% of renters already pay >50% of income on rent) — very limited rent-growth headroom before tenants either downsize or default.
Forward outlook
- Local home prices are declining (-3.0%/yr); year-one equity from $2k of loan paydown is wiped out by about $7k of value loss. Plan a longer hold.
- Citrus County population projected to shrink 10% by 2050 — rents likely to lag national; underwrite the cash flow, not the appreciation.
Negotiation context
- It's been on market 312 days — a 12% lower offer ($192k) is reasonable based on typical stale-listing flexibility.
- Current owner paid $22k; list at $218k implies a 914% gain — meaningful room to come down on a strong offer.
Risks & watch-outs
- Watch-outs: flood insurance adds $66/mo.
- Climate carrying-cost: major flood risk; severe wind risk, 99% chance of damaging wind over 30y; major wildfire risk; extreme-heat days projected 7→24/yr by 2055 (HVAC capex compounding) — expect insurance premiums to compound above CPI over the hold.
Questions for the listing agent
- It's been on market 312 days. Have you received any prior offers? Is the seller open to a 12% concession, seller financing, or rate buy-down credit?
- What's the actual annual flood-insurance premium (NFIP or private), and is the property in a SFHA with mandatory coverage?
- Why hasn't it sold? Are there any deal-killer items the seller is aware of (foundation, flood, title, zoning, code violations)?
- Is there a deadline driving the sale (1031 exchange, divorce, estate, relocation)? That informs how much negotiation room exists.
- Schools are D-rated, which usually means shorter tenancies and higher turnover. Who's the typical renter profile here, and what's been the actual vacancy rate?
- The area grade is low — what's the realistic commute time and amenity access for the typical tenant pool here? Any planned neighborhood developments (good or bad) we should know about?
- What's the average days-on-market for RENTAL listings here right now (not sales)? A rising rental-DOM trend means longer vacancies and softer asking-rent achievability than the comps imply.
- What's the recent tenant-quality profile in this submarket — average credit score on applications, eviction rate, late-payment / NSF rate, and stable-employment percentage? A property-management company in the area should have these aggregated.
- How much new for-sale + rental construction is in the pipeline within 1–3 miles? Heavy new supply typically softens prices + rents 12–24 months out; constrained supply supports both.
Investment metrics
- 1% rule
- 0.94% ✗
- Cap rate
- 7.82%
- Cash-on-cash
- 5.45%
- DSCR
- 1.24
- GRM
- 8.9
CMA / ARV
- ARV (on-the-fly)
- $195,840
- Comps found
- 2
Show comp detail 2 sales within ~0.75 mi
| Address | Dist | Beds/Ba | Sqft | Sold | Price | $/sf | Match |
|---|---|---|---|---|---|---|---|
| 5111 N Elm Pt #1 | 0.56mi | 3/2.0 | 1,142 (+5%) | 12mo | $205,000 | $180 | 55 |
| 8309 W Graham Ct | 0.75mi | 2/2.0 (-1) | 924 (-15%) | 10mo | $110,000 | $119 | 27 |
Match score weights: distance 35% · size 25% · config 20% · recency 20%. Top-matched comps best support the ARV.
Projected returns pro-forma
-3.0% appreciation · 3.0% rent growth · sell at horizon
- IRR
- -9.8%
- Equity multiple
- 0.64×
- Total profit
- $-21,938
- Equity at exit
- $32,505
- IRR
- -0.5%
- Equity multiple
- 0.97×
- Total profit
- $-1,959
- Equity at exit
- $18,849
Cash invested: $61,040 (down + closing). Projections, not guarantees.
Landlord ↔ Tenant lean methodology
- Overall (STATE)
- 87 Strongly Landlord-Friendly
- State Florida
- 87 Strongly Landlord-Friendly · R+3
- County
- — inherits STATE
- City
- — inherits STATE
ZIP-level market 34428
- Home prices YoY
- -15.3%
- Active inventory
- 322
- Price-to-rent
- 8.9×
Monthly cashflow live
- Estimated rent
- $2,040 medium interval (Pro) →
- Mortgage (P&I)
- −$1,143
- Tax from tax record
- −$101 /mo · $1,209/yr
- Insurance
- −$91
- Flood insurance flood zone
- −$66 /mo · $798/yr
- HOA
- −$0
- Vacancy / Maint / Mgmt
- −$428
- Net cashflow
- $211
Break-even live
Sensitivity live
| Price | -10% $334 | -5% $272 | +0% $211 | +5% $149 | +10% $87 |
|---|---|---|---|---|---|
| Rent | -10% $50 | -5% $130 | +0% $211 | +5% $291 | +10% $372 |
| Rate | -1.0pp $321 | -0.5pp $266 | base $211 | +0.5pp $154 | +1.0pp $97 |
UW: 25.0% down · 7.5% · 30yr · 1.5% tax · 5.0% vac · 8.0% maint · 8.0% mgmt
Financing live
Cash to close
- Down payment
- $54,500
- Closing costs
- $6,540
- Reserves months
- —
- Total cash needed
- —
Loan-product check · same deal, 3 products live
Conventional
25% down · 7.5% · 30yr
- Down + closing
- —
- Monthly P&I
- —
- Monthly cashflow
- —
- DSCR
- —
- Eligible?
- —
Personal DTI + credit; lowest rate.
DSCR
20% down · 8.5% · 30yr
- Down + closing
- —
- Monthly P&I
- —
- Monthly cashflow
- —
- DSCR
- —
- Eligible?
- —
No personal income docs; deal must DSCR.
Hard money
10% down · 12.0% · 12mo
- Down + closing
- —
- Monthly P&I
- —
- Monthly cashflow
- —
- DSCR
- —
- Eligible?
- —
Short-term bridge; refi at stabilization.
Listing history 21 events
-
2026-06-21days on market $218,000 Active 312 DOM
-
2026-06-19days on market $218,000 Active 310 DOM
-
2026-06-18days on market $218,000 Active 309 DOM
-
2026-06-17days on market $218,000 Active 308 DOM
-
2026-06-16days on market $218,000 Active 307 DOM
-
2026-06-15days on market $218,000 Active 306 DOM
-
2026-06-14days on market $218,000 Active 304 DOM
-
2026-06-13days on market $218,000 Active 303 DOM
-
2026-06-09days on market $218,000 Active 300 DOM
-
2026-06-08days on market $218,000 Active 299 DOM
-
2026-06-03days on market $218,000 Active 294 DOM
-
2026-06-02days on market $218,000 Active 293 DOM
-
2026-06-01days on market $218,000 Active 292 DOM
-
2026-05-31days on market $218,000 Active 291 DOM
-
2026-05-30days on market $218,000 Active 290 DOM
-
2026-02-09price $218,000
-
2025-08-14$220,000 Active
-
2022-07-18soldstatus $21,500
-
2007-12-07soldstatus $11,200
-
2006-06-30soldstatus $20,000
-
1994-02-01soldstatus $5,000
ⓘ Source: listings_history table (triggers on properties + properties_extension) + one-shot
backfill from property_details.listing_events for pre-trigger history.
Tax reassessment forecast FL · Resets to sale price
- Current annual tax
- $1,209 · $101/mo
- Projected year-2 tax
- $1,809 · $151/mo
- Expected delta
- +$601/yr (+$50/mo · 49.7%)
ⓘ Screening estimate from a state-policy table — verify with the county assessor before closing.
Climate risk First Street
- Flood 7/10 Severe FEMA zone X (unshaded) · 68% chance over 30 yrs
- Wildfire 7/10 Severe
- Heat 9/10 Extreme 7 d/yr ≥109°F today · 24 d/yr by 30 yrs out
- Wind 9/10 Extreme 99% chance of damaging wind over 30 yrs
- Air quality 1/10 Low 0 unhealthy d/yr today · 0 by 30 yrs out
Nearby sold comps map
Loading sold comps map…
Walkable amenities ~0.75 mi
Loading nearby amenities…
Taxation est. · year 1
- Rental income
- $24,485
- − Mortgage interest
- −$12,211
- − Property taxes
- −$1,209
- − Insurance
- −$1,888
- − Repairs & maintenance
- −$1,959
- − Management
- −$1,959
- − Depreciation
- −$6,342
- Taxable loss
- −$1,082
- Est. tax savings @ 24.0%
- +$260
- After-tax cash flow
- $2,788/yr
For passive investors: Depreciation is non-cash, so a rental often shows a tax loss while cash-flowing — sheltering income. Rental losses are passive: they offset passive income freely, and up to $25,000/yr can offset ordinary (W-2) income if you actively participate and your MAGI is under $100k (phasing out to $0 by $150k); unused losses carry forward. On sale, claimed depreciation is recaptured at up to 25%, and gains may owe capital-gains tax (a 1031 exchange can defer both). Figures are a year-1 estimate at your 24.0% rate — not tax advice; consult a CPA.
Schools (NCES district)
- District
- Citrus
- NCES district ID
- 1200270
- Math proficiency
- 49% ▼ -10.00%
- Reading proficiency
- 50% ▼ -6.00%
- Median HH income
- $38,618
- Composite
- 41.28/100
- National rank
- #3519
- State rank
- #44 of 73 in FL
Livability — Crystal River
- Score
- 66/100
- State rank
- #603
- US rank
- #11564
Category grades
Schools grade is shown separately in the Schools card above.
Census & demographics
- County
- Citrus County · 111,314 people
- City population
- 10,163
- Metro
- Homosassa Springs, FL
- Population (ZIP)
- 10,163
- Household income
- $50,779
- Rent vs Own
- Severe rent burden
- 264.0
Population outlook (Citrus County) Hauer SSP2
- Today (2025)
- 138,622 people
- By 2030
- 136,886 · -1.3%
- By 2040
- 132,009 · -4.8%
- By 2050
- 125,196 · -9.7%
- By 2075
- 108,570 · -21.7%
- By 2100
- 84,454 · -39.1%
Race, ethnicity, and origin ACS 2023
- Neighborhood character
- Predominantly White (88%)
- Race & ethnicity
- White 88% Two or more races 6% Hispanic / Latino 5% Asian 2%
- Common ancestry
- Lithuanian 3% Romanian 3% Slovak 2%
- Foreign-born
- 5% · Canada, Jamaica, South Korea
- Languages at home
- 96% English-only · Spanish 3%
Political lean MEDSL · Citrus
- 2024 margin
- Solid R (+45.9) · D 26.8% · R 72.6%
- 2008→2024 swing
- -29.8pp toward R · 2008: -16.1pp · 2024: -45.9pp
- All cycles
- 2024: R+45.9 2020: R+41.0 2016: R+39.7 2012: R+21.9 2008: R+16.1
Not yet ingested
- Civics
- —
Market trends
- HPI YoY
- ▼ -57.32%
- Current HPI
- 317.7637
- Rent YoY
- —
- Metro
- Homosassa Springs, FL
- State GDP YoY
- ▲ 3.28%
- F500 in state
- 36
Industry mix (Fortune 500 HQ in FL)
| Industry | F500 HQs | Revenue |
|---|---|---|
| Industrial Technology | 2 | $29B |
|
||
| Insurance | 2 | $17B |
|
||
| Retail | 1 | $60B |
|
||
| Technology Distribution | 1 | $58B |
|
||
| Homebuilding | 1 | $35B |
|
||
| Technology Manufacturing | 1 | $35B |
|
||
Price history
+4260.0% since first listed6 events — show timeline
- 2026-02-09 Price Changed $218,000 Stellar MLS as Distributed by MLS Grid
- 2025-08-14 Listed $220,000 Stellar MLS as Distributed by MLS Grid
- 2022-07-18 Sold (Public Records) $21,500 Public Records
- 2007-12-07 Sold (Public Records) $11,200 Public Records
- 2006-06-30 Sold (Public Records) $20,000 Public Records
- 1994-02-01 Sold (Public Records) $5,000 Public Records
Property tax history
+25.0%/yrLatest (2025): $1,209 · +7.6% YoY. Source: county tax records.
Cash-flow waterfall
monthlySold comps — $/sqft
last 12 mo · ≤1 miLoading sold comps…