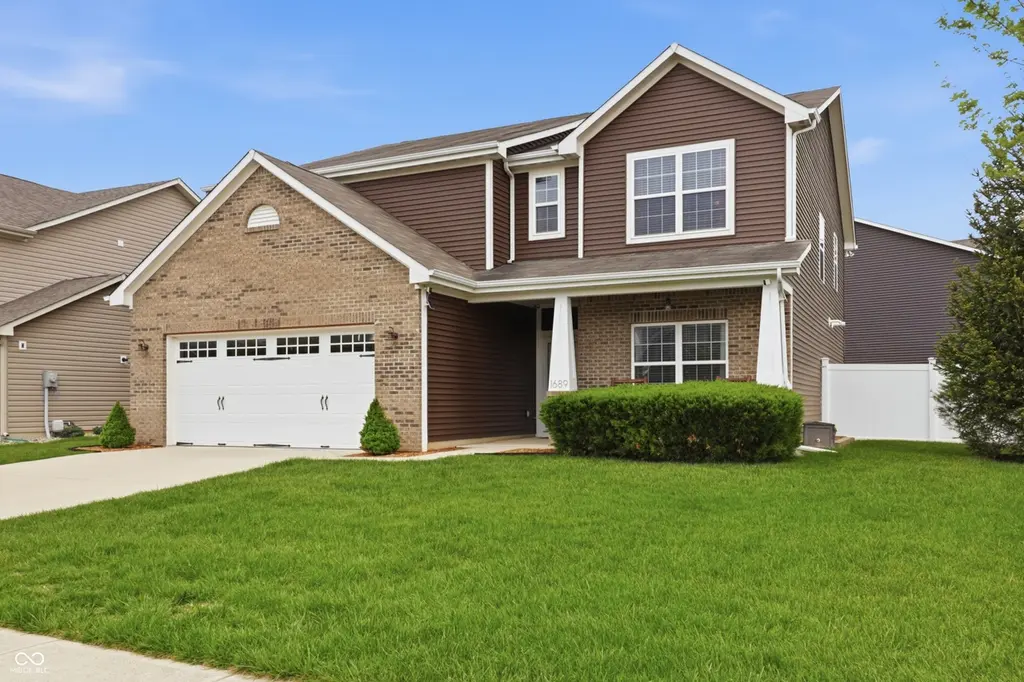
1689 Maplewood Ln · Pendleton, IN
Flood risk 1/10 · Minimal
- FEMA flood zone
- X (unshaded)
- Chance of flooding over 30 yrs
- 0.0%
- Est. flood insurance / yr
- $507 – $1,088
Fire risk 1/10 · Minimal
- Est. fire insurance / yr
- $717 – $1,331
Heat risk 3/10 · Minor
- Hot days now (above 100°F)
- 7 days/yr
- Hot days in 30 yrs
- 18 days/yr
Wind risk 2/10 · Minimal
- Chance of severe wind over 30 yrs
- 1.0%
Air-quality risk 2/10 · Minimal
- Unhealthy air days now
- 1 days/yr
- Unhealthy air days in 30 yrs
- 1 days/yr
Risk factors via First Street. Map © Google.
Why this score? — see what drove the D+ grade
The composite is a weighted blend of 9 inputs, each scored 0–100. Each bar is that input's sub-score; the figure is the points it added to the 100-point composite (weight × sub-score).
- ARV discount +14.0/15.0
- Cash flow +13.7/30.0
- DSCR +4.2/10.0
- Schools +4.2/10.0
- Livability +3.7/5.0
- 1% rule +3.3/10.0
- Rent growth +2.5/5.0
- Condition / age +2.5/5.0
- Appreciation +0.0/10.0
$369,000
🖨 Deal sheet (PDF) 📄 Offer letter ✓ Due diligence
Listing remarks
Welcome home to this exceptionally well-maintained 5-bedroom residence in the desirable Maplewood at Huntzinger Farm community. Situated on a spacious, fully fenced lot, this property offers a private backyard retreat complete with a beautiful outdoor oasis. The heart of the home is the open-concept kitchen with tons of storage and counter space, featuring quartz countertops, stainless steel appliances, and a large eat-in island-perfect for both everyday living and entertaining. The kitchen flows seamlessly into the oversized living room, creating an inviting space for gatherings of any size. A formal dining room adds even more flexibility, ideal for hosting dinner parties or enjoying famil
Key facts
- Quartz countertops
- Large eat-in island
- Open-concept kitchen
Tags
Property features AI
Finance
- HOA & community: Homeowners association with an annual fee of $237
Exterior
- Parking: Attached garage (2-car)
- Utilities: Public water; Municipal sewer connected; No solid waste service listed
- Home design: Single family residence; Two levels
- Construction: Vinyl with brick exterior; Slab foundation
- Exterior features: Lot under 1/4 acre
Interior
- Kitchen: Dishwasher; Gas oven; Refrigerator
- Bedrooms: Five bedrooms total (one on the main level, four on the upper level)
- Bathrooms: Two full bathrooms; One half bathroom
- Heating & cooling: Forced air heating (natural gas); Central air conditioning
- Interior features: Water softener (owned); Garbage disposal; Microhood
- Laundry & utility: Laundry room (upper level); Gas water heater
Neighborhood map
What this means for you Summary
Snapshot
- This is a 5-bed/2.5-bath single-family listed at $369k.
Deal economics
- At list price, monthly cash flow is $30 ($355/yr) — positive.
- The deal already cash-flows at list — no discount required.
- To meet the 1% rule (rent ≥ 1% of price), the offer needs to be $305k (17.3% below list).
- Recommended offer: $305k (17.3% below list) — sets the bar for 1% rule.
- Cap rate 6.4% vs local median 3.3% in Pendleton — top-decile yield for the area; either an underpriced asset or a hidden risk that comps aren't pricing in. Stress-test before assuming the spread holds.
Location & tenants
- Location reads 73/100 on livability (#86 in IN) — a middle-class / working-renter tenant base. Strengths: crime A+, cost of living A+, housing A+; Watch: amenities F, commute F, health & safety F.
- South Madison Community School Corporation (rural): math 44% / reading 52% proficiency, ranked #60 of 301 in IN (top 20%) — families likely to look elsewhere, expect single-tenant / working-renter base with shorter leases.
- Zoned schools: Pendleton Elementary School (math 54% / reading 49%, grade C-, #256 of 994 statewide, top 26%, 840 students, 36% FRL); Pendleton Heights Middle School (math 37% / reading 48%, grade D-, #98 of 330 statewide, top 30%, 721 students, 36% FRL); Pendleton Heights High School (math 36% / reading 77%, grade C, #70 of 369 statewide, top 19%, 1,357 students, 31% FRL).
- Market conditions: 237 active listings in the ZIP; 1 comparable units currently listed for rent nearby; 184 units permitted in Madison County in 2024 (0 in 5+ unit buildings).
Forward outlook
- Local home prices are declining (-3.0%/yr); year-one equity from $3k of loan paydown is wiped out by about $11k of value loss. Plan a longer hold.
- Madison County population projected at -14% by 2050 — secular population decline; favor cash flow + early exit over multi-decade hold.
Negotiation context
- It's been on market 34 days — a 3% lower offer ($358k) is reasonable based on typical stale-listing flexibility.
- 2 sale attempts with the ask held roughly flat each time — persistent listings suggest the price (not the market) is what's stuck; bring a comps-based counter.
Questions for the listing agent
- It's been on market 34 days. Have you received any prior offers? Is the seller open to a 17% concession, seller financing, or rate buy-down credit?
- What does the HOA fee cover, when was the last increase, and are there any pending special assessments or reserve-fund shortfalls?
- Is there a deadline driving the sale (1031 exchange, divorce, estate, relocation)? That informs how much negotiation room exists.
- The area grade is low — what's the realistic commute time and amenity access for the typical tenant pool here? Any planned neighborhood developments (good or bad) we should know about?
- What's the average days-on-market for RENTAL listings here right now (not sales)? A rising rental-DOM trend means longer vacancies and softer asking-rent achievability than the comps imply.
- What's the recent tenant-quality profile in this submarket — average credit score on applications, eviction rate, late-payment / NSF rate, and stable-employment percentage? A property-management company in the area should have these aggregated.
- How much new for-sale + rental construction is in the pipeline within 1–3 miles? Heavy new supply typically softens prices + rents 12–24 months out; constrained supply supports both.
Investment metrics
- 1% rule
- 0.83% ✗
- Cap rate
- 6.39%
- Cash-on-cash
- 0.34%
- DSCR
- 1.02
- GRM
- 10.1
CMA / ARV
- ARV (on-the-fly)
- $431,230
- Comps found
- 12
Show comp detail 12 sales within ~0.75 mi
| Address | Dist | Beds/Ba | Sqft | Sold | Price | $/sf | Match |
|---|---|---|---|---|---|---|---|
| 251 Winding Brook Way | 0.12mi | 4/3.0 (-1) | 2,961 (-0%) | 8mo | $386,995 | $131 | 80 |
| 276 Winding Brook Way | 0.31mi | 5/2.5 | 2,999 (+1%) | 10mo | $402,567 | $134 | 76 |
| 2018 Cold Springs Dr | 0.03mi | 4/2.5 (-1) | 2,885 (-3%) | 20mo | $370,000 | $128 | 72 |
| 2081 Maplewood Ln | 0.08mi | 4/3.5 (-1) | 3,198 (+8%) | 18mo | $385,000 | $120 | 60 |
| 1932 Pebble Beach Dr | 0.39mi | 4/2.5 (-1) | 2,740 (-8%) | 6mo | $464,667 | $170 | 59 |
| 1510 Pebble Beach Dr | 0.45mi | 4/2.5 (-1) | 2,723 (-8%) | 4mo | $416,712 | $153 | 57 |
| 1627 Pebble Beach Dr | 0.39mi | 4/2.5 (-1) | 2,612 (-12%) | 1mo | $379,510 | $145 | 56 |
| 4161 W 900 S | 0.54mi | 4/2.5 (-1) | 2,784 (-6%) | 5mo | $525,000 | $189 | 55 |
| 1601 Fair Weather Dr | 0.24mi | 4/3.5 (-1) | 3,126 (+5%) | 20mo | $335,000 | $107 | 55 |
| 1672 Creek Bed Ln | 0.29mi | 4/2.5 (-1) | 2,656 (-11%) | 13mo | $360,757 | $136 | 53 |
| 206 Winding Brook Way | 0.13mi | 4/2.5 (-1) | 2,610 (-12%) | 22mo | $380,995 | $146 | 50 |
| 1523 Pebble Beach Dr | 0.45mi | 4/4.5 (-1) | 2,647 (-11%) | 6mo | $395,191 | $149 | 42 |
Match score weights: distance 35% · size 25% · config 20% · recency 20%. Top-matched comps best support the ARV.
Projected returns pro-forma
-3.0% appreciation · 3.0% rent growth · sell at horizon
- IRR
- -15.8%
- Equity multiple
- 0.44×
- Total profit
- $-57,968
- Equity at exit
- $55,019
- IRR
- -7.4%
- Equity multiple
- 0.53×
- Total profit
- $-48,288
- Equity at exit
- $31,904
Cash invested: $103,320 (down + closing). Projections, not guarantees.
Landlord ↔ Tenant lean methodology
- Overall (STATE)
- 90 Strongly Landlord-Friendly
- State Indiana
- 90 Strongly Landlord-Friendly · R+11
- County
- — inherits STATE
- City
- — inherits STATE
ZIP-level market 46064
- Active inventory
- 237
- Price-to-rent
- 10.1×
Monthly cashflow live
- Estimated rent
- $3,050 medium interval (Pro) →
- Mortgage (P&I)
- −$1,935
- Tax from tax record
- −$271 /mo · $3,253/yr
- Insurance
- −$154
- HOA
- −$20
- Vacancy / Maint / Mgmt
- −$640
- Net cashflow
- $30
Break-even live
Sensitivity live
| Price | -10% $238 | -5% $134 | +0% $30 | +5% $-75 | +10% $-179 |
|---|---|---|---|---|---|
| Rent | -10% $-211 | -5% $-91 | +0% $30 | +5% $150 | +10% $271 |
| Rate | -1.0pp $215 | -0.5pp $123 | base $30 | +0.5pp $-66 | +1.0pp $-163 |
UW: 25.0% down · 7.5% · 30yr · 1.5% tax · 5.0% vac · 8.0% maint · 8.0% mgmt
Financing live
Cash to close
- Down payment
- $92,250
- Closing costs
- $11,070
- Reserves months
- —
- Total cash needed
- —
Loan-product check · same deal, 3 products live
Conventional
25% down · 7.5% · 30yr
- Down + closing
- —
- Monthly P&I
- —
- Monthly cashflow
- —
- DSCR
- —
- Eligible?
- —
Personal DTI + credit; lowest rate.
DSCR
20% down · 8.5% · 30yr
- Down + closing
- —
- Monthly P&I
- —
- Monthly cashflow
- —
- DSCR
- —
- Eligible?
- —
No personal income docs; deal must DSCR.
Hard money
10% down · 12.0% · 12mo
- Down + closing
- —
- Monthly P&I
- —
- Monthly cashflow
- —
- DSCR
- —
- Eligible?
- —
Short-term bridge; refi at stabilization.
Rent comps 1 comps
| Address | Beds | Baths | Sqft | Rent | $/sqft | DOM | Units | Dist |
|---|---|---|---|---|---|---|---|---|
| 1620 Creek Bed Ln Pendleton, IN | 5.0 | 3.0 | 2961 | $3,050 | $1.03 | 0d | 1 | 0.29mi |
HOA detail
- Monthly dues
- $20 · $240/yr
Listing history 5 events
-
2026-05-20status Pending
-
2026-04-30price $369,000
-
2026-04-14$379,000 Active
-
2025-08-14historical
-
2025-07-18$388,800 Active
ⓘ Source: listings_history table (triggers on properties + properties_extension) + one-shot
backfill from property_details.listing_events for pre-trigger history.
Tax reassessment forecast IN · Partial reset (capped growth)
- Current annual tax
- $3,253 · $271/mo
- Projected year-2 tax
- $3,253 · $271/mo
- Expected delta
- $0/yr ($0/mo · 0.0%)
ⓘ Screening estimate from a state-policy table — verify with the county assessor before closing.
Climate risk First Street
- Flood 1/10 Low FEMA zone X (unshaded) · 0% chance over 30 yrs
- Wildfire 1/10 Low
- Heat 3/10 Moderate 7 d/yr ≥100°F today · 18 d/yr by 30 yrs out
- Wind 2/10 Low 100% chance of damaging wind over 30 yrs
- Air quality 2/10 Low 1 unhealthy d/yr today · 1 by 30 yrs out
Nearby sold comps map
Loading sold comps map…
Walkable amenities ~0.75 mi
Loading nearby amenities…
Taxation est. · year 1
- Rental income
- $36,600
- − Mortgage interest
- −$20,670
- − Property taxes
- −$3,253
- − Insurance
- −$1,845
- − Repairs & maintenance
- −$2,928
- − Management
- −$2,928
- − HOA
- −$240
- − Depreciation
- −$10,735
- Taxable loss
- −$5,998
- Est. tax savings @ 24.0%
- +$1,440
- After-tax cash flow
- $1,795/yr
For passive investors: Depreciation is non-cash, so a rental often shows a tax loss while cash-flowing — sheltering income. Rental losses are passive: they offset passive income freely, and up to $25,000/yr can offset ordinary (W-2) income if you actively participate and your MAGI is under $100k (phasing out to $0 by $150k); unused losses carry forward. On sale, claimed depreciation is recaptured at up to 25%, and gains may owe capital-gains tax (a 1031 exchange can defer both). Figures are a year-1 estimate at your 24.0% rate — not tax advice; consult a CPA.
Schools (NCES district)
- District
- South Madison Community School Corporation
- NCES district ID
- 1810440
- Math proficiency
- 44% ▼ -13.00%
- Reading proficiency
- 52% ▼ -6.00%
- Median HH income
- $63,565
- Composite
- 42.4/100
- National rank
- #3231
- State rank
- #60 of 301 in IN
Livability — Pendleton
- Score
- 73/100
- State rank
- #86
- US rank
- #5014
Category grades
Schools grade is shown separately in the Schools card above.
Census & demographics
- Census place
- Pendleton, IN
- City population
- 17,730
- Population (ZIP)
- 17,730
Population outlook (Madison County) Hauer SSP2
- Today (2025)
- 125,800 people
- By 2030
- 122,640 · -2.5%
- By 2040
- 115,420 · -8.3%
- By 2050
- 108,148 · -14.0%
- By 2075
- 91,838 · -27.0%
- By 2100
- 75,670 · -39.8%
Race, ethnicity, and origin ACS 2023
- Neighborhood character
- Predominantly White (86%)
- Race & ethnicity
- White 86% Two or more races 6% Black 5% Hispanic / Latino 3% Asian 1%
- Common ancestry
- Slovak 3% Italian 2% Romanian 1%
- Foreign-born
- 2% · Canada
- Languages at home
- 96% English-only · Spanish 2% Other Indo-European 1%
Political lean MEDSL · Madison
- 2024 margin
- Strong R (+26.9) · D 35.6% · R 62.5% · Other 1.9%
- 2008→2024 swing
- -33.5pp toward R · 2008: 6.5pp · 2024: -26.9pp
- All cycles
- 2024: R+26.9 2020: R+22.6 2016: R+25.7 2012: R+4.5 2008: D+6.5
Not yet ingested
- Civics
- —
Market trends
- HPI YoY
- ▼ -160.39%
- Current HPI
- 227.4921
- Rent YoY
- —
- Metro
- —
- State GDP YoY
- ▲ 2.90%
- F500 in state
- 18
Industry mix (Fortune 500 HQ in IN)
| Industry | F500 HQs | Revenue |
|---|---|---|
| Industrial Machinery | 2 | $37B |
|
||
| Healthcare | 1 | $177B |
|
||
| Pharmaceuticals | 1 | $45B |
|
||
| Metals / Steel | 1 | $18B |
|
||
| Agriculture | 1 | $17B |
|
||
| Packaging | 1 | $12B |
|
||
Price history
-5.1% since first listed5 events — show timeline
- 2026-05-20 Pending — MIBOR as Distributed by MLS Grid
- 2026-04-30 Price Changed $369,000 MIBOR as Distributed by MLS Grid
- 2026-04-14 Listed $379,000 MIBOR as Distributed by MLS Grid
- 2025-08-14 Listing Removed — MIBOR as Distributed by MLS Grid
- 2025-07-18 Listed $388,800 MIBOR as Distributed by MLS Grid
Property tax history
+67.7%/yrLatest (2024): $3,253 · +6.6% YoY. Source: county tax records.
Cash-flow waterfall
monthlySold comps — $/sqft
last 12 mo · ≤1 miLoading sold comps…