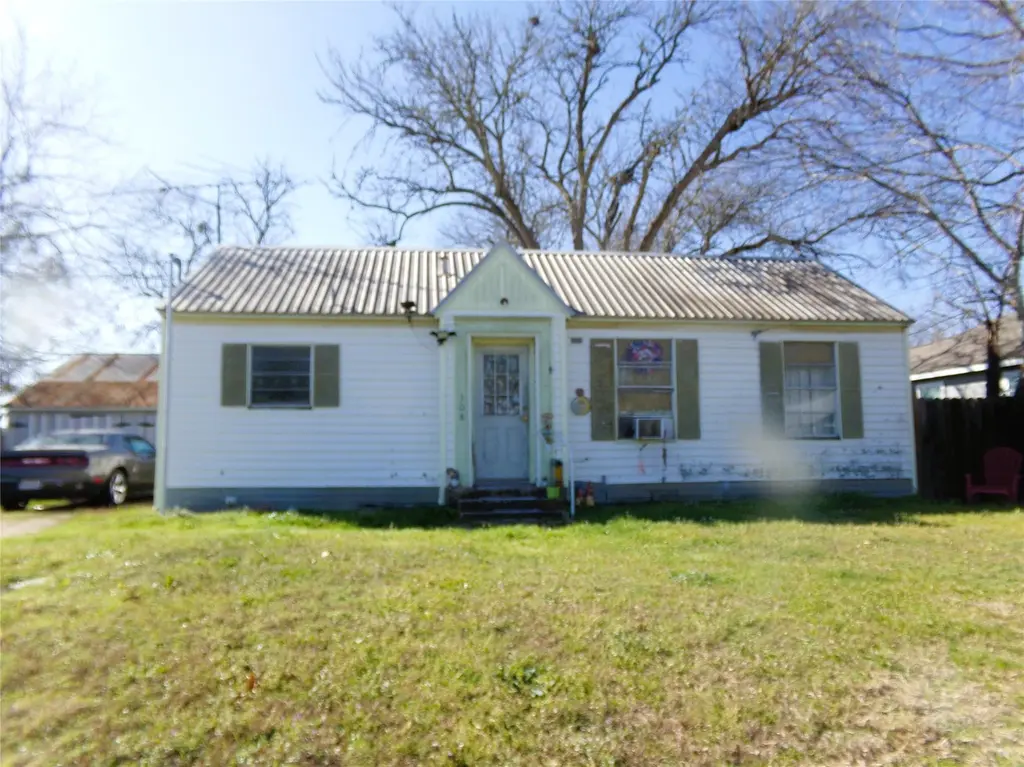
308 E East South St · Weimar, TX
Flood risk 1/10 · Minimal
- FEMA flood zone
- X (unshaded)
- Chance of flooding over 30 yrs
- 0.0%
- Est. flood insurance / yr
- $507 – $1,088
Fire risk 5/10 · Moderate
- Est. fire insurance / yr
- $1,222 – $2,270
Heat risk 8/10 · Major
- Hot days now (above 110°F)
- 7 days/yr
- Hot days in 30 yrs
- 21 days/yr
Wind risk 8/10 · Major
- Chance of severe wind over 30 yrs
- 99.0%
Air-quality risk 1/10 · Minimal
- Unhealthy air days now
- 0 days/yr
- Unhealthy air days in 30 yrs
- 0 days/yr
Risk factors via First Street. Map © Google.
Why this score? — see what drove the C+ grade
The composite is a weighted blend of 9 inputs, each scored 0–100. Each bar is that input's sub-score; the figure is the points it added to the 100-point composite (weight × sub-score).
- Cash flow +27.3/30.0
- DSCR +9.5/10.0
- ARV discount +7.5/15.0
- 1% rule +7.3/10.0
- Schools +4.4/10.0
- Livability +3.4/5.0
- Rent growth +2.5/5.0
- Condition / age +2.5/5.0
- Appreciation +0.0/10.0
$69,500
🖨 Deal sheet (PDF) 📄 Offer letter ✓ Due diligence
Listing remarks MLS
This cozy home offers an excellent opportunity for first-time buyers or savvy investors. With its practical layout and manageable size, the property is perfectly suited as a starter home or income-producing investment. Reasonable priced and full of potential, this home provides affordability without sacrificing comfort. Whether you're looking to step into homeownership or expand your rental portfolio, this property is worth a look.
Key facts
- 5,967 sq ft lot
- Garage
- Built 1940
Neighborhood map
What this means for you Summary
Snapshot
- This is a 1-bed/1.0-bath single-family listed at $70k.
Deal economics
- At list price, monthly cash flow is $200 ($2k/yr) — positive.
- The deal already cash-flows at list — no discount required.
- Meets the 1% rule at list price ($856 rent vs $70k).
- Recommended offer: $63k (9.0% below list) — sets the bar for market timing.
- Cap rate 9.8% vs local median 0.8% in Weimar — top-decile yield for the area; either an underpriced asset or a hidden risk that comps aren't pricing in. Stress-test before assuming the spread holds.
Location & tenants
- Location reads 67/100 on livability (#515 in TX) — a middle-class / working-renter tenant base. Strengths: cost of living A+, housing A+; Watch: health & safety C-, employment D+, amenities F.
- Weimar ISD (rural): math 56% / reading 48% proficiency, ranked #144 of 826 in TX (top 17%) — acceptable for families but not a draw, mixed tenant base, ~2y average lease.
- Zoned schools: Weimar El (math 52% / reading 57%, grade C, #621 of 4,322 statewide, top 15%, 302 students, 60% FRL); Weimar J H (math 57% / reading 42%, grade C, #356 of 1,662 statewide, top 23%, 214 students, 64% FRL); Weimar H S (math 64% / reading 54%, grade C+, #275 of 1,632 statewide, top 19%, 188 students, 56% FRL) — zoned schools at 60% FRL track the district average.
- Market conditions: 88 active listings in the ZIP; 29 units permitted in Colorado County in 2024 (0 in 5+ unit buildings).
Forward outlook
- Local home prices are declining (-3.0%/yr); year-one equity from $481 of loan paydown is wiped out by about $2k of value loss. Plan a longer hold.
- At projected returns (-3.0% appreciation + 3.0% rent growth), your $19k cash investment doubles in ~10 years — after that, you're playing with house money.
Negotiation context
- It's been on market 117 days — a 9% lower offer ($63k) is reasonable based on typical stale-listing flexibility.
Risks & watch-outs
- Watch-outs: built in 1940 — expect roof / HVAC / electrical / plumbing capex.
- Climate carrying-cost: severe wind risk, 99% chance of damaging wind over 30y; moderate wildfire risk; extreme-heat days projected 7→21/yr by 2055 (HVAC capex compounding) — expect insurance premiums to compound above CPI over the hold.
Questions for the listing agent
- It's been on market 117 days. Have you received any prior offers? Is the seller open to a 9% concession, seller financing, or rate buy-down credit?
- Built in 1940 — when were the roof, HVAC, electrical panel, plumbing, and water heater last replaced?
- Why hasn't it sold? Are there any deal-killer items the seller is aware of (foundation, flood, title, zoning, code violations)?
- Is there a deadline driving the sale (1031 exchange, divorce, estate, relocation)? That informs how much negotiation room exists.
- What's the average days-on-market for RENTAL listings here right now (not sales)? A rising rental-DOM trend means longer vacancies and softer asking-rent achievability than the comps imply.
- What's the recent tenant-quality profile in this submarket — average credit score on applications, eviction rate, late-payment / NSF rate, and stable-employment percentage? A property-management company in the area should have these aggregated.
- How much new for-sale + rental construction is in the pipeline within 1–3 miles? Heavy new supply typically softens prices + rents 12–24 months out; constrained supply supports both.
Investment metrics
- 1% rule
- 1.23% ✓
- Cap rate
- 9.75%
- Cash-on-cash
- 12.35%
- DSCR
- 1.55
- GRM
- 6.8
CMA / ARV
- ARV (median comp)
- $173,192
- List price
- $69,500
- Delta
- -59.87%
- Verdict
- UNDERPRICED
- Comps
- 2 within 1.0 mi
Show comp detail 1 sale within ~0.75 mi
| Address | Dist | Beds/Ba | Sqft | Sold | Price | $/sf | Match |
|---|---|---|---|---|---|---|---|
| 205 N Summit St | 0.73mi | 2/1.0 (+1) | 836 (+13%) | 23mo | $189,000 | $226 | 20 |
Match score weights: distance 35% · size 25% · config 20% · recency 20%. Top-matched comps best support the ARV.
Projected returns pro-forma
-3.0% appreciation · 3.0% rent growth · sell at horizon
- IRR
- 2.0%
- Equity multiple
- 1.08×
- Total profit
- $1,503
- Equity at exit
- $10,363
- IRR
- 11.6%
- Equity multiple
- 1.91×
- Total profit
- $17,774
- Equity at exit
- $6,009
Cash invested: $19,460 (down + closing). Projections, not guarantees.
Landlord ↔ Tenant lean methodology
- Overall (STATE)
- 87 Strongly Landlord-Friendly
- State Texas
- 87 Strongly Landlord-Friendly · R+5
- County
- — inherits STATE
- City
- — inherits STATE
ZIP-level market 78962
- Home prices YoY
- -17.5%
- Active inventory
- 88
- Price-to-rent
- 6.8×
Monthly cashflow live
- Estimated rent
- $856 medium interval (Pro) →
- Mortgage (P&I)
- −$364
- Tax from tax record
- −$83 /mo · $991/yr
- Insurance
- −$29
- HOA
- −$0
- Vacancy / Maint / Mgmt
- −$180
- Net cashflow
- $200
Break-even live
Sensitivity live
| Price | -10% $240 | -5% $220 | +0% $200 | +5% $181 | +10% $161 |
|---|---|---|---|---|---|
| Rent | -10% $133 | -5% $166 | +0% $200 | +5% $234 | +10% $268 |
| Rate | -1.0pp $235 | -0.5pp $218 | base $200 | +0.5pp $182 | +1.0pp $164 |
UW: 25.0% down · 7.5% · 30yr · 1.5% tax · 5.0% vac · 8.0% maint · 8.0% mgmt
Financing live
Cash to close
- Down payment
- $17,375
- Closing costs
- $2,085
- Reserves months
- —
- Total cash needed
- —
Loan-product check · same deal, 3 products live
Conventional
25% down · 7.5% · 30yr
- Down + closing
- —
- Monthly P&I
- —
- Monthly cashflow
- —
- DSCR
- —
- Eligible?
- —
Personal DTI + credit; lowest rate.
DSCR
20% down · 8.5% · 30yr
- Down + closing
- —
- Monthly P&I
- —
- Monthly cashflow
- —
- DSCR
- —
- Eligible?
- —
No personal income docs; deal must DSCR.
Hard money
10% down · 12.0% · 12mo
- Down + closing
- —
- Monthly P&I
- —
- Monthly cashflow
- —
- DSCR
- —
- Eligible?
- —
Short-term bridge; refi at stabilization.
Listing history 20 events
-
2026-06-21days on market $69,500 Active 117 DOM
-
2026-06-21days on market $69,500 Active 116 DOM
-
2026-06-18days on market $69,500 Active 114 DOM
-
2026-06-17days on market $69,500 Active 113 DOM
-
2026-06-16days on market $69,500 Active 112 DOM
-
2026-06-15days on market $69,500 Active 111 DOM
-
2026-06-15days on market $69,500 Active 110 DOM
-
2026-06-13days on market $69,500 Active 109 DOM
-
2026-06-12days on market $69,500 Active 108 DOM
-
2026-06-09days on market $69,500 Active 105 DOM
-
2026-06-08days on market $69,500 Active 103 DOM
-
2026-06-05days on market $69,500 Active 101 DOM
-
2026-06-03days on market $69,500 Active 99 DOM
-
2026-06-02days on market $69,500 Active 98 DOM
-
2026-06-01days on market $69,500 Active 97 DOM
-
2026-05-31days on market $69,500 Active 96 DOM
-
2026-04-29price $69,500 435-char remark
Show marketing remark (435 chars)
This cozy home offers an excellent opportunity for first-time buyers or savvy investors. With its practical layout and manageable size, the property is perfectly suited as a starter home or income-producing investment. Reasonable priced and full of potential, this home provides affordability without sacrificing comfort. Whether you're looking to step into homeownership or expand your rental portfolio, this property is worth a look.
-
2026-02-24$74,500 Active 435-char remark
Show marketing remark (435 chars)
This cozy home offers an excellent opportunity for first-time buyers or savvy investors. With its practical layout and manageable size, the property is perfectly suited as a starter home or income-producing investment. Reasonable priced and full of potential, this home provides affordability without sacrificing comfort. Whether you're looking to step into homeownership or expand your rental portfolio, this property is worth a look.
-
2014-08-05soldstatus
-
2007-11-01soldstatus
ⓘ Source: listings_history table (triggers on properties + properties_extension) + one-shot
backfill from property_details.listing_events for pre-trigger history.
Tax reassessment forecast TX · Resets to sale price
- Current annual tax
- $991 · $83/mo
- Projected year-2 tax
- $1,272 · $106/mo
- Expected delta
- +$281/yr (+$23/mo · 28.4%)
ⓘ Screening estimate from a state-policy table — verify with the county assessor before closing.
Climate risk First Street
- Flood 1/10 Low FEMA zone X (unshaded) · 0% chance over 30 yrs
- Wildfire 5/10 Major
- Heat 8/10 Severe 7 d/yr ≥110°F today · 21 d/yr by 30 yrs out
- Wind 8/10 Severe 99% chance of damaging wind over 30 yrs
- Air quality 1/10 Low 0 unhealthy d/yr today · 0 by 30 yrs out
Nearby sold comps map
Loading sold comps map…
Walkable amenities ~0.75 mi
Loading nearby amenities…
Taxation est. · year 1
- Rental income
- $10,272
- − Mortgage interest
- −$3,893
- − Property taxes
- −$991
- − Insurance
- −$348
- − Repairs & maintenance
- −$822
- − Management
- −$822
- − Depreciation
- −$2,022
- Taxable income
- $1,375
- Est. tax owed @ 24.0%
- −$330
- After-tax cash flow
- $2,073/yr
For passive investors: Depreciation is non-cash, so a rental often shows a tax loss while cash-flowing — sheltering income. Rental losses are passive: they offset passive income freely, and up to $25,000/yr can offset ordinary (W-2) income if you actively participate and your MAGI is under $100k (phasing out to $0 by $150k); unused losses carry forward. On sale, claimed depreciation is recaptured at up to 25%, and gains may owe capital-gains tax (a 1031 exchange can defer both). Figures are a year-1 estimate at your 24.0% rate — not tax advice; consult a CPA.
Schools (NCES district)
- District
- Weimar ISD
- NCES district ID
- 4844820
- Math proficiency
- 56% ▼ -1.00%
- Reading proficiency
- 48% ▲ 2.00%
- Median HH income
- $48,743
- Composite
- 44.36/100
- National rank
- #2820
- State rank
- #144 of 826 in TX
Livability — Weimar
- Score
- 67/100
- State rank
- #515
- US rank
- #10174
Category grades
Schools grade is shown separately in the Schools card above.
Census & demographics
- Census place
- Weimar, TX
- Population (ZIP)
- 5,245
Population outlook (Colorado County) Hauer SSP2
- Today (2025)
- 20,932 people
- By 2030
- 20,803 · -0.6%
- By 2040
- 20,518 · -2.0%
- By 2050
- 20,325 · -2.9%
- By 2075
- 20,086 · -4.0%
- By 2100
- 18,228 · -12.9%
Race, ethnicity, and origin ACS 2023
- Neighborhood character
- Majority White (65%)
- Race & ethnicity
- White 65% Hispanic / Latino 23% Black 12% Two or more races 6%
- Hispanic origin (detail)
- Mexican 20%
- Common ancestry
- Italian 2% Lithuanian 2% Iranian 1%
- Foreign-born
- 8% · Canada
- Languages at home
- 84% English-only · Spanish 15%
Political lean MEDSL · Colorado
- 2024 margin
- Solid R (+57.2) · D 21.1% · R 78.3%
- 2008→2024 swing
- -17.9pp toward R · 2008: -39.4pp · 2024: -57.2pp
- All cycles
- 2024: R+57.2 2020: R+50.6 2016: R+51.2 2012: R+49.3 2008: R+39.4
Not yet ingested
- Civics
- —
Market trends
- HPI YoY
- ▼ -43.77%
- Current HPI
- 205.9933
- Rent YoY
- —
- Metro
- —
- State GDP YoY
- ▲ 3.95%
- F500 in state
- 110
Industry mix (Fortune 500 HQ in TX)
| Industry | F500 HQs | Revenue |
|---|---|---|
| Energy | 16 | $1,198B |
|
||
| Technology | 5 | $198B |
|
||
| Engineering / Construction | 4 | $72B |
|
||
| Energy Services | 3 | $60B |
|
||
| Utilities | 3 | $41B |
|
||
| Healthcare | 2 | $330B |
|
||
Price history
-6.7% since first listed4 events — show timeline
- 2026-04-29 Price Changed $69,500 HARMLS
- 2026-02-24 Listed $74,500 HARMLS
- 2014-08-05 Sold (Public Records) — Public Records
- 2007-11-01 Sold (Public Records) — Public Records
Property tax history
+2.4%/yrLatest (2025): $991 · +6.1% YoY. Source: county tax records.
Cash-flow waterfall
monthlySold comps — $/sqft
last 12 mo · ≤1 miLoading sold comps…